Advanced report automation
- Home
- Resources
- User manual
- think-cell Charts: Data visualization
- Advanced report automation
Advanced report automation is available with think-cell Suite.
Automatically create reports and other presentations that you regularly update. think-cell's advanced report automation fills PowerPoint templates with your latest Excel or JSON data.
With the Excel data automation, use the think-cell API to fill think-cell elements in your template with data from Excel. For more information, see Automation with Excel data.
With the JSON data automation, use a .ppttc file to fill think-cell elements in your template with JSON data. You can access the JSON data and PowerPoint templates locally or remotely, and you can create presentations with a web service. For more information, see Automation with JSON data.
Chart annotations automatically update along with your charts. If you add difference arrows, trendlines, and other annotations to a chart in your template, in the new presentation, both the chart and annotations will reflect the latest data.
To use think-cell's advanced report automation, you need the following:
- A PowerPoint presentation with think-cell charts or other elements
- Programmatic logic to fill the elements with data
Create PowerPoint templates for report automation
To automatically create a report, you need a PowerPoint presentation that serves as a template for your new presentation. The template must contain one or more think-cell elements that you want to fill with data.
If you're using the Excel automation API PresentationFromTemplate, the elements that you want to fill with data must be linked to Excel (see Excel data links).
If you're using JSON data automation or the Excel automation API UpdateBatch, the elements that you want to fill with data must have names. To name an element, do one of the following:
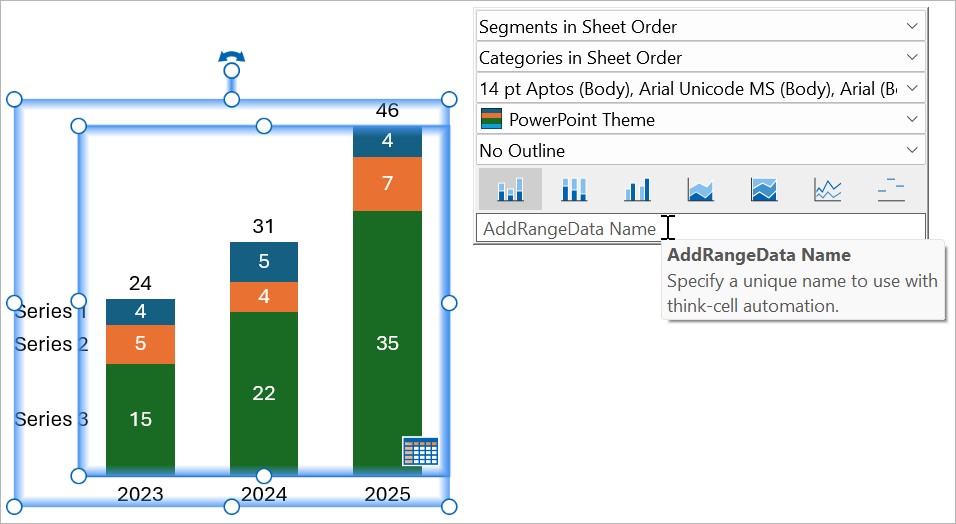
- To name a think-cell chart, table, Harvey ball, or checkbox, select the element to open its mini toolbar. In AddRangeData Name, enter a unique name and select Enter.
-
To name an automation text field, follow these steps:
- Insert the object in which you want to place the automation text field. The object can be a think-cell text box, pentagon, chevron, rounded rectangle, or a PowerPoint shape.
- In the object, place the text cursor where you want to add the text field.
- On the Insert ribbon tab, select Elements > Automation Text Field

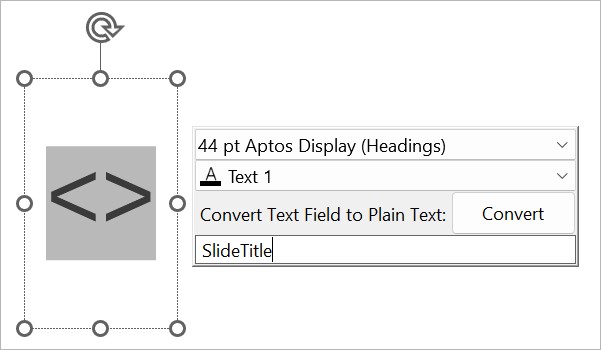
- Select the automation text field, represented by two angle brackets (<>), to open the mini toolbar. In AddRangeData Name, enter a unique name and select Enter.
You can add more than one automation text field to an object. An object can contain both automation text fields and regular text.
- For Excel automation only: to name an image of a table (see Create images of tables), select the table to open its mini toolbar. In AddRangeImage Name, enter a unique name and select Enter.
PowerPoint template example
For JSON data automation and the Excel automation API UpdateBatch, here's how to create an example PowerPoint template with a stacked column chart and a slide title:
- In PowerPoint, go to the Home tab. In the Slides group, select Layout > Title Only.
- Insert a stacked column chart (see Introduction to charts). The initial data in the chart isn't important, because your automation will replace the data in the template with Excel or JSON data. If you adjust the chart's position, formatting, and annotations, these adjustments will appear in your final presentation.
- Select the chart to open its mini toolbar. In AddRangeData Name, enter
Chart1. Select Enter.
- Click inside the slide title placeholder so that you see the blinking text cursor.
- On the Insert tab, select Elements > Automation Text Field
- Select the automation text field, represented by two angle brackets (<>), to open the mini toolbar. In AddRangeData Name, enter
SlideTitle. Select Enter.
- Save the presentation as
template.pptx.
Next, create programmatic logic to fill your template with data.
- For the Excel automation API
UpdateBatch, see UpdateBatch. - For JSON data automation, see Automation with JSON data.
To learn about creating automated dashboards specifically for financial planning and analysis, read this blog article.
Need to troubleshoot?
Check our knowledge base