Chart areas and plot areas
- Home
- Resources
- User manual
- think-cell Charts: Data visualization
- Chart features
- Chart areas and plot areas
Charts are available with think-cell Suite.
Most think-cell charts have a chart area and a plot area.
- The inner plot area is where your chart data is plotted. The plot area contains the data markers, such as columns, lines, and data points.
- The outer chart area contains everything in the chart, including the plot area and chart features that extend beyond the plot area, such as series and category labels (see Label types) and CAGR arrows.
To create precise slide layouts, you can align other slide objects with the chart area or plot area, and you can match the sizes of slide objects to either area.
Automatically resize chart areas and plot areas to fit their contents
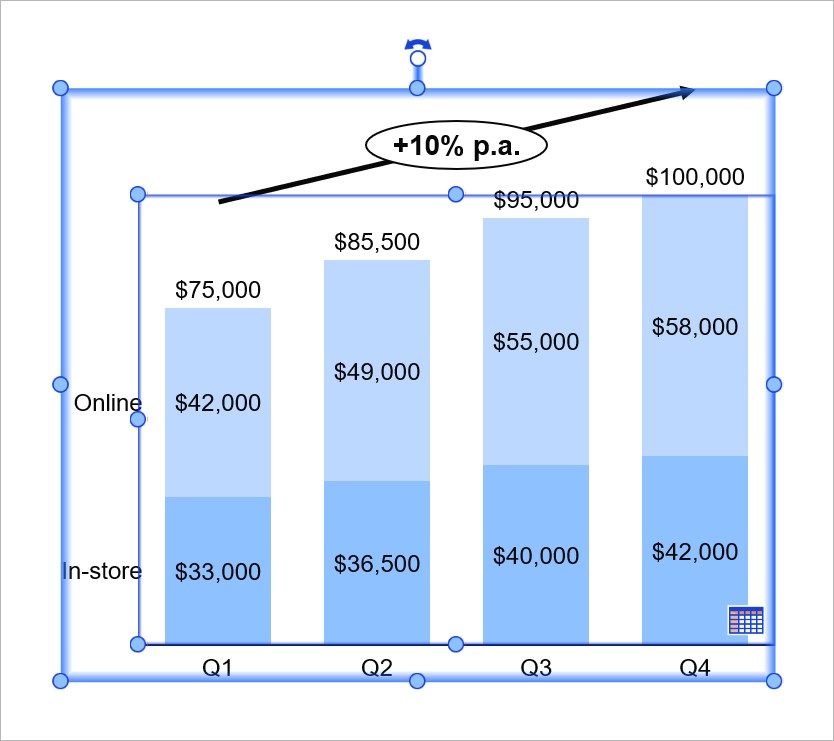
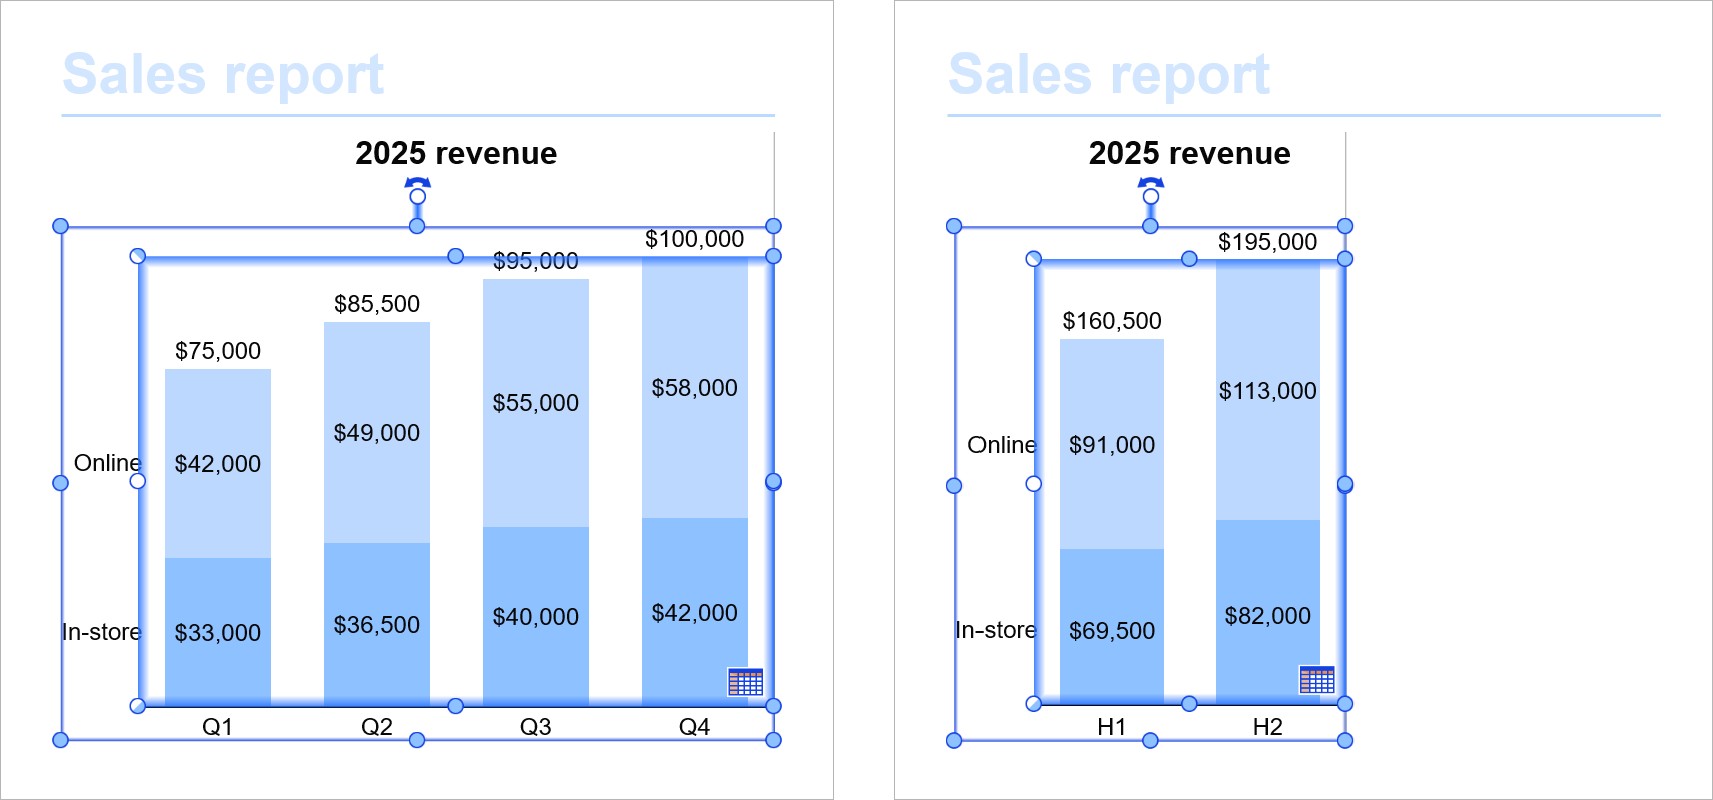
Chart areas and plot areas can automatically resize to fit their contents. For example, the chart area can resize to fit a CAGR arrow ...
... and the plot area can resize to fit the number of columns in a column chart.
You can turn automatic resizing on and off, and chose the direction in which the chart grows or shrinks, by unlocking and locking the edges of the chart area or plot area.
You can't lock the same edge of both the chart area and the plot area. For example, if you lock the top edge of the plot area, the top edge of the chart area automatically unlocks. This ensures that all of the chart's contents stay inside the chart and plot areas so that you can create precise slide layouts.
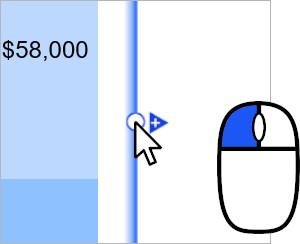
If an edge of an area is unlocked, the edge will automatically move to fit the area's contents. An unlocked edge has a blue resize handle 
If an edge of an area is locked, the edge won't move, even when you edit the area's contents. A locked edge has a white resize handle 
To learn more, see Lock and unlock elements.
Automatic resizing examples
Here are a few examples of how you can control automatic resizing of chart and plot areas.
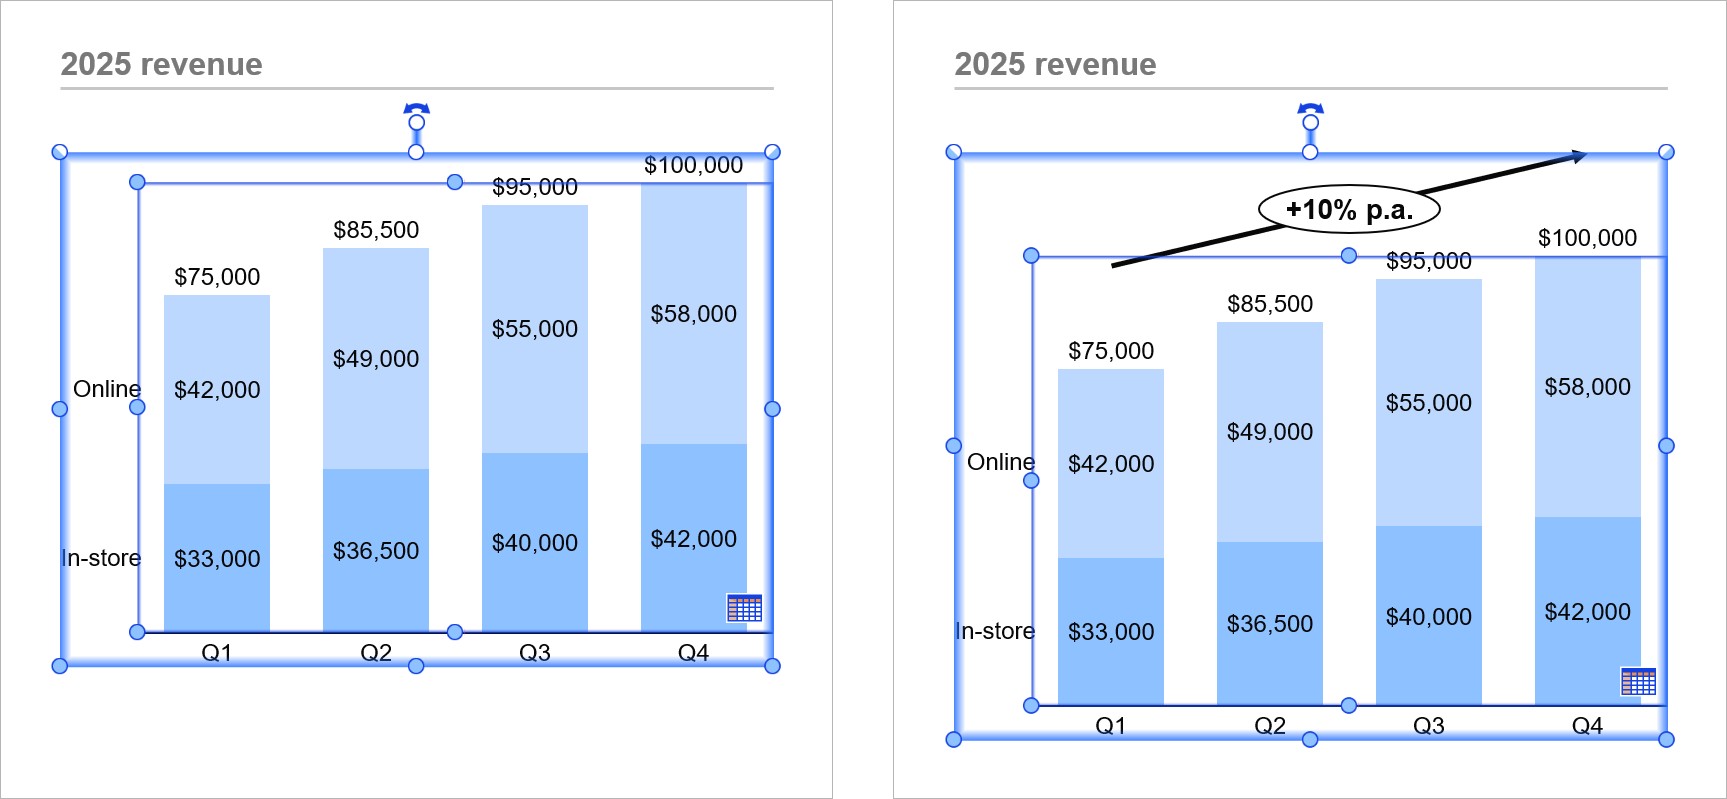
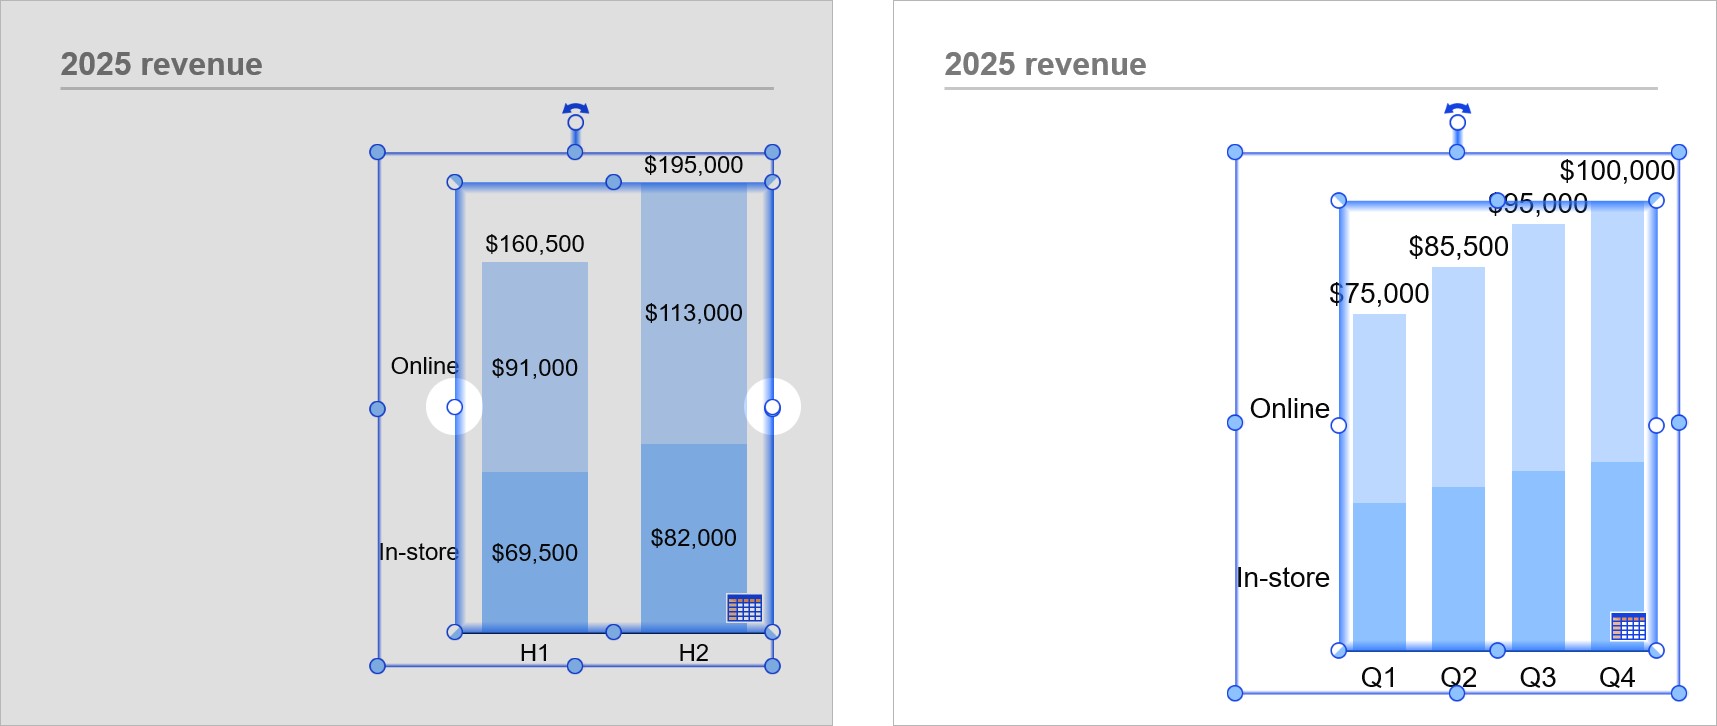
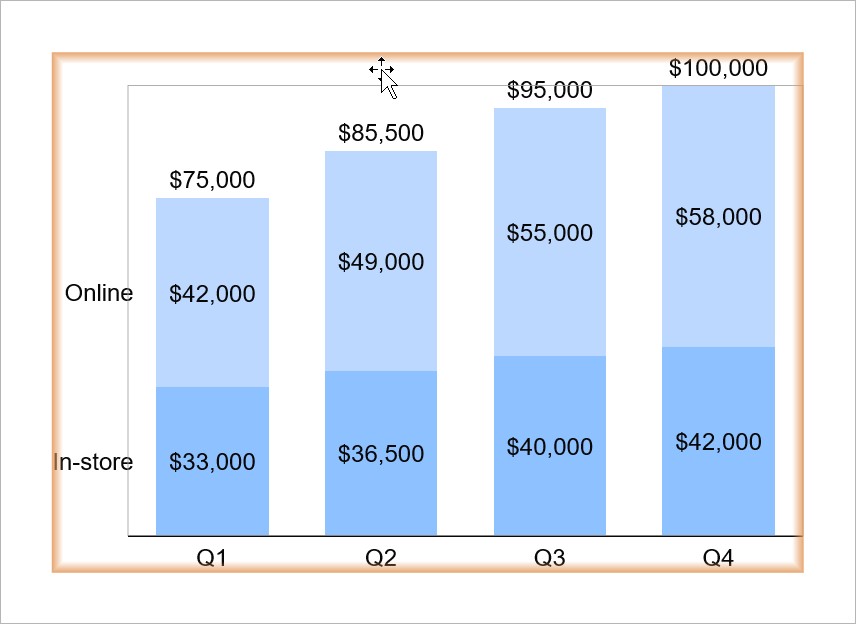
To automatically fit the height of the chart area to its contents so that the top edge stays locked and the bottom grows or shrinks, lock the top edge and unlock the bottom edge.
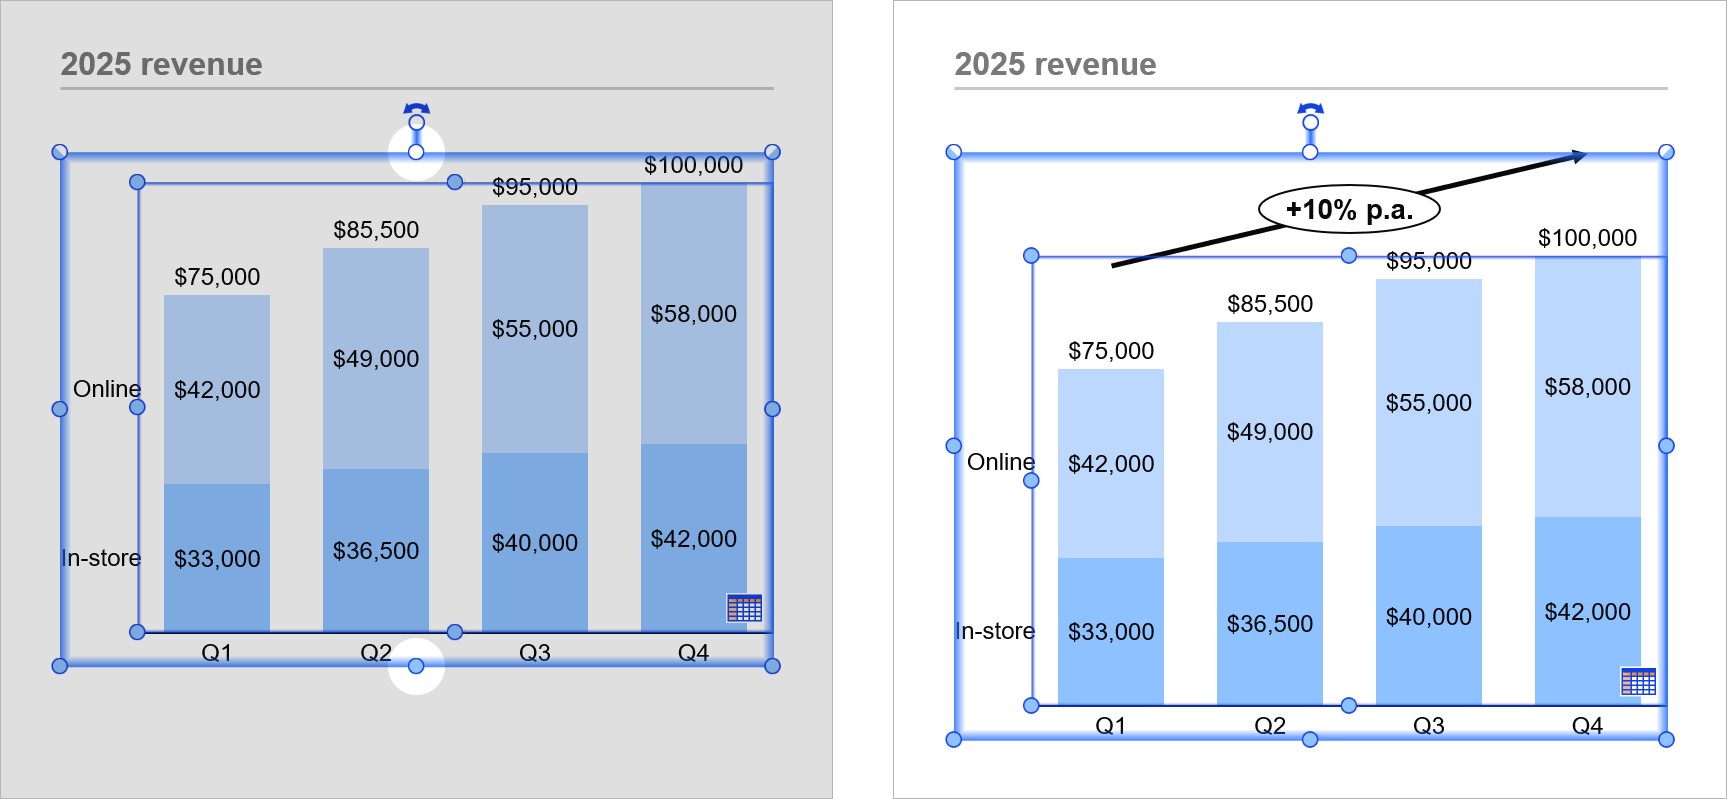
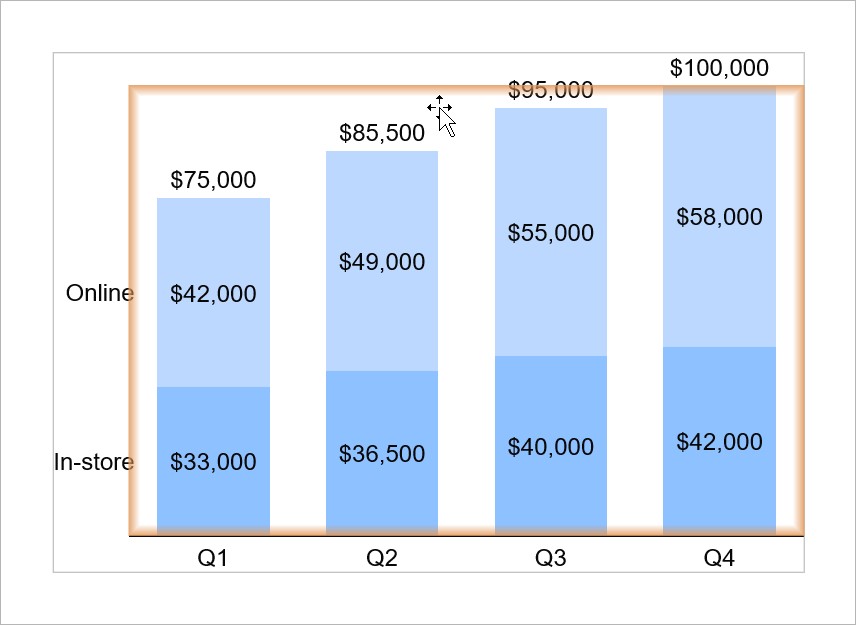
If you want the bottom edge to stay locked while the top grows or shrinks, lock the bottom edge and unlock the top edge.
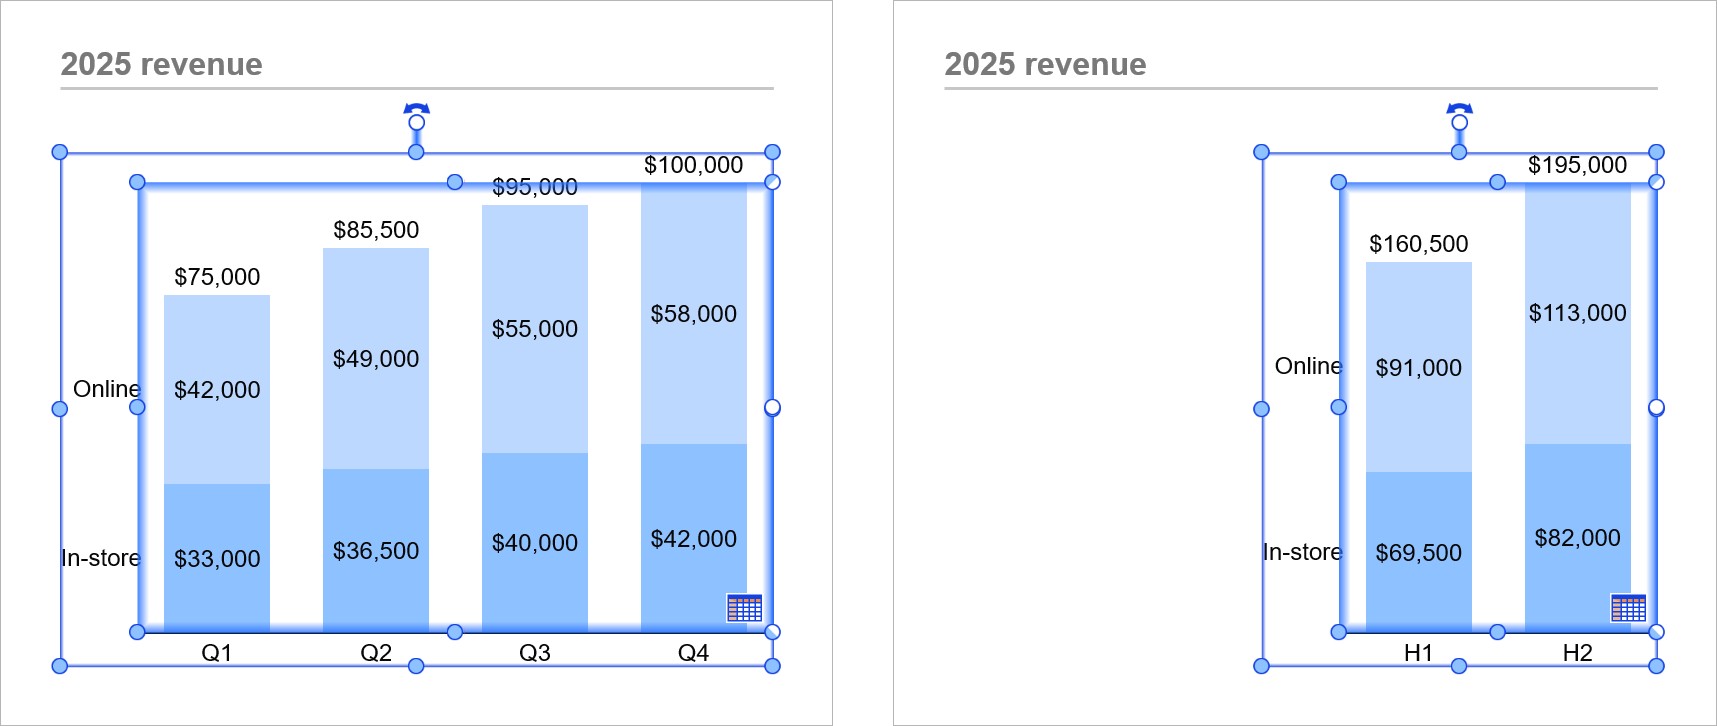
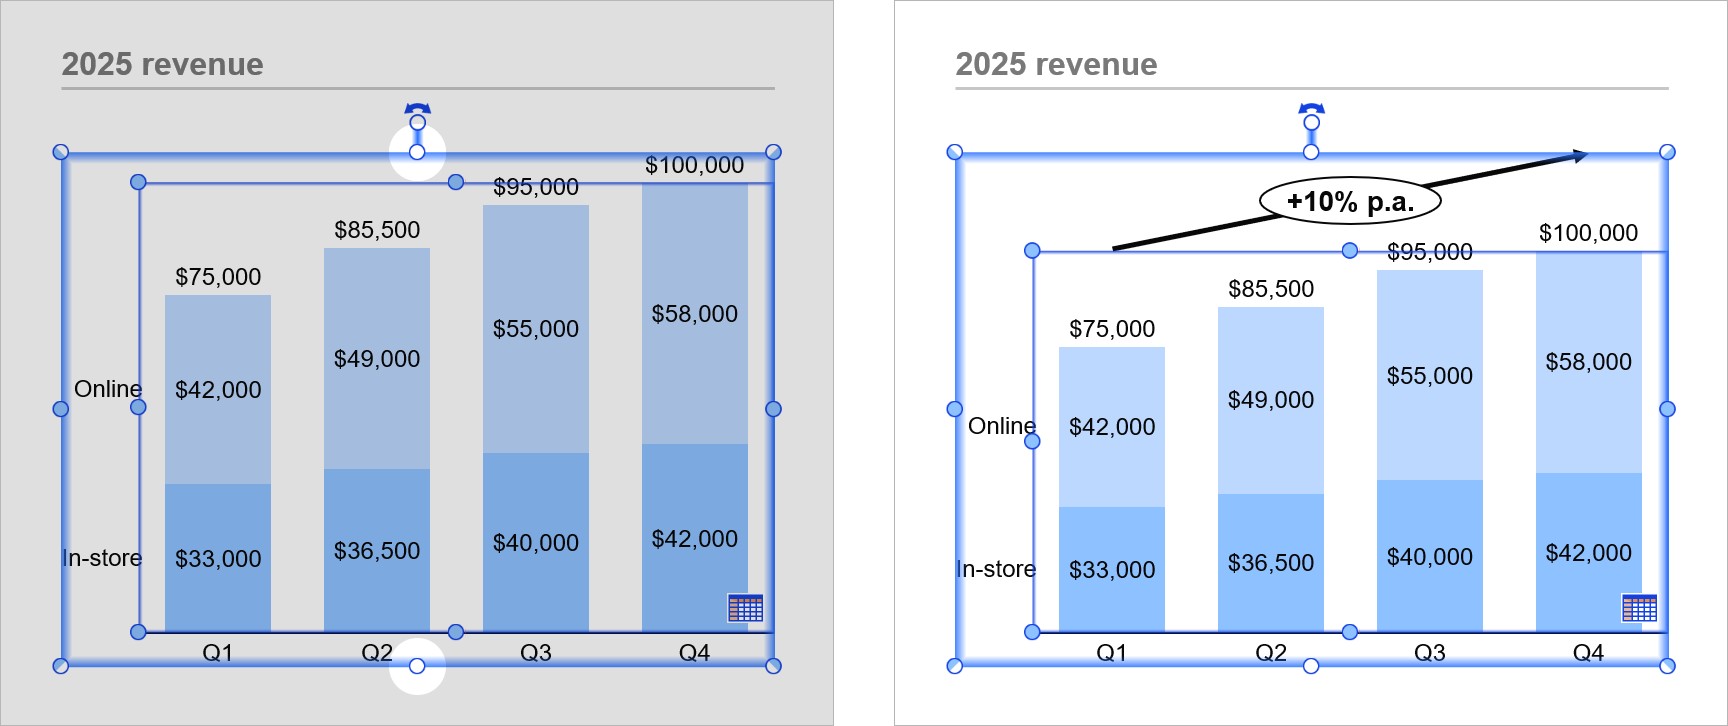
If you lock the top and bottom edges of the chart area, then add more content to the chart area, the plot area will shrink to accommodate the new content.
To automatically fit the width of the plot area to its contents so that the right edge stays locked and the left side grows or shrinks, lock the right edge and unlock the left edge.
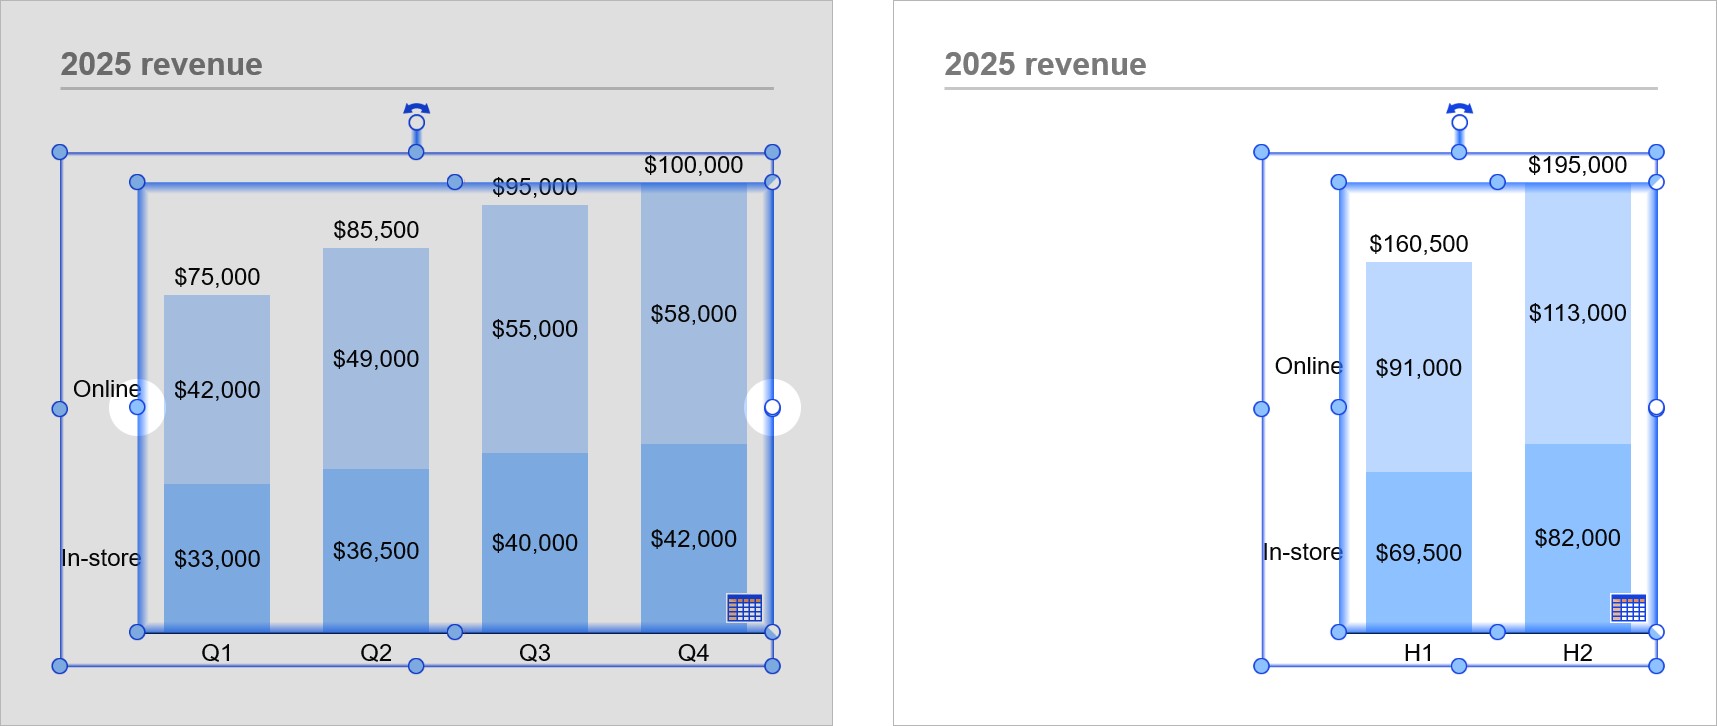
If you want the left edge to stay locked while the right side grows or shrinks, lock the left edge and unlock the right edge.
If you lock the left and right edges of the plot area, then change the number of columns, the columns adapt their width to fit the plot area.
Match the size of the chart area or plot area to other objects
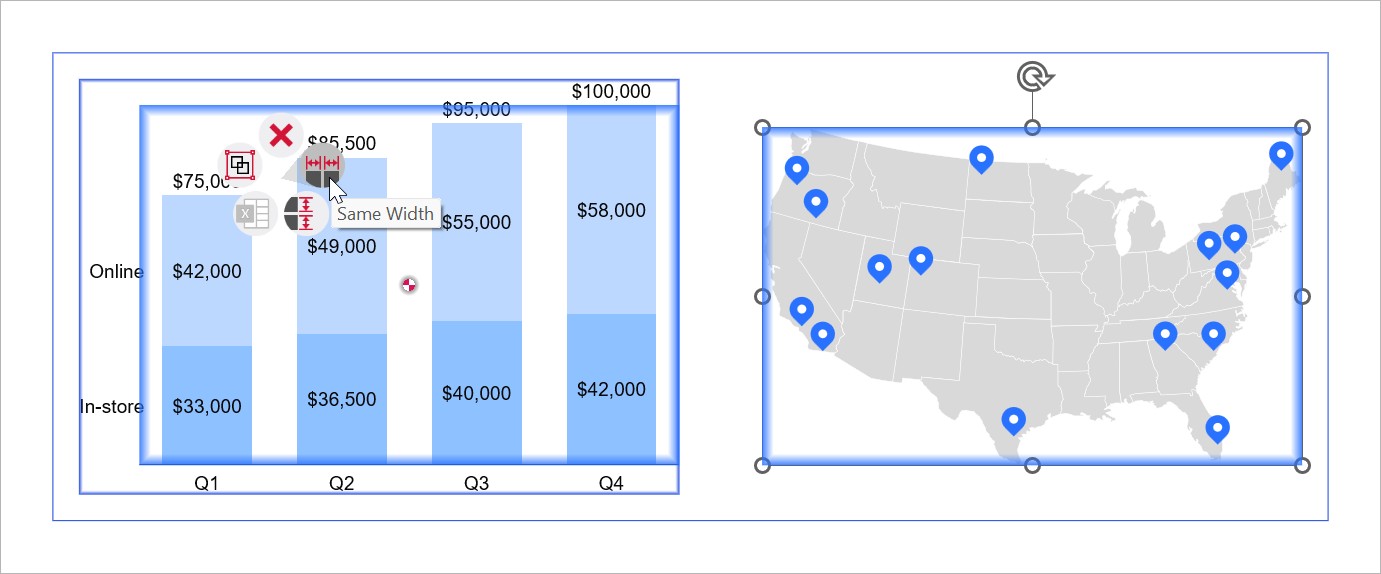
You can match the size of the chart area or plot area to the size of other objects. For example, you can match the width of a think-cell image to the width of the plot area. To learn more, see Match object sizes.
- In the chart, select the area whose size you want to match.
- To select the chart area, hover over the chart so that you see an orange highlight around the chart area, then click.
- To select the plot area, hover over the chart so that you see an orange highlight around the plot area, then click.
- To select the chart area, hover over the chart so that you see an orange highlight around the chart area, then click.
- Add one or more objects to your selection (see Select objects).
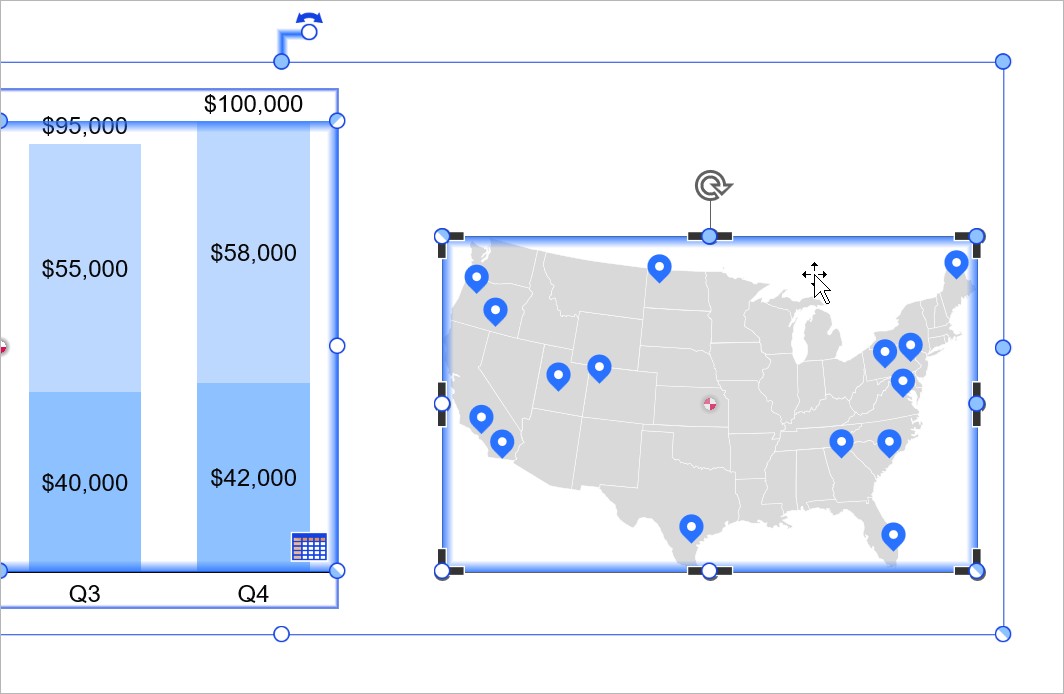
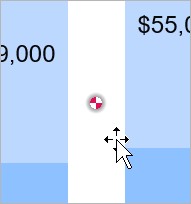
- The width, height, or size of all selected objects will match the width, height, or size of the reference object (see Select a reference object). The reference object has a red and white marker at its center. To select a different reference object, hover over the object that you want until you see the marker at its center, then click.
- Do one of the following:
- On the Shape Format tab, in the think-cell group, select Same Width
 , Same Height
  , or Same Size
  .
. - Right-click your selection to open the context menu, then select Same Width


- On the Shape Format tab, in the think-cell group, select Same Width
Align the chart area or plot area with other objects
Learn how to align the chart area or plot area with other objects on your slide.
- Align the chart area or plot area with other objects using PowerPoint commands: Arrange objects using PowerPoint's Align tools. You can select a reference object that other slide objects align to.
- Dynamically align the chart area or plot area with other elements: Dynamically aligned elements automatically move or resize to preserve their alignment.
To learn more, see Align objects.
Align the chart area or plot area with other objects using PowerPoint commands
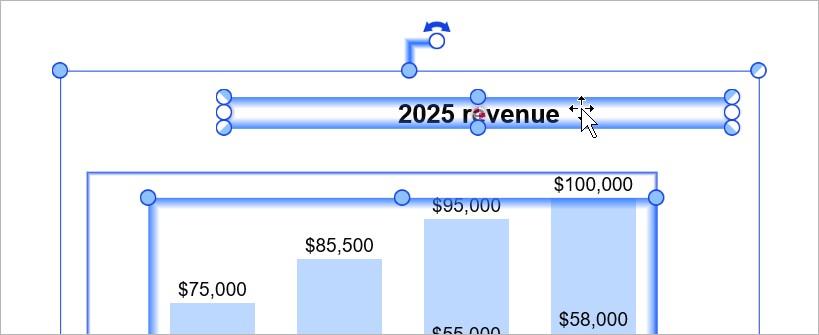
You can align the chart area or plot area with other slide objects using PowerPoint's Align tools. For example, you can center a chart title above the plot area.
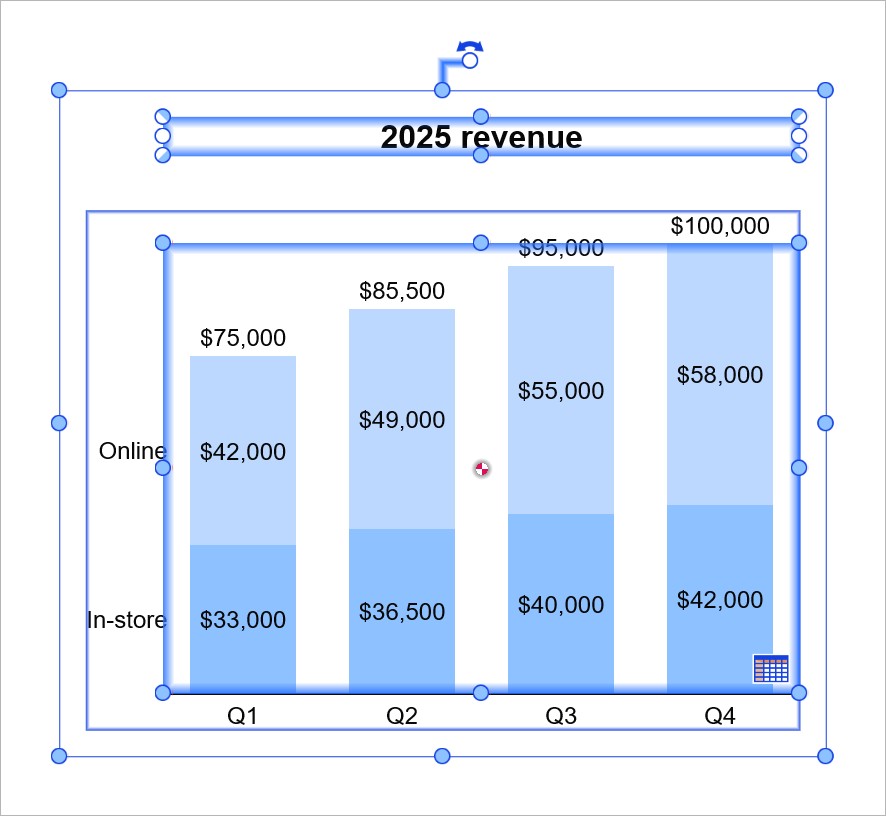
- In the chart, select the area that you want to align.
- To select the chart area, hover over the chart so that you see an orange highlight around the chart area, then click.
- To select the plot area, hover over the chart so that you see an orange highlight around the plot area, then click.
- To select the chart area, hover over the chart so that you see an orange highlight around the chart area, then click.
- Add one or more objects to your selection (see Select objects).
- The selected objects will align to the reference object (see Select a reference object). The reference object has a red and white marker at its center. To select a different reference object, hover over the object that you want until you see the marker at its center, then click.
- On the Shape Format tab, go to the Arrange group and open the Align menu. Then select one of the following:
- Align Left

- Align Center

- Align Right

- Align Top

- Align Middle

- Align Bottom

- Align Left
Dynamically align the chart area or plot area with other elements
You can create dynamic alignments between the chart area or plot area and other elements. When the chart area or plot area resizes to fit to its contents, the other elements move or resize to preserve the alignment.
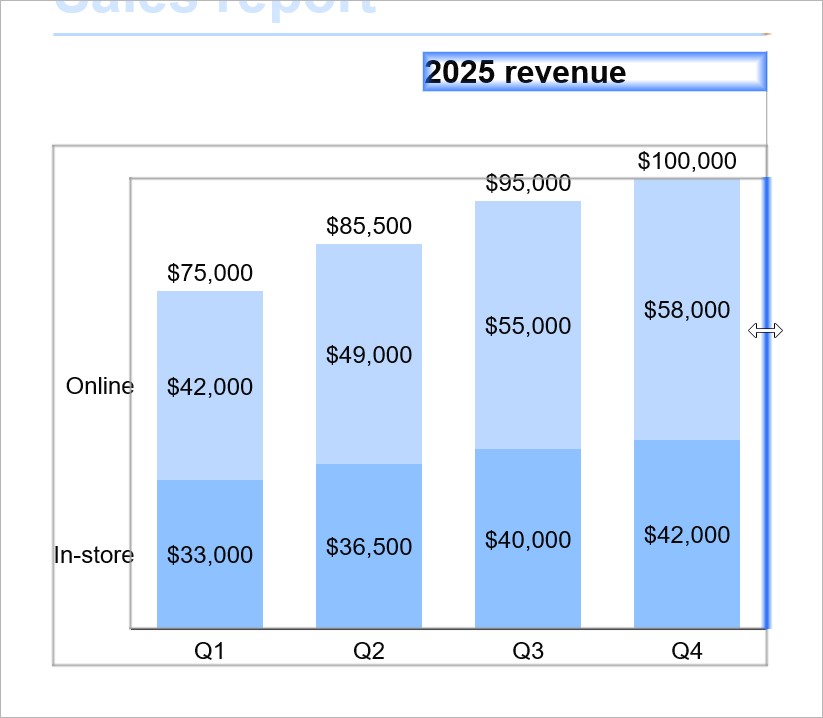
For example, you can align the plot area and a text box so that the text box always matches the width of the plot area, even when the plot area's contents change.
Once you move one of the elements or certain edges, the dynamic alignment breaks (see Break dynamic alignments).
To create a dynamic alignment between the chart area or plot area and another element, follow these steps:
- Before you dynamically align the edges that you want—in this example, the right edges of the text box and plot area—you may want to lock some of the elements' other edges so that they don't move when you edit the chart. A locked edge has a white resize handle
In this example, the left edge of the plot area is locked.
- Select one of the elements that you want to include in your dynamic alignment. For example, select the text box.
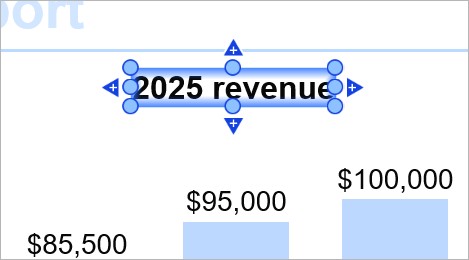
- Start dragging the resize handle of the edge that you want to align—for example, the handle of the right edge.
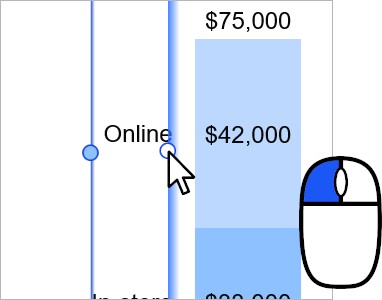
- While dragging the resize handle, move the mouse pointer onto the edge of the other element that you want to align to—in this example, the right edge of the plot area. The edge that you're aligning to is highlighted in blue, and a thin line appears between the edges. Release the mouse button.
In this example, the right edges of the chart area and plot area are in the same position. To make sure that you're aligning to the plot area, drag the resize handle so that you see a blue highlight along the right edge of the plot area only. If the highlight appears along the entire edge of the chart area, you will align the text box to the chart area.
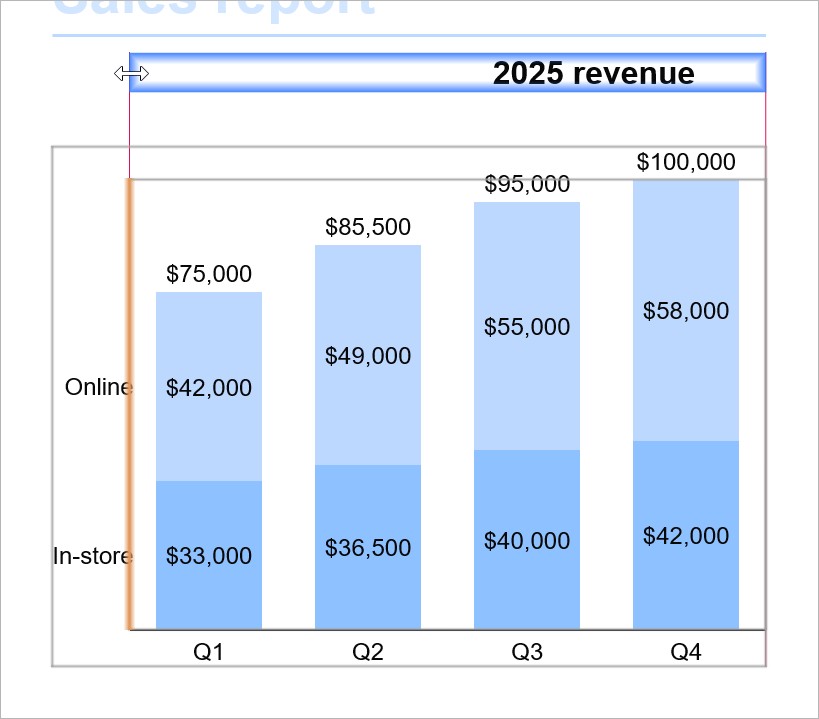
- In this example, to match the text box width to the plot area, align the left edge of the text box to the left edge of the plot area (see Align objects using think-cell guides).
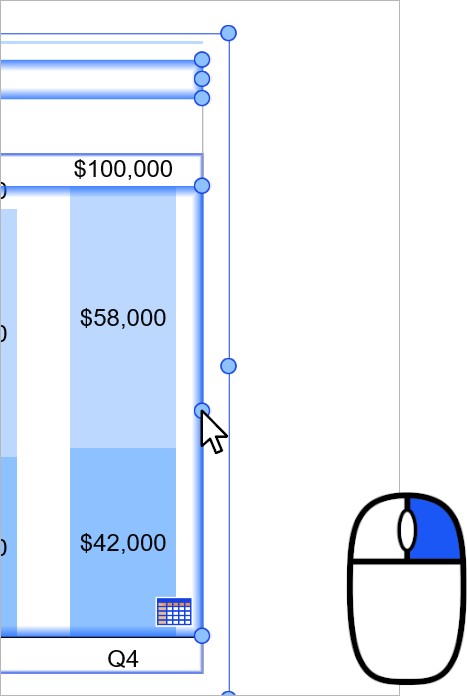
- Make sure that the edges that you want to dynamically align—for example, the right edges of the text box and plot area—are unlocked. An unlocked edge has a blue resize handle
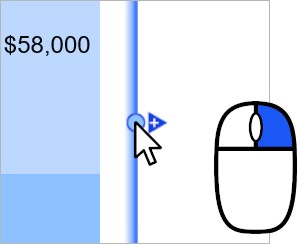
In this example, the resize handles of the right edges of the chart area and plot area are in the same position. To make sure that you're unlocking the right edge of the plot area, first select the plot area, then right-click the resize handle.
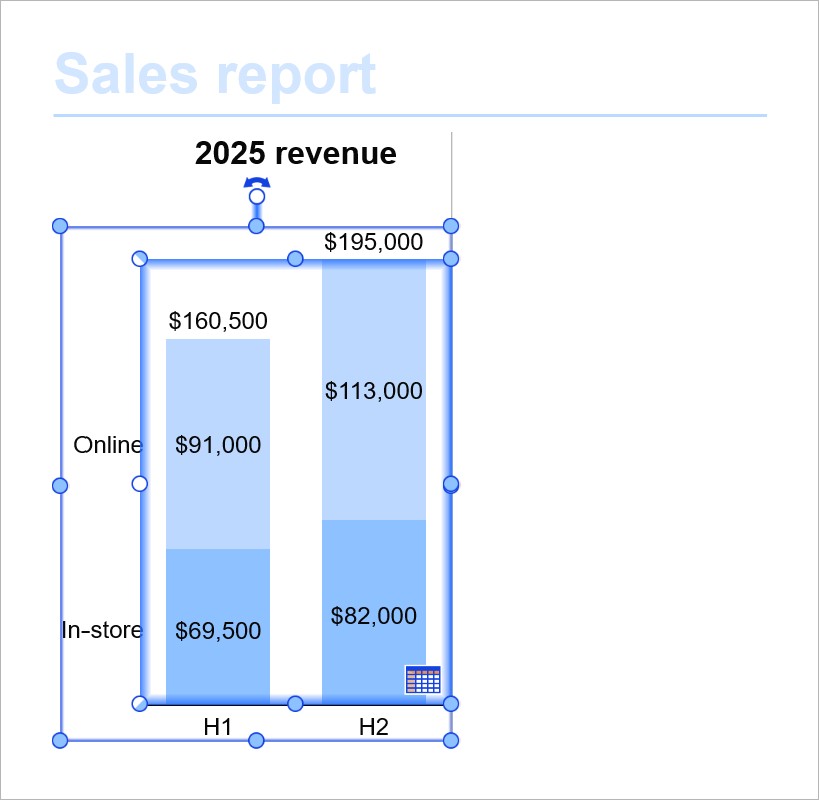
When you edit the chart, the dynamic alignment will persist. In this example, the text box resizes so that it always matches the width of the plot area.
Break dynamic alignments
The following actions will break a dynamic alignment by locking one or more edges:
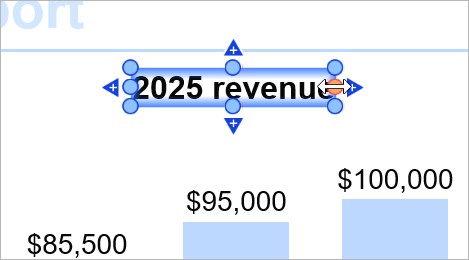
- Move one of the dynamically aligned elements.
- Left-click the resize handle of a dynamically aligned edge.
- Drag the resize handle of a dynamically aligned edge.
- Drag the resize handle of an edge that's opposite a dynamically aligned edge. For example, if the right edge is dynamically aligned, moving the left edge will break the alignment.
Need to troubleshoot?
Check our knowledge base