Charts with data tables
- Home
- Resources
- User manual
- think-cell Charts: Data visualization
- Chart features
- Charts with data tables
Charts are available with think-cell Suite.
Create think-cell charts with data tables that let you choose whether to represent data graphically or in tabular form. Move rows and columns of data between the chart and the data table using the chart's context menu or the element datasheet toolbar.
Caution: think-cell 13 and older versions do not support charts with data tables. If you open a presentation that contains charts with data tables with an older version of think-cell, charts with data tables will load as PowerPoint shapes. If you want to share your presentation with people using older versions of think-cell, we recommend not using charts with data tables.

Enable charts with data tables
To enable charts with data tables, on the PowerPoint ribbon, select Insert > think-cell > Tools 
![]() . You can use the following think-cell chart types with a data table:
. You can use the following think-cell chart types with a data table:
- Column and bar charts
- Line and profile charts
- Combination charts
- Area charts
- Waterfall charts
- Mekko charts
When you insert a chart with a data table, think-cell automatically groups the table and the chart, and adjusts the size and position of the table based on the chart's size and position. You can style a chart's data table just like any other think-cell table (see Format tables). You can also move and resize the table independently from the chart. To do so, ungroup the table and the chart before moving or resizing the table (see Ungroup objects).
Move data between the chart and the table
You can move data between the chart and the chart's data table using the chart's context menu or the toolbar in the chart's datasheet.
Move data using the context menu
To move data from the chart to the table using the context menu, follow these steps:
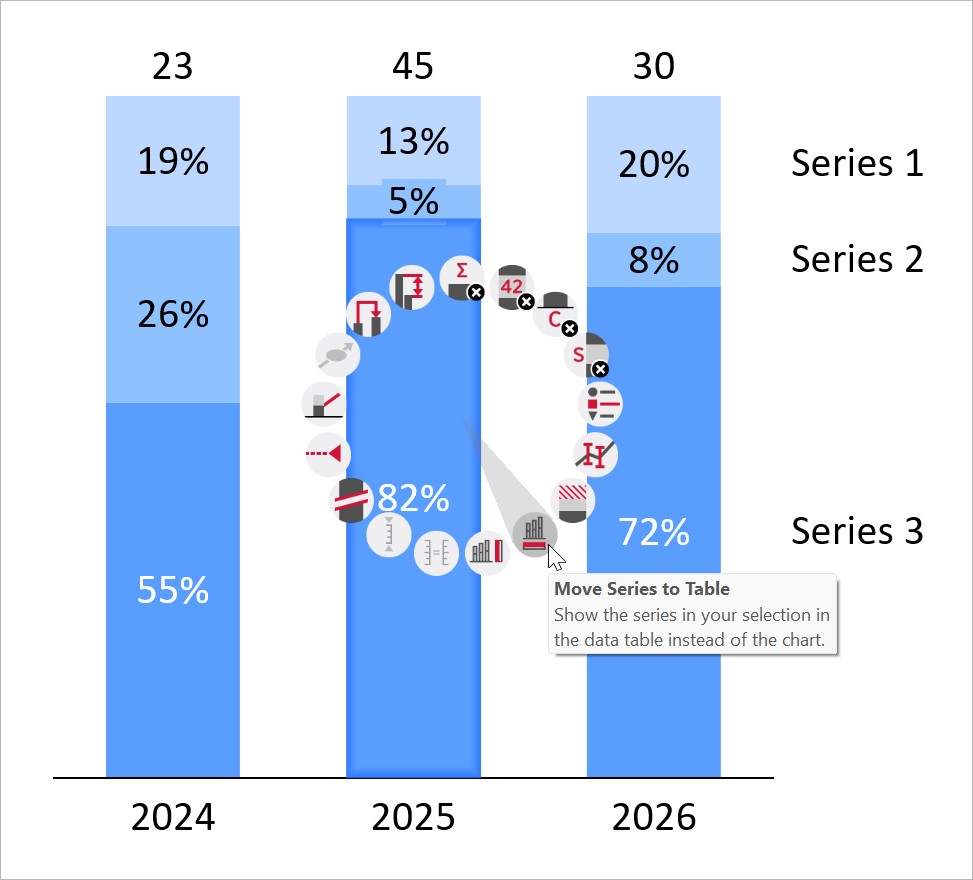
- Right-click the segment, line, area, or label that represents the series or category that you want to move. The context menu opens.
- On the context menu, select where you want to move the data:
- To move a series to a table row, select Move Series to Table

- To move a category to a table column, select Move Categories to Table

- To move a series to a table row, select Move Series to Table
Note: For charts with a vertical X-axis—that is, charts that are rotated 90° to the left or right—the table location for series and categories is reversed. Series move to table columns and categories move to table rows.
To move data from the table to the chart using the context menu, follow these steps:
- Right-click anywhere on the table row or table column that contains the data you want to move. The context menu opens.
- On the context menu, select where you want to move the data:
- To move a series to the chart, select Move Series to Chart

- To move a category to the chart, select Move Categories to Chart

- To move a series to the chart, select Move Series to Chart
Move data using the datasheet toolbar
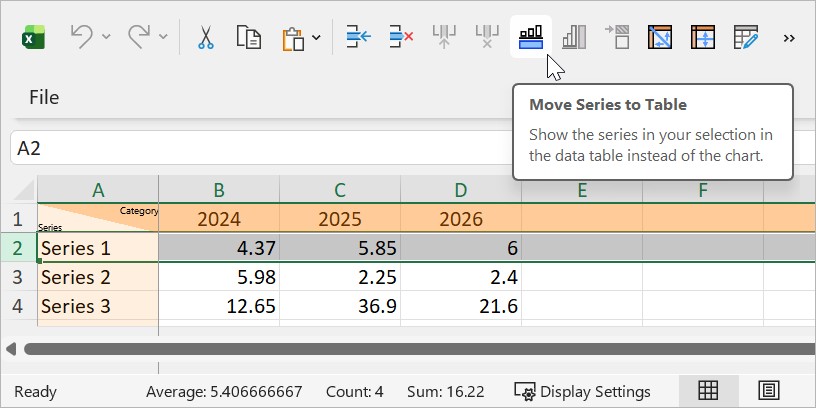
To move data using the chart's datasheet toolbar, follow these steps:
- Open the datasheet by double-clicking the chart. Alternatively, select the chart, then select Open Datasheet
 .
. - On the datasheet, select a cell, a row, or a column, then select where you want to move the data in your selection:
- To move the series in your selection to the table, select Move Series to Table

- To move the categories in your selection to the table, select Move Categories to Table

- To move the series in your selection to the chart, select Move Series to Chart

- To move the categories in your selection to the chart, select Move Categories to Chart

- To move the series in your selection to the table, select Move Series to Table
Need to troubleshoot?
Check our knowledge base