Legends
Charts are available with think-cell Suite.
|
In menu: |
Chart |
|
Menu item: |
|

A legend can identify the various data series or groups in a chart.
A mini toolbar containing a line style and a font control (Format chart labels) appears when the legend is selected, letting you specify a line style for the legend box and the size of the legend text. A control for the visual order of the placeholders can be used to specify a different order than in the datasheet or the chart itself.
In addition, chart-specific property controls for the series and groups are available when selecting one of the placeholders.
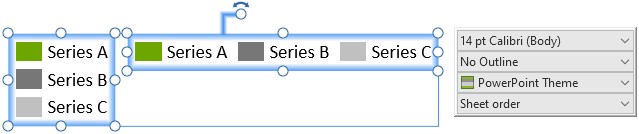
If you change the size of the legend’s frame the legend text will be automatically reformatted to fit the new frame size. To create a horizontal legend, for example, pull the left or right border of the frame outwards.
Need to troubleshoot?
Check our knowledge base