think-cell Charts: Data visualization
- Home
- Resources
- User manual
- think-cell Charts: Data visualization
Create industry-leading charts, tables, and other data visualizations using think-cell Charts. Automated annotations and external data links ensure full data consistency. think-cell Charts is available with think-cell Suite.
Tell your story with charts and tables
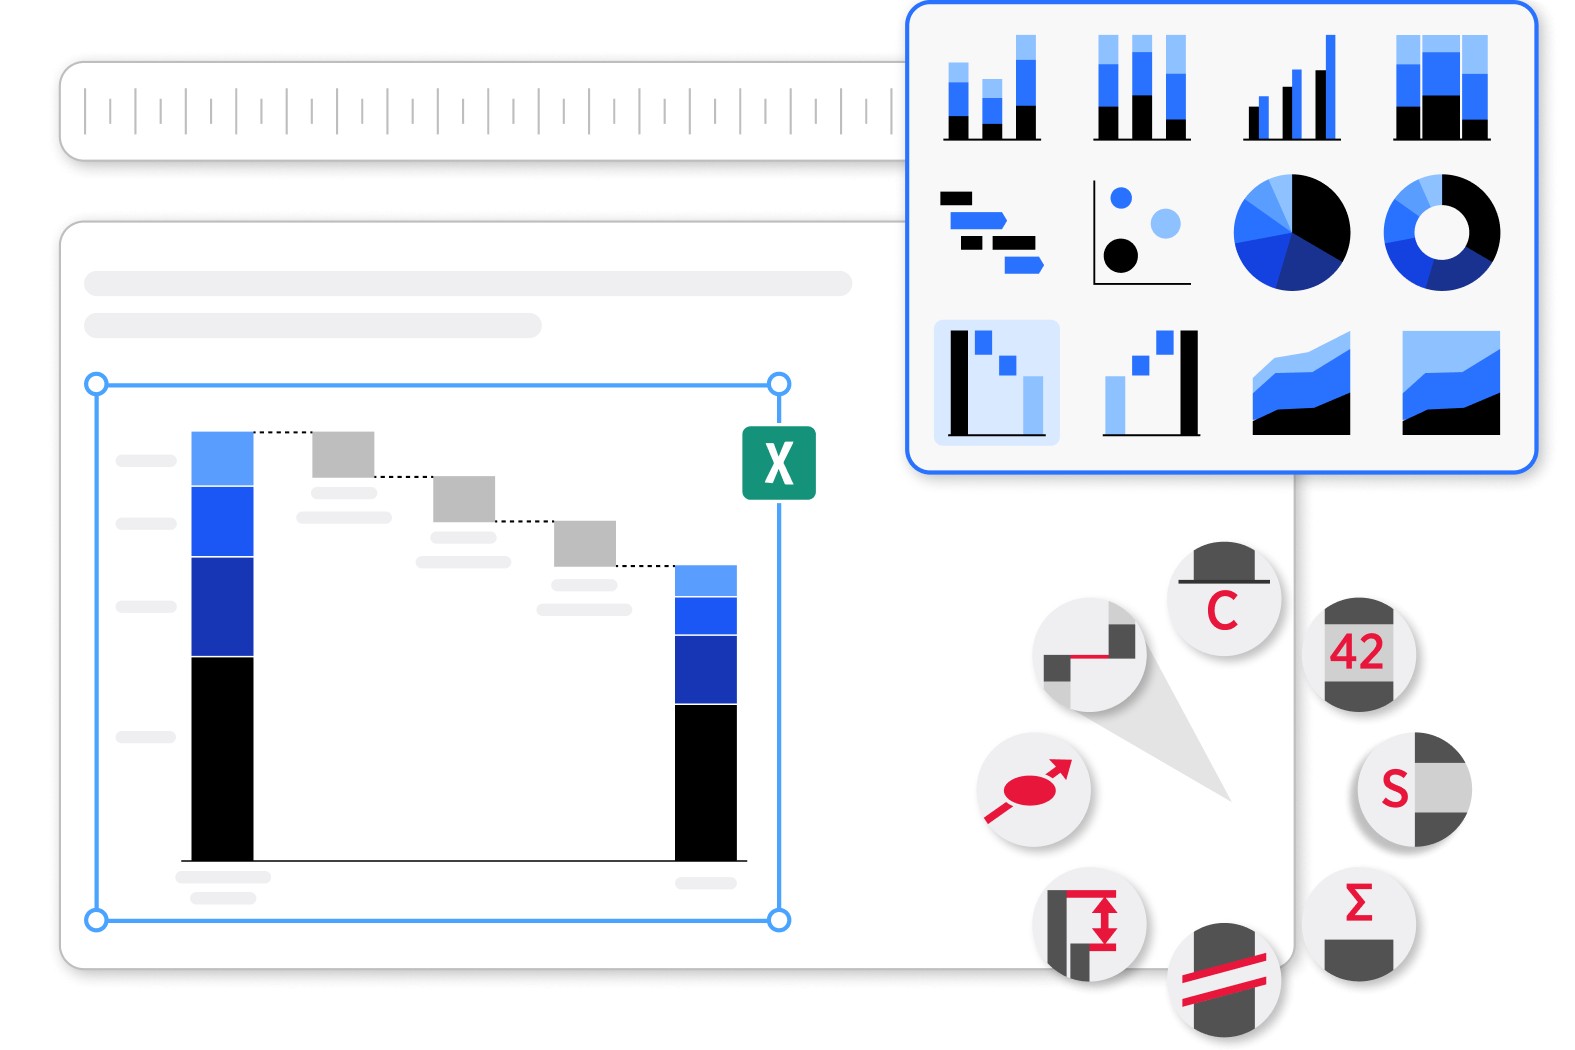
Transform data into business insights with Quantitative charts, Tables with datasheets, and other think-cell elements.
Ensure maximum clarity in project management reporting with Gantt charts (timelines).
Annotations and features like Chart labels, Legends, and CAGR arrows update automatically based on your data.
Use Excel sheets built into PowerPoint
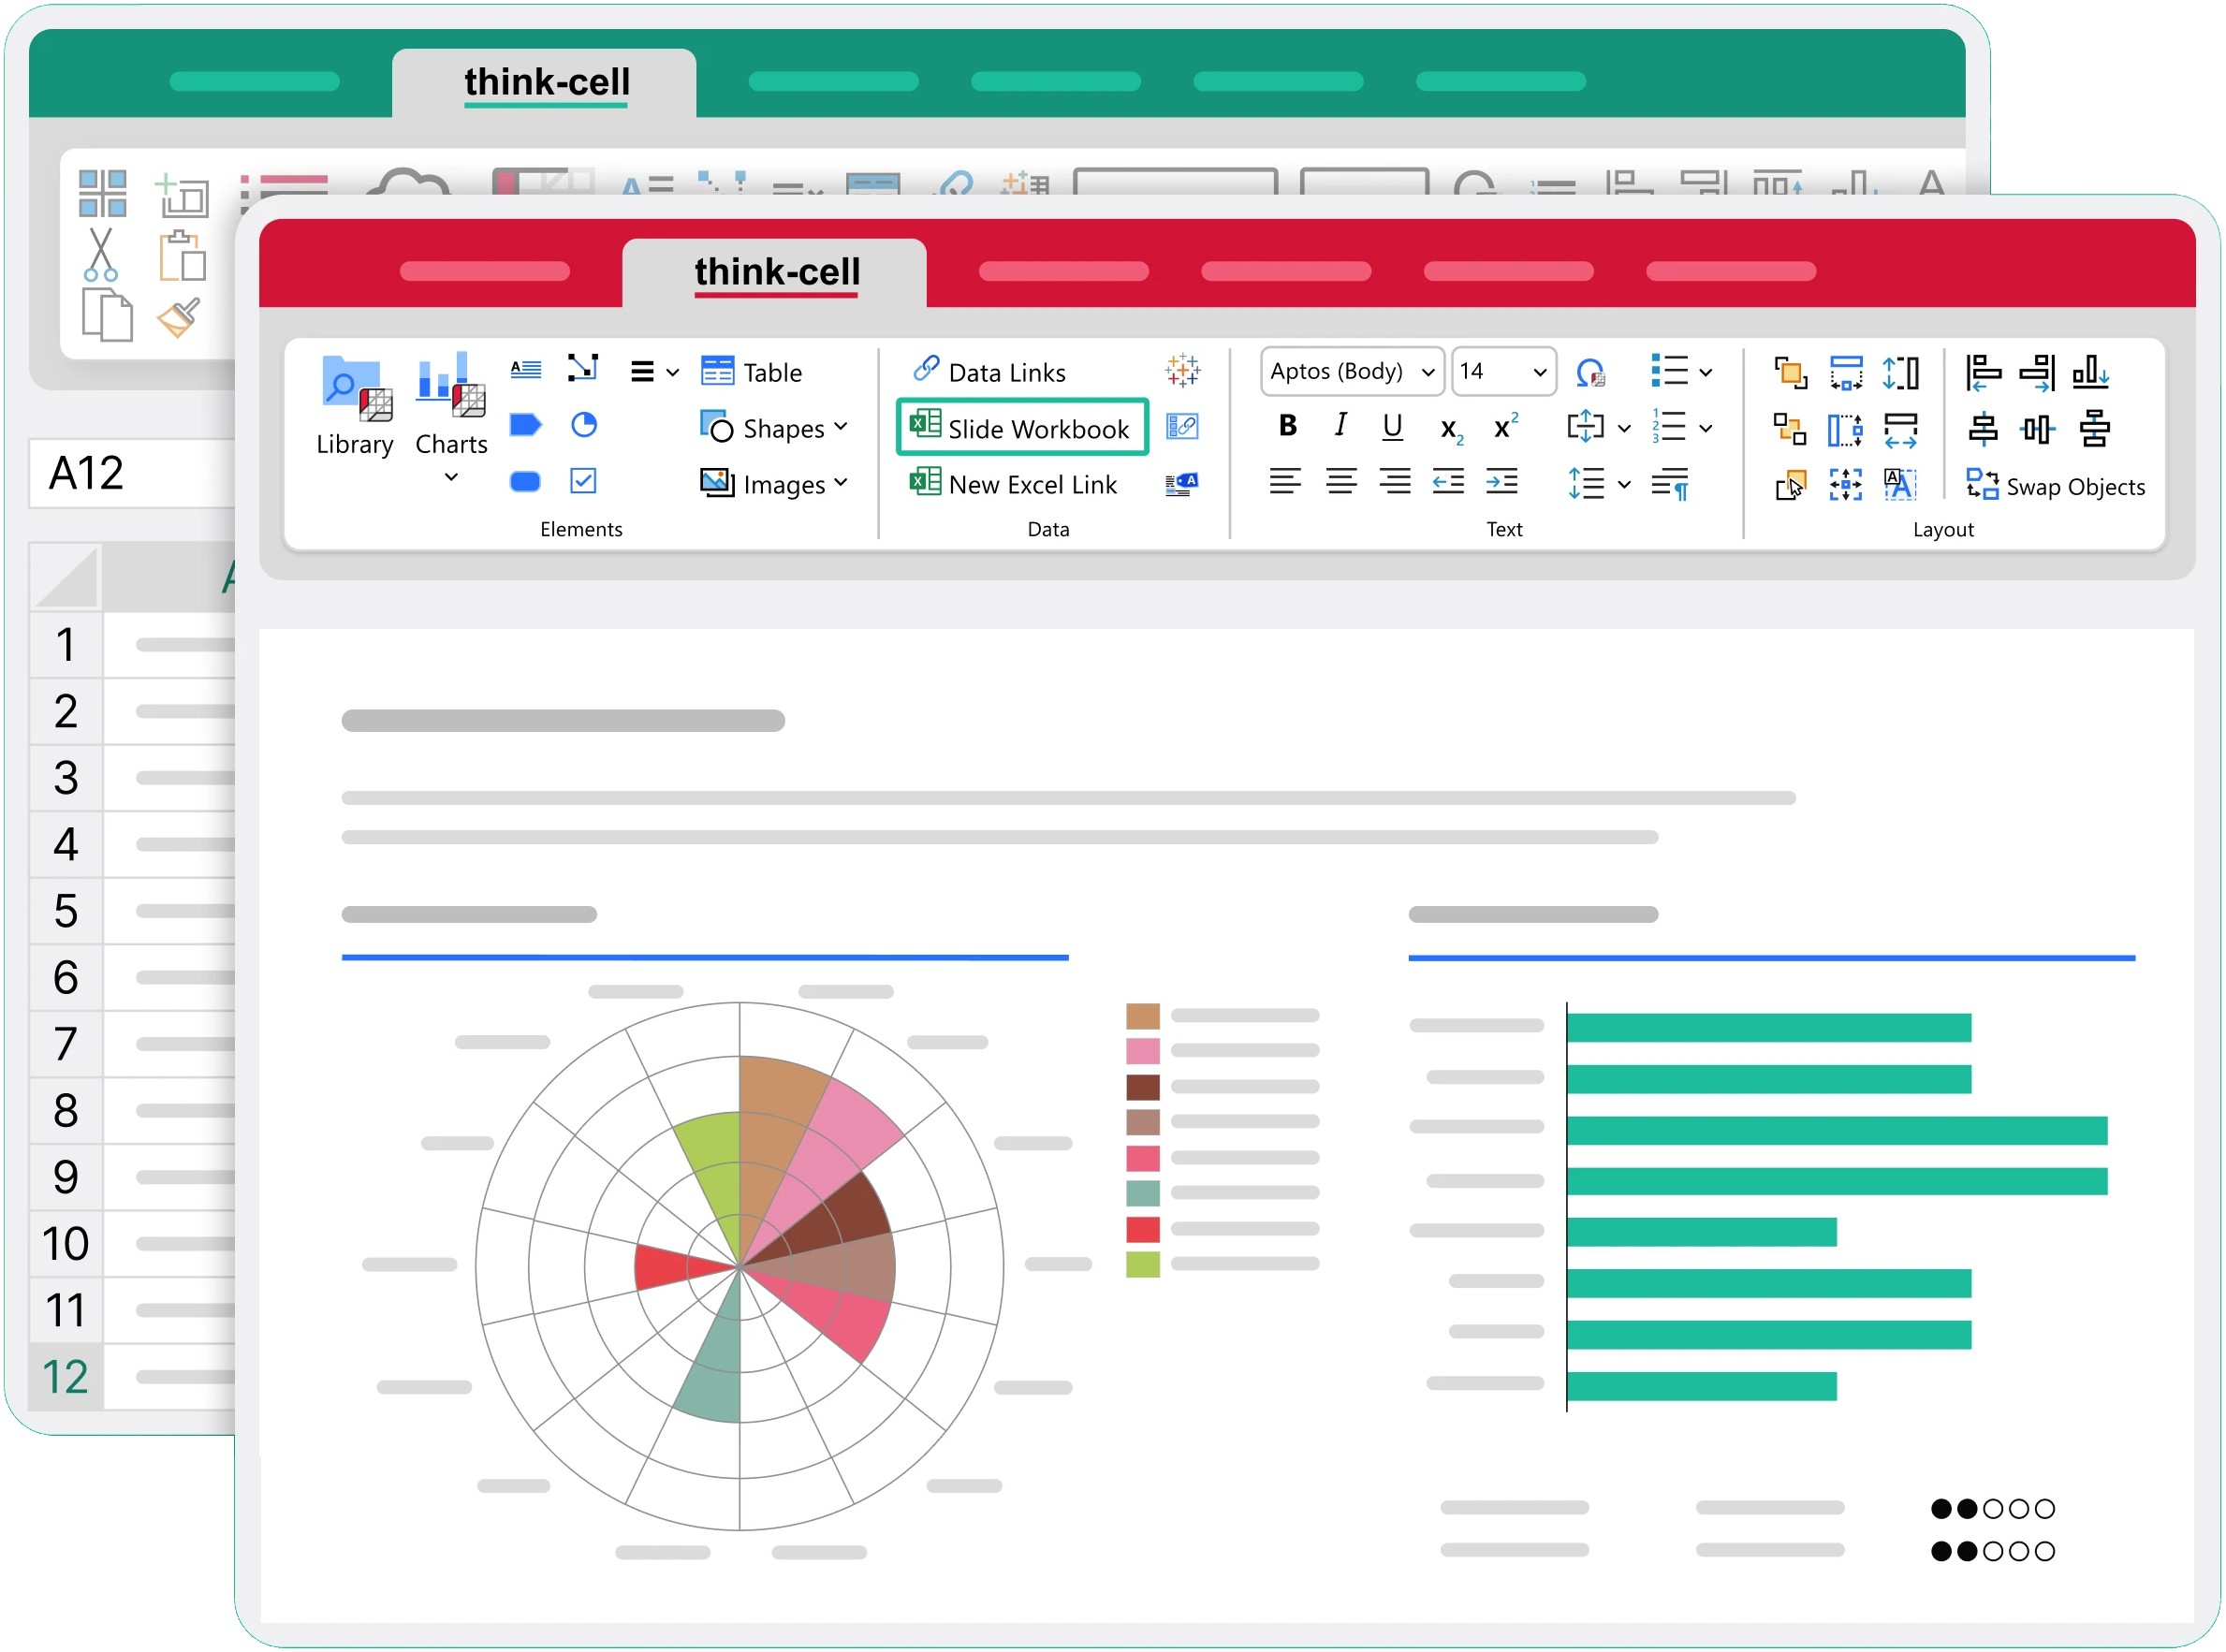
Visualize formula-powered data in PowerPoint without needing a separate Excel file.
Element datasheets are Excel worksheets that contain the data for a single element.
Slide workbooks are fully functioning Excel workbooks that are built into PowerPoint slides. You can manage the data for all charts and other objects on a slide in a slide workbook.
Link slide objects to Excel files
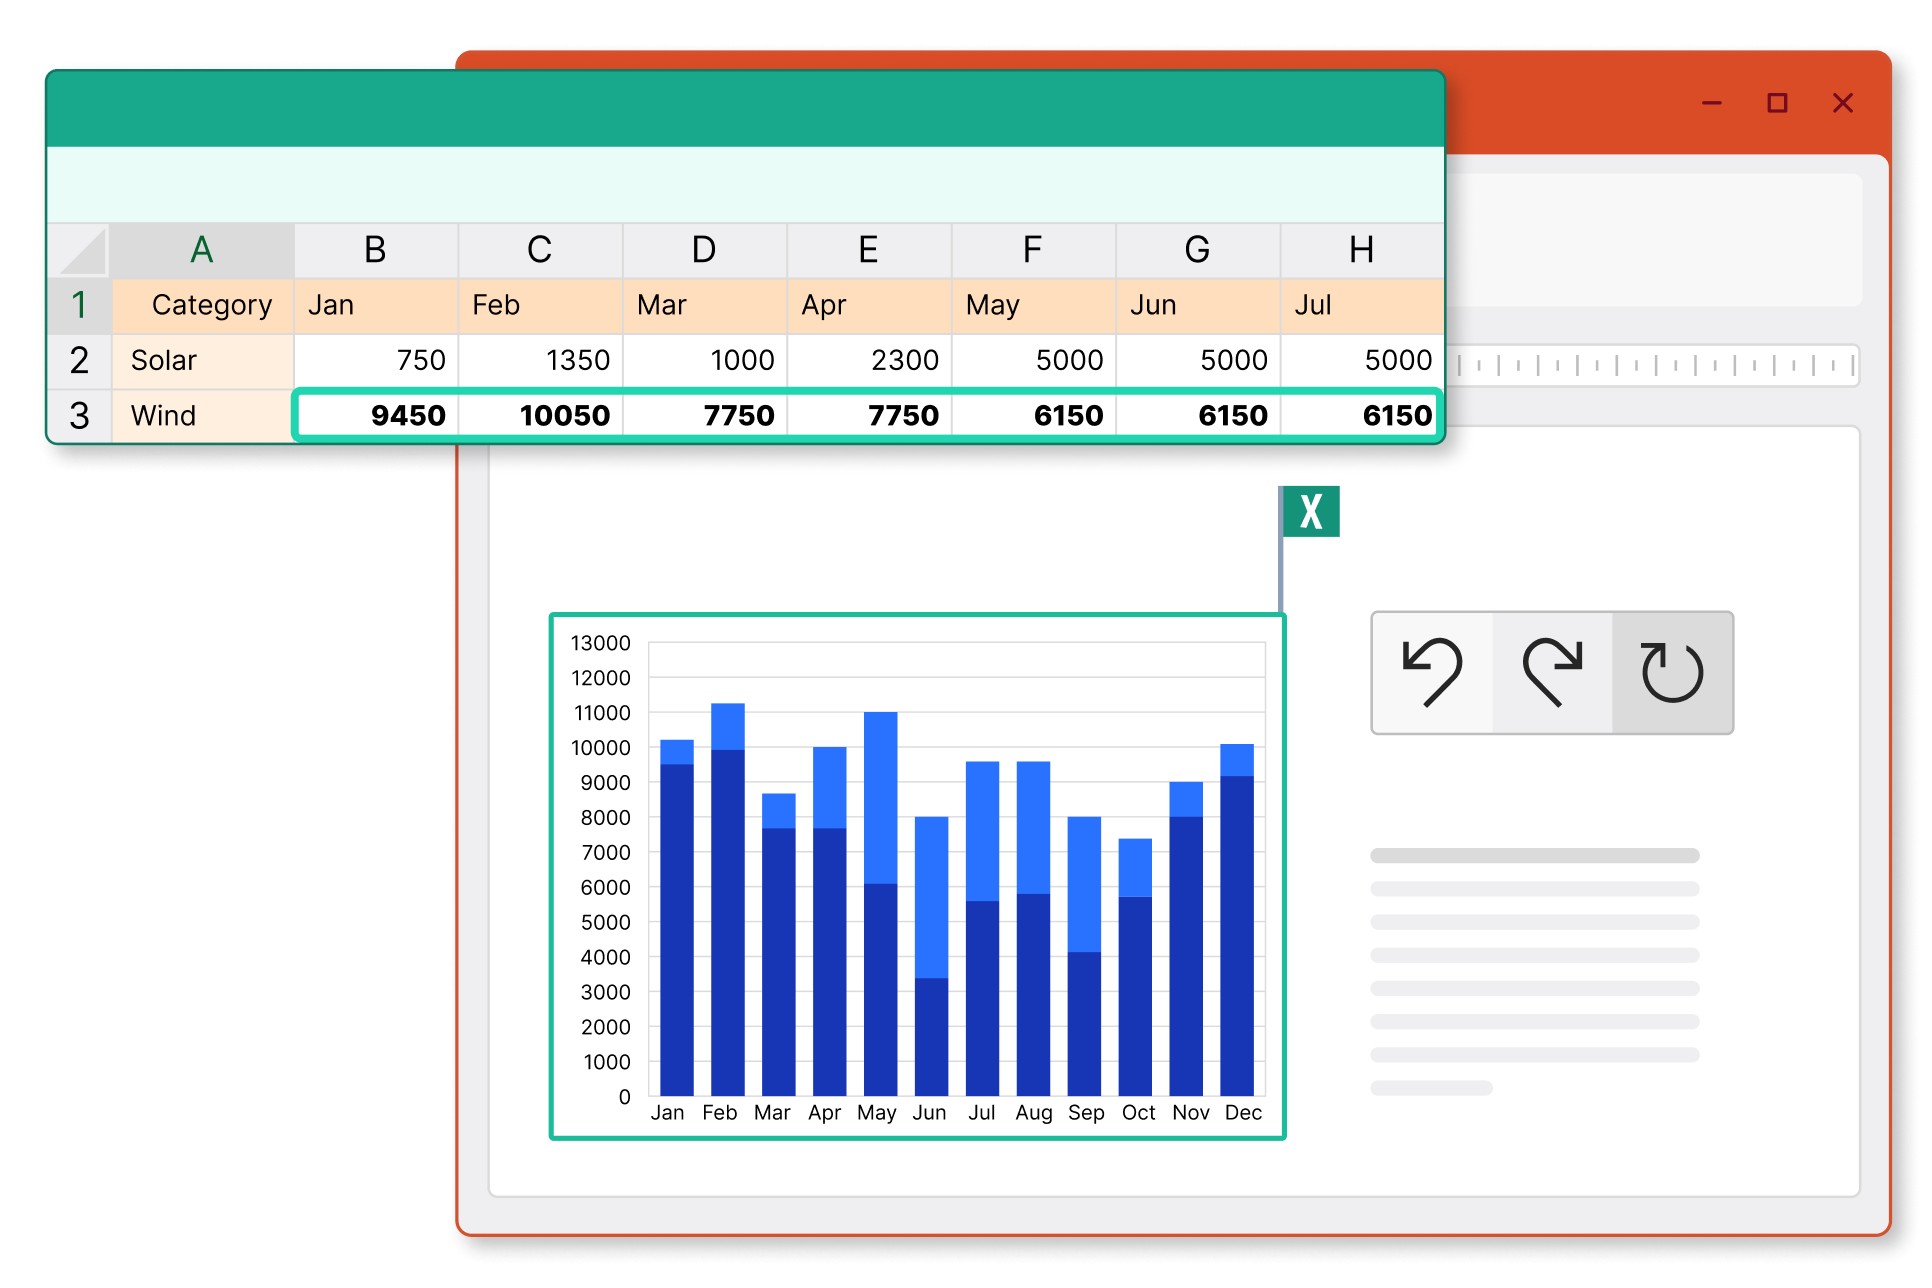
Connect charts and other slide objects to Excel to maintain full data consistency.
Choose whether linked objects update automatically or manually, or revert to previous versions of linked objects.
The Data Links dialog helps you manage large numbers of linked elements.
To learn more, see Create elements from Excel.
More ways to visualize your data

Connect charts and tables to your Tableau data. To learn more, see Create elements from Tableau.

With Advanced report automation, you can use your latest Excel or JSON data to automatically create reports and other presentations that you regularly update.