Process flows
- Home
- Resources
- User manual
- think-cell Core: Presentation basics
- Process flows
With think-cell, you can easily and quickly create a linear process flow which consists of pentagons, chevrons, and text boxes.
For general instructions on formatting and arranging pentagons, chevrons, text boxes, and other think-cell elements, see Shapes and elements.
Create process flows
You start creating a process flow by inserting its first pentagon. Choose 
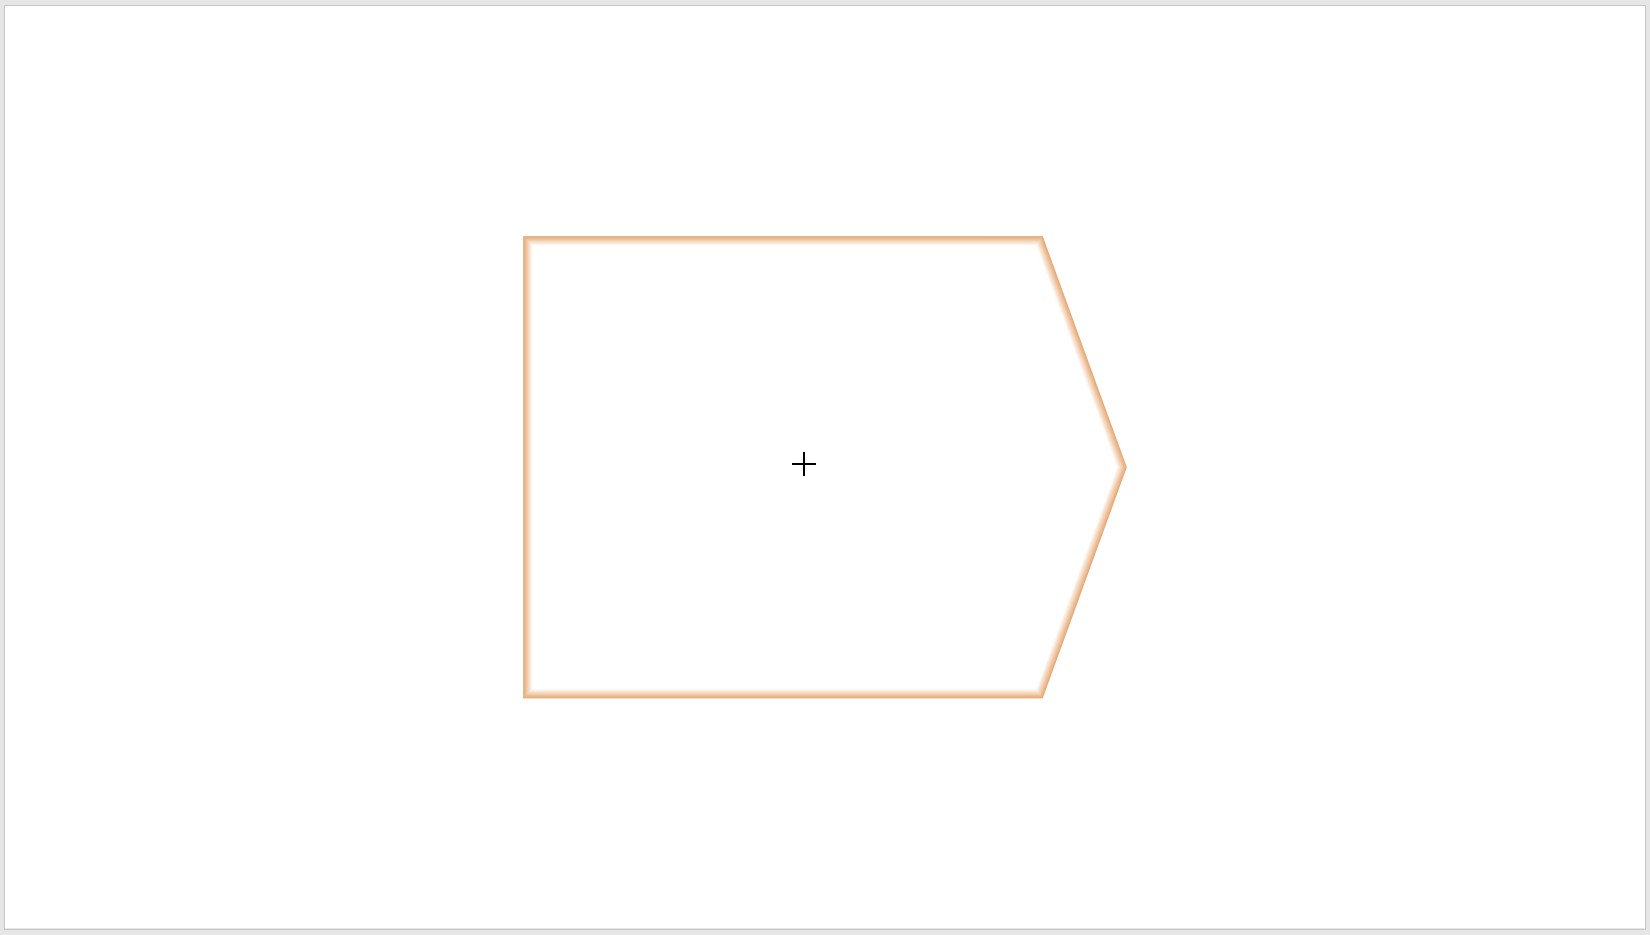
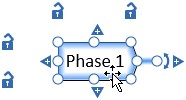
Click when you want to insert the element at the position shown. The element is automatically selected after insertion and text can be entered directly into it. Let’s say this element represents "Phase 1" of your flow, so you simply type that into the pentagon. The size of the pentagon is automatically adapted as you type.
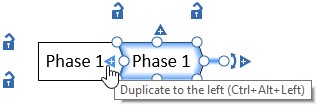
The quickest way to add more chevrons to your flow is to use the 
You can also do this for a multi-selection of elements. When you are done, click into each pentagon or chevron to insert or edit the text. Holding the Alt key down and hitting the arrow keys lets you easily move from one element to another.
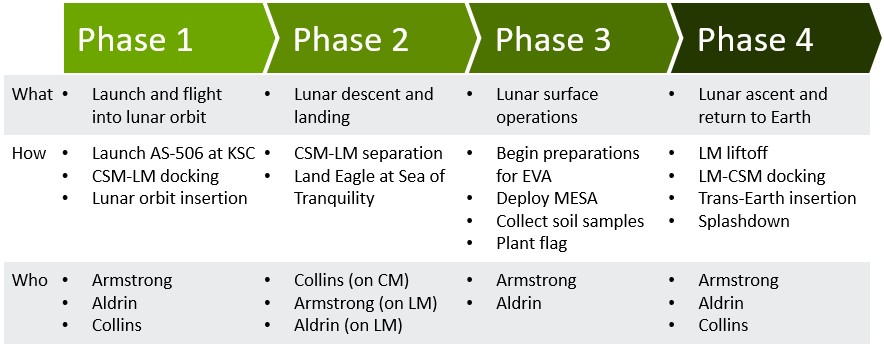
Having set the headings for your flow with the pentagons and chevrons, let’s add a table. Multi-select the row of pentagons and chevrons with your mouse, and click the 

To further describe your flow, let’s add a preceding column of text boxes for the row categories, in this case "what, how, and who". Select the first column of text boxes with your mouse.
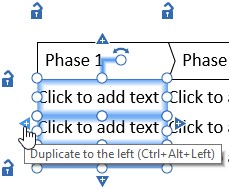
Then, click the 
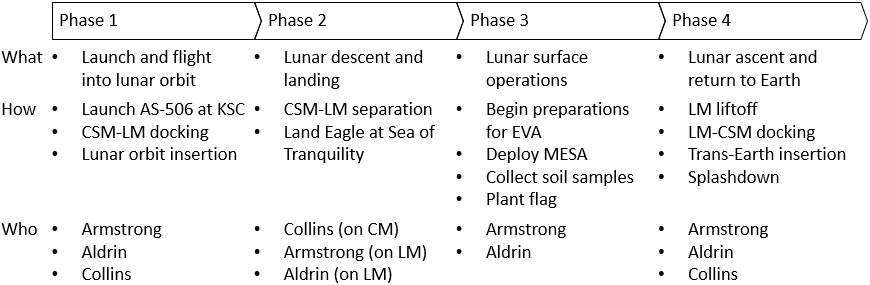
Click into each text box of the first column and type in "What", "How", and "Who". You can fill in the rest of your text box table with content the same way:
Change a process flow structure
Deleting individual text boxes, entire rows, or columns is as easy as inserting them. Just select the text box or multi-select the row or column you want to delete, and hit the Del key. You can also right-click into the selection and click the red 
If you would like to change the sequence within your process flow afterwards, you can drag & drop a column to another position (e.g., move "Phase 3" between "Phase 1" and "Phase 2"):
- Select the respective pentagon and textboxes with your mouse.
- Click onto the blue outline of the selected elements and hold the mouse button down.
- Drag the selection exactly between the other two columns.
- Release the mouse button.
Automatically resize process flows to fit their contents
The rows and columns of a process flow can automatically resize to fit their contents. You can turn automatic resizing on and off, and chose the direction in which a row or column grows or shrinks. To learn more, see Automatically resize table rows and columns to fit their contents.
Dynamically align process flows with other elements
You can create dynamic alignments between process flows and other think-cell elements. When you edit the process flow, the other elements move or resize to preserve the alignment. To learn more, see Dynamically align tables with other elements.
Style process flows
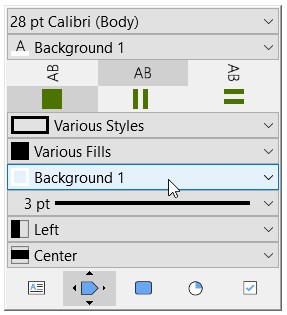
After you have positioned and resized the process flow, you can add the finishing touches to your process flow by styling it. Let’s say you want to give each pentagon and chevron a different color to represent the different phases of the project. Left-click into each pentagon and chevron and select the color you want from the fill color dropdown menu of the mini toolbar (see Fills). You can also change the line color and line style of the pentagons. Multi-select all pentagons, left-click into the selection, open the outline color drop-down menu and change the line color, for example, to Background 1 (see Change the outline color). Left-click into the selection again, open the line style drop-down menu, and change the line style to 3 pt solid for a thick outline (see Change the line style and weight). You can also control the horizontal and vertical text alignment via the mini toolbar.
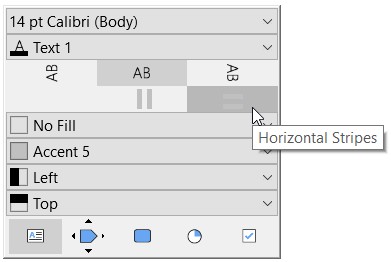
To boost the readability of your flow, you may also assign alternating background colors to rows or columns with the Striping function. Just select the textboxes you would like to fill and left-click into any of them to open the mini toolbar. Open the Striping dropdown menu and click on Vertical Stripes for alternating column shading, or Horizontal Stripes for row shading. Once you have done so, the mini toolbar lets you pick the two colors for the alternating background colors. Just click on the corresponding dropdown menu and select your preferred shade from the list.
Finally, to show the column and row titles in bold, multi-select the respective column or row, left-click into the selection, open the font dropdown menu and select the bold version of your preferred font size (see Font).
For free process flow templates, read this blog article.