Circulaires et en anneau
- Page d'accueil
- Ressources
- Manuel de l’utilisateur
- think-cell Charts : Visualisation des données
- Graphiques quantitatifs
- Circulaires et en anneau

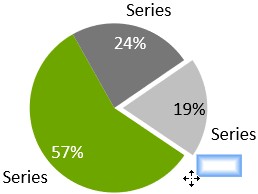
Présentation des graphiques à secteurs et en anneau
|
Icône dans le menu Éléments : |
|
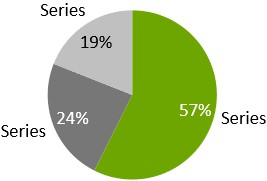
Un graphique à secteurs ou un graphique en anneau est une variante spéciale de graphique à colonnes empilées 100 % qui contient une seule catégorie (colonne) de données.
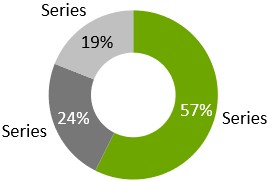
Le graphique en anneau affiche une zone circulaire vierge en son centre.
Chaque secteur d’un graphique à secteurs ou d’un graphique en anneau affiche quatre poignées lorsqu’il est sélectionné. Vous pouvez faire glisser chaque poignée avec la souris pour pivoter le graphique à secteurs. En cas de rotation, les poignées se placent aux positions 0∘, 90∘, 180∘ et 270∘, ce qui permet de créer plus facilement une mise en page esthétique.
Le graphique à secteurs ou le graphique en anneau mémorise la poignée que vous avez utilisée pour la rotation et conserve l’orientation correcte, même si les données sont modifiées. De plus, vous pouvez faire glisser les poignées vers l’extérieur du graphique afin d’accentuer le secteur concerné.
Vous pouvez tirer une poignée pour modifier la taille du centre du graphique en anneau.
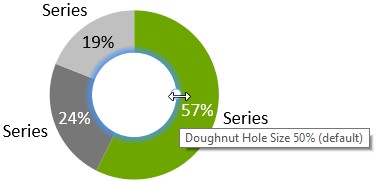
En ramenant la taille à 0 %, vous transformez le graphique en anneau en graphique à secteurs. Vous pouvez également utiliser la poignée pour façonner le centre d’un graphique à secteurs et le transformer en graphique en anneau.
Les libellés du graphique à secteurs ou du graphique en anneau prennent en charge la propriété de contenu de libellé qui permet de choisir d’afficher des valeurs absolues, des pourcentages ou les deux (Contenu du libellé). En outre, vous pouvez déplacer chaque libellé extérieur pour le placer en tout point sur le bord extérieur du secteur concerné.
Pour ajouter un libellé de titre à un graphique en anneau, utilisez 
Des connecteurs universels peuvent être utilisés pour relier des graphiques à secteurs ou des graphiques en anneau à d’autres types de graphiques (voir Connecteurs universels).
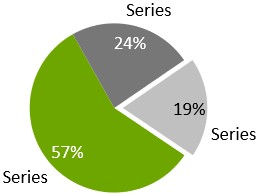
Modifier l’ordre des secteurs
Vous pouvez modifier l’ordre dans lequel les secteurs apparaissent dans les graphiques à secteurs et en anneau. Pour ce faire, procédez comme suit :
- Sélectionnez le graphique pour ouvrir sa mini barre d’outils.
- Dans le menu Slice Order, choisissez l’ordre des secteurs souhaité.
- Sheet Order Clockwise : les secteurs apparaissent dans le sens des aiguilles d’une montre dans le même ordre que la plage de données liée.
- Sheet Order Counterclockwise : les secteurs apparaissent dans le sens inverse des aiguilles d’une montre dans le même ordre que la plage de données liée.
- Ascending Order Clockwise : les secteurs apparaissent dans le sens des aiguilles d’une montre du plus petit au plus grand.
- Descending Order Clockwise : les secteurs apparaissent dans le sens des aiguilles d’une montre du plus grand au plus petit.
Pour savoir quand utiliser (ou ne pas utiliser) un graphique à secteurs, lisez cet article de blog.
Besoin de dépannage
Consultez notre base de connaissances