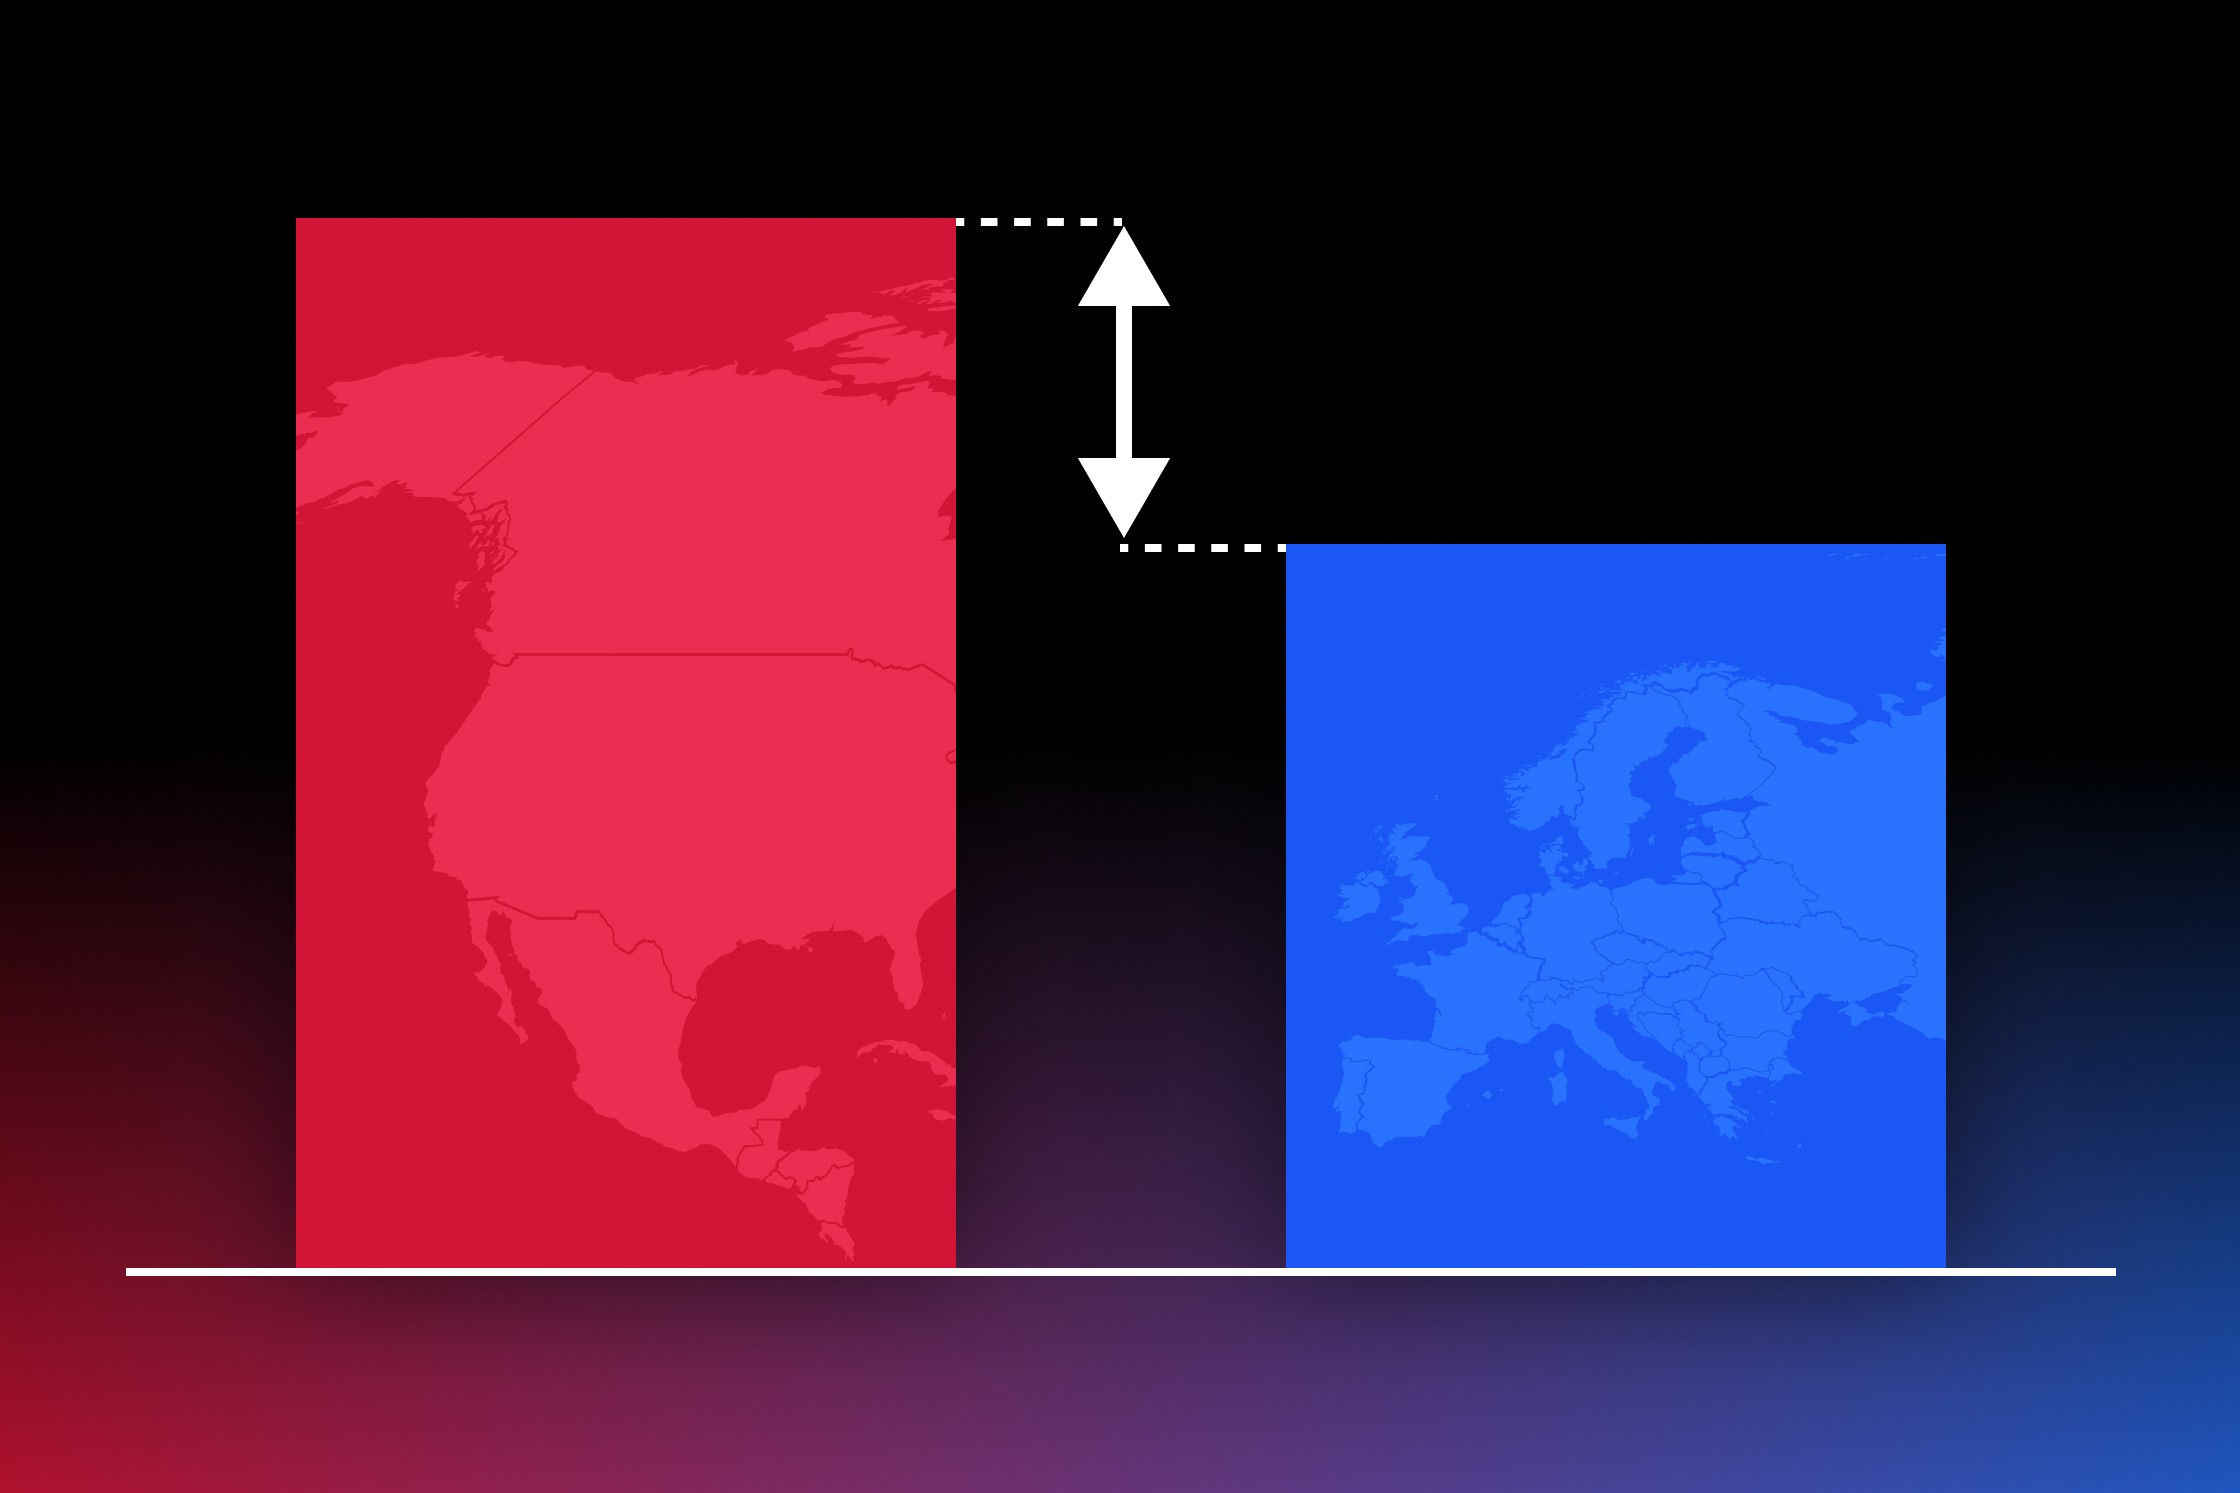
我们分析了北美和欧洲在演示文稿创作中采用 AI 的数据和统计信息,深入洞察 AI 趋势、行为和态度。
2026年7月29日 - 阅读约 17 分钟
PowerPoint 中的幻灯片母版是整个演示文稿的基础。了解如何高效创建、编辑和管理幻灯片母版。
2026年6月30日 - 阅读约 24 分钟
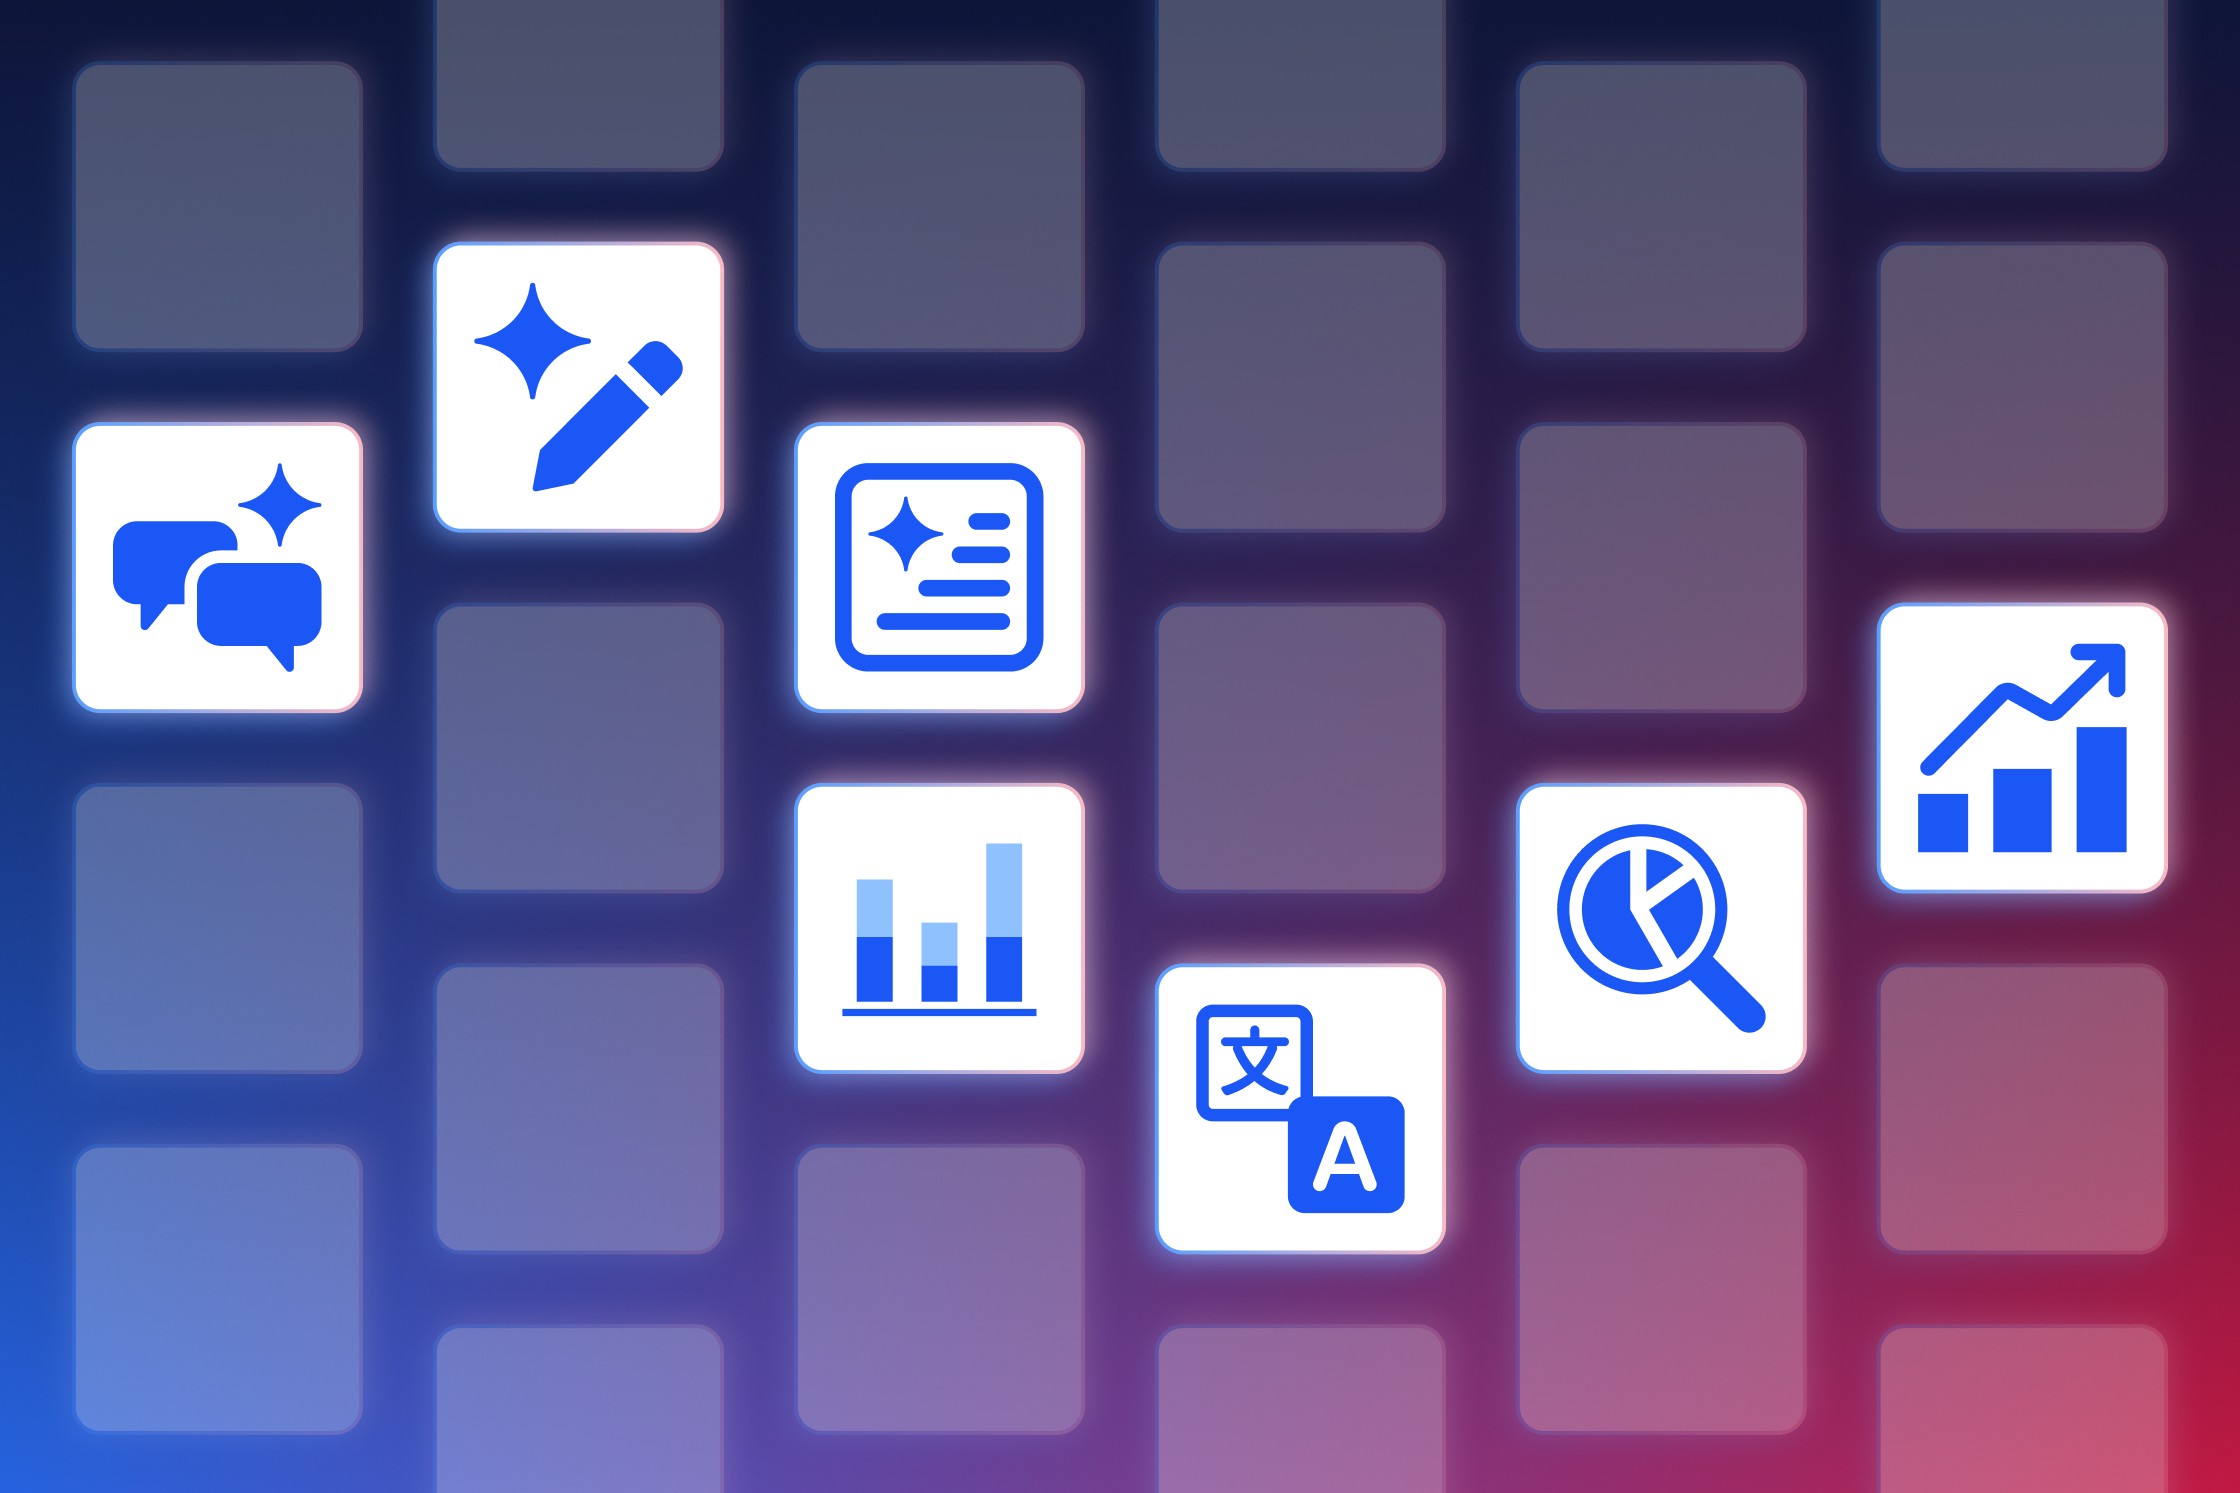
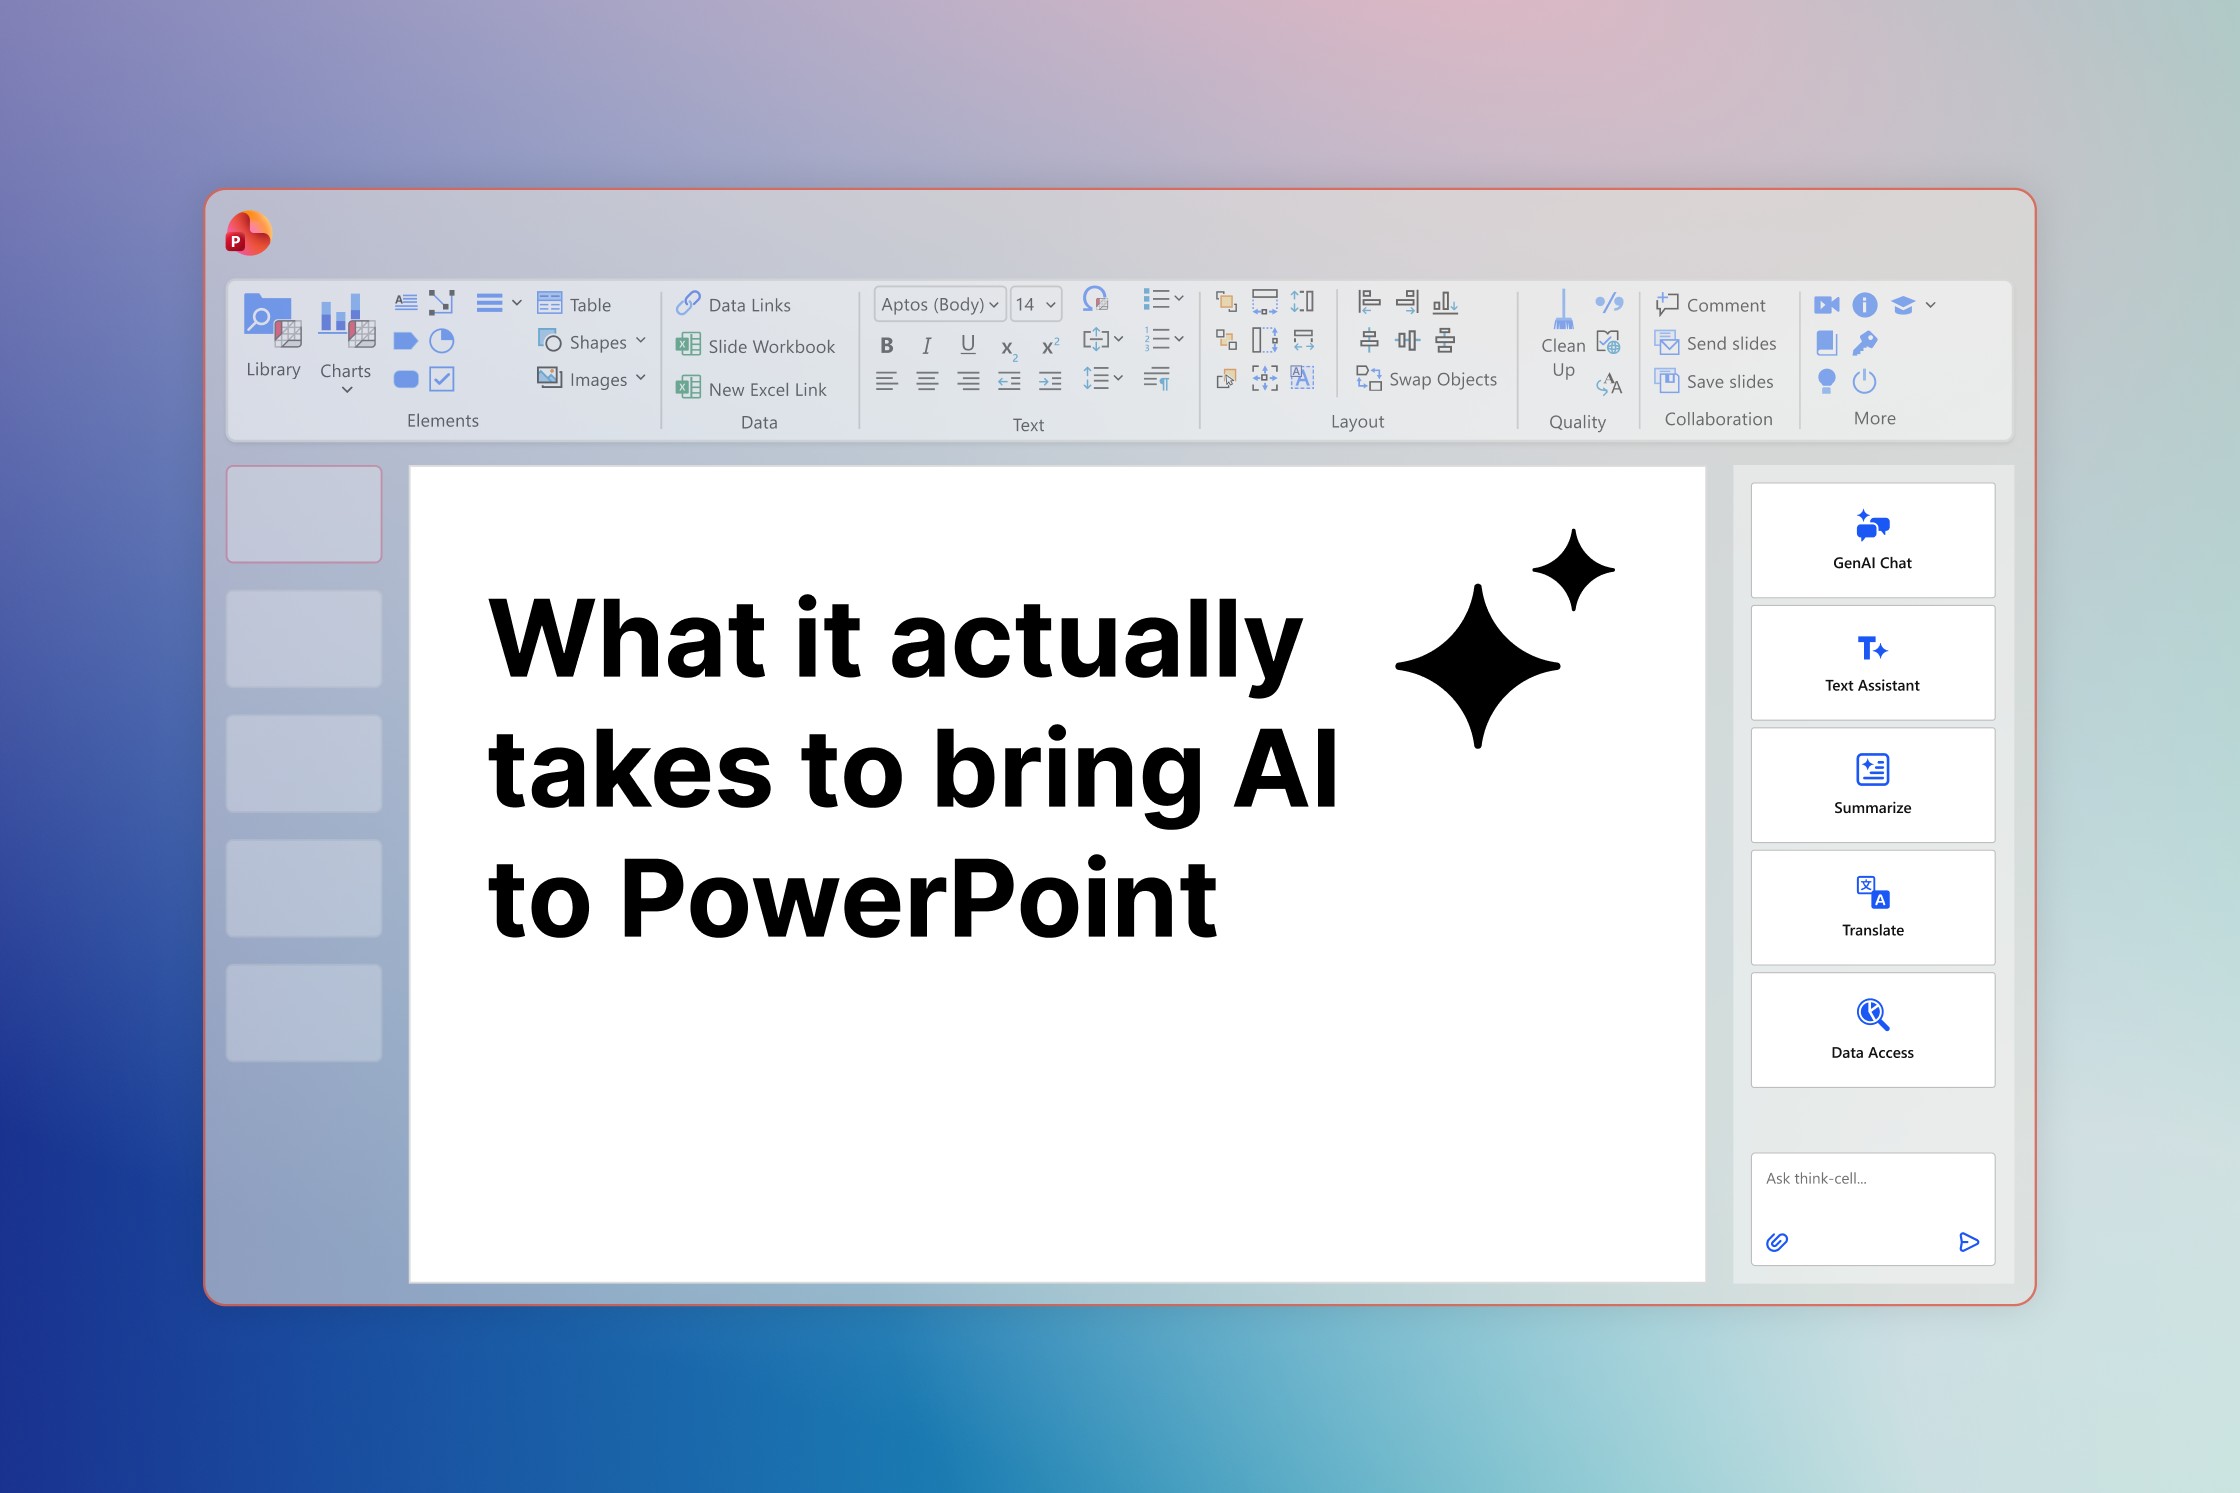
think-cell Assist 将 7 款 AI 工具直接集成到 PowerPoint 和 Excel 中。从图表生成到幻灯片翻译,所有输出都由你审核、编辑并最终确认。
2026年6月24日 - 阅读约 15 分钟
了解如何选择最佳的免费 PowerPoint 图标,并通过自定义选项让每个图标更符合你的需求。
2026年6月3日 - 阅读约 11 分钟
免费试用 think-cell。全面使用高级图表、幻灯片模板库和智能布局工具。无需信用卡。
了解如何评估选择最佳演示文稿库时最重要的功能,包括模板、图片和其他视觉素材。
2026年5月27日 - 阅读约 14 分钟
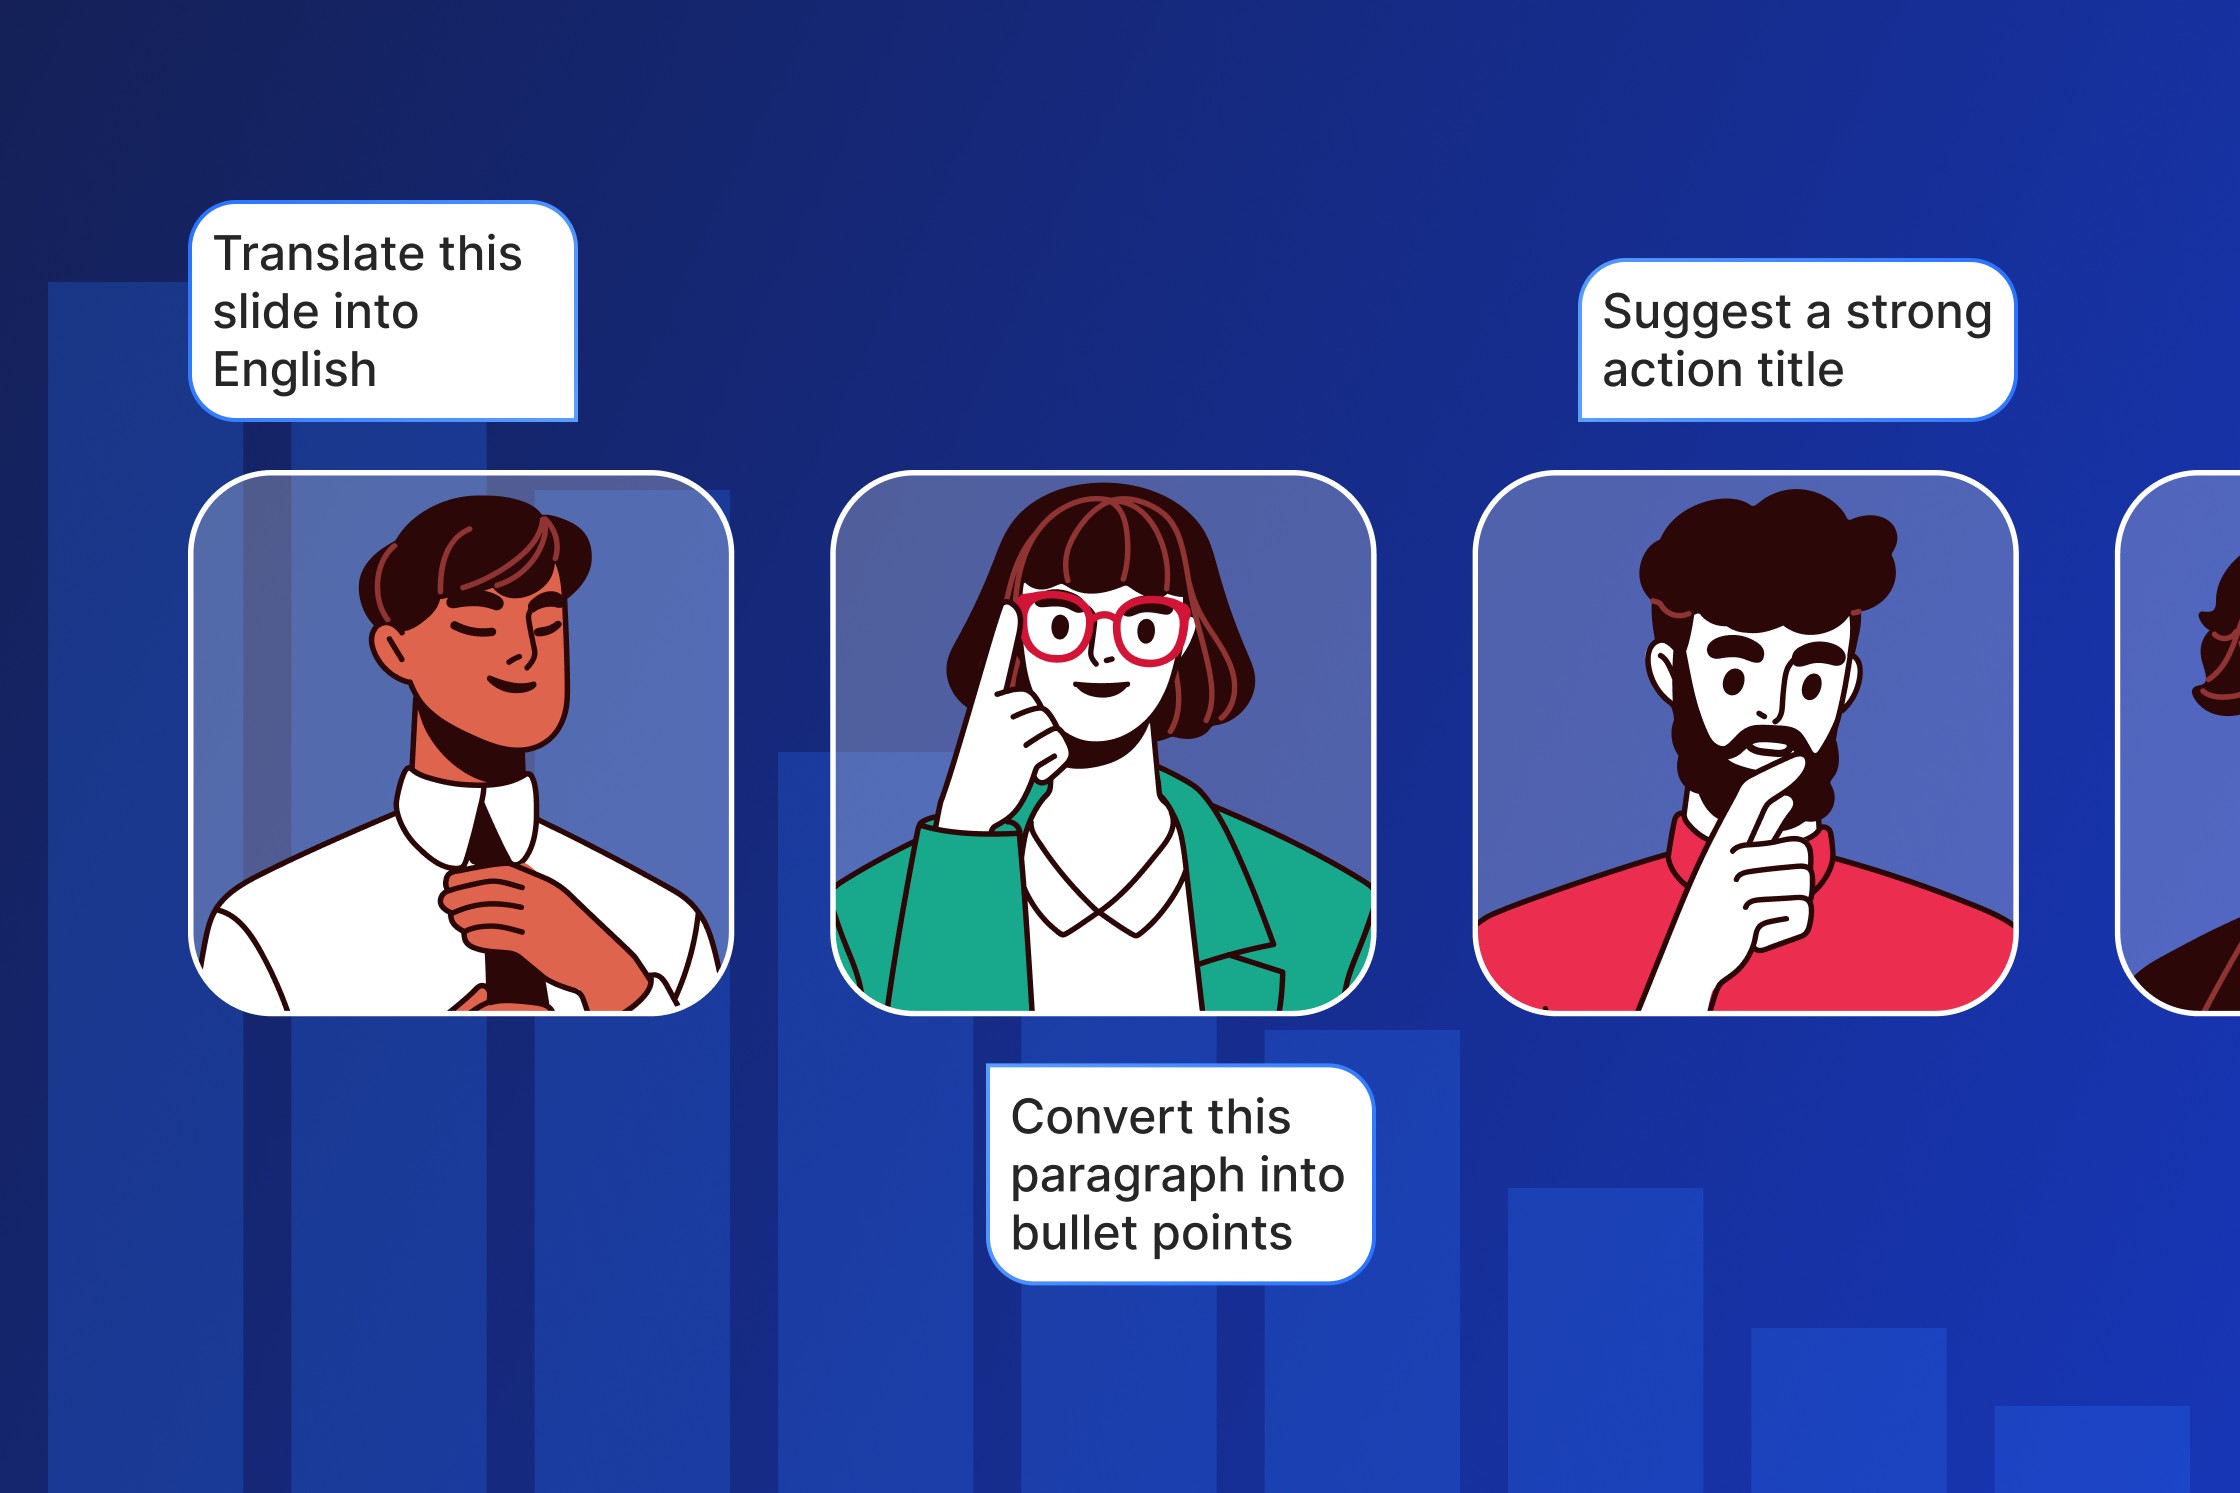
think-cell 员工如何在制作演示文稿时使用 AI:从在第一张幻灯片之前对叙事进行压力测试,到在最后撰写行动标题。
2026年4月22日 - 阅读约 18 分钟

了解最重要的趋势线,并探索如何在 Excel 和 PowerPoint 中使用 think-cell 创建它们。
2026年4月8日 - 阅读约 24 分钟
为什么 AI 生成的 PowerPoint 幻灯片难以满足专业用户?think-cell 的 CEO 拆解技术门槛与未来机会。
2026年3月23日 - 阅读约 9 分钟
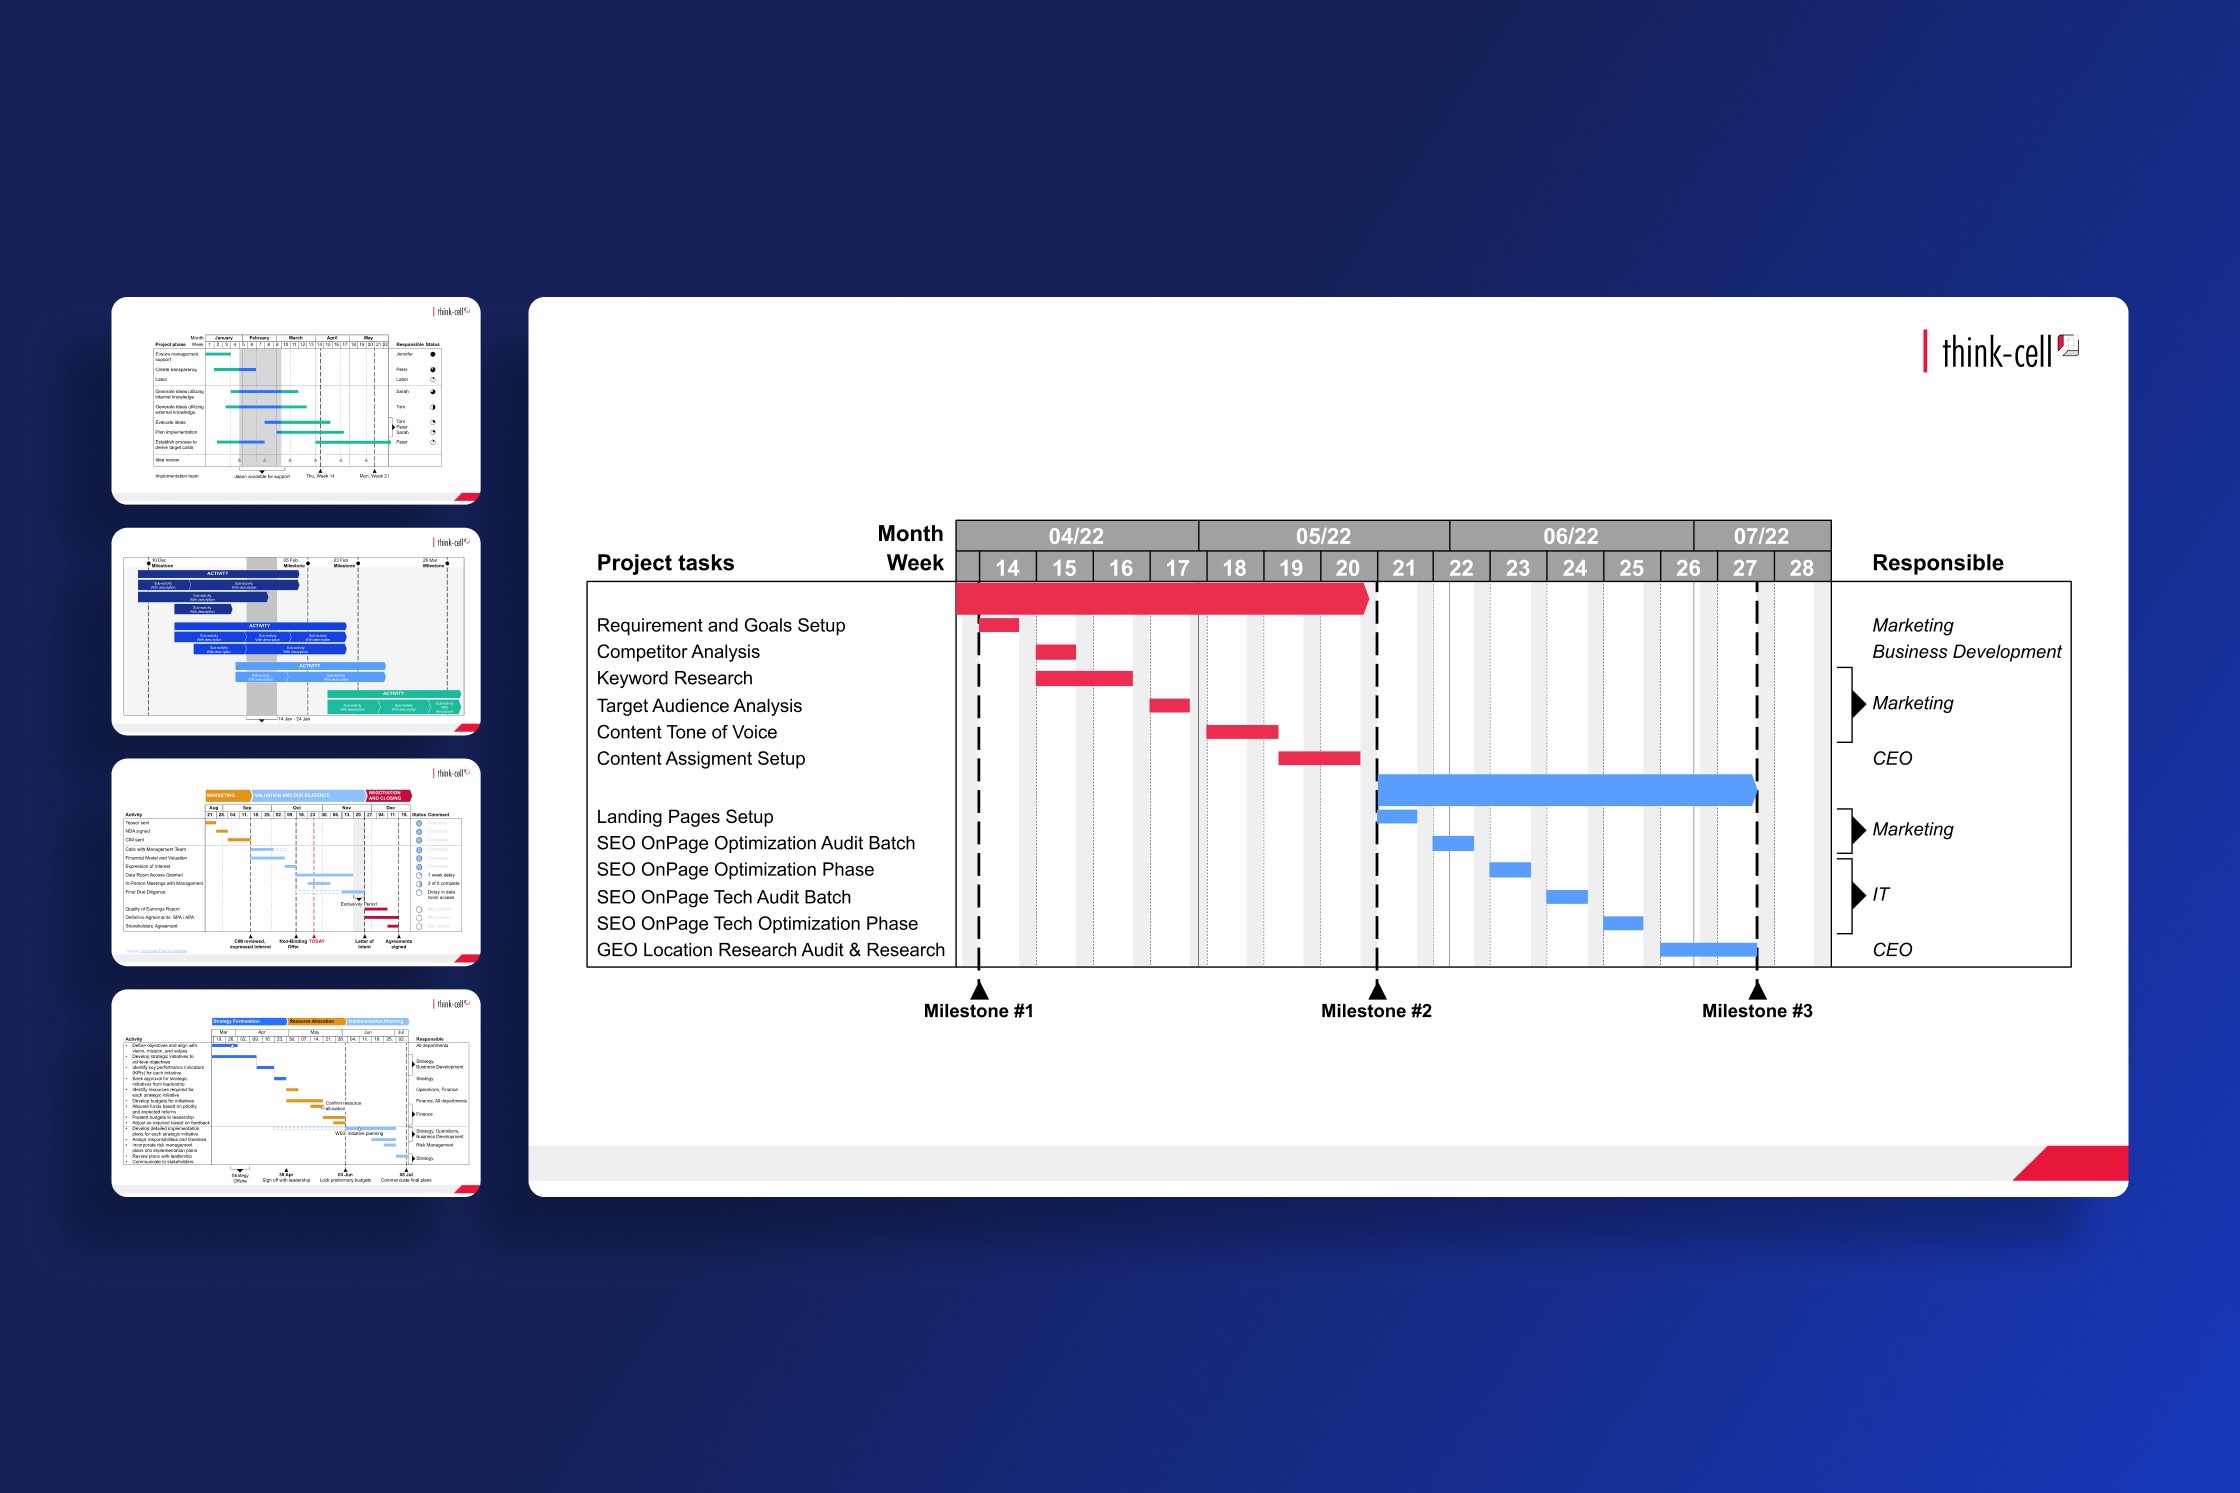
复杂项目通常最适合用甘特图来可视化。为了帮助你构建更好的项目时间线,我们解答了关于甘特图的核心问题。
2026年3月22日 - 阅读约 59 分钟
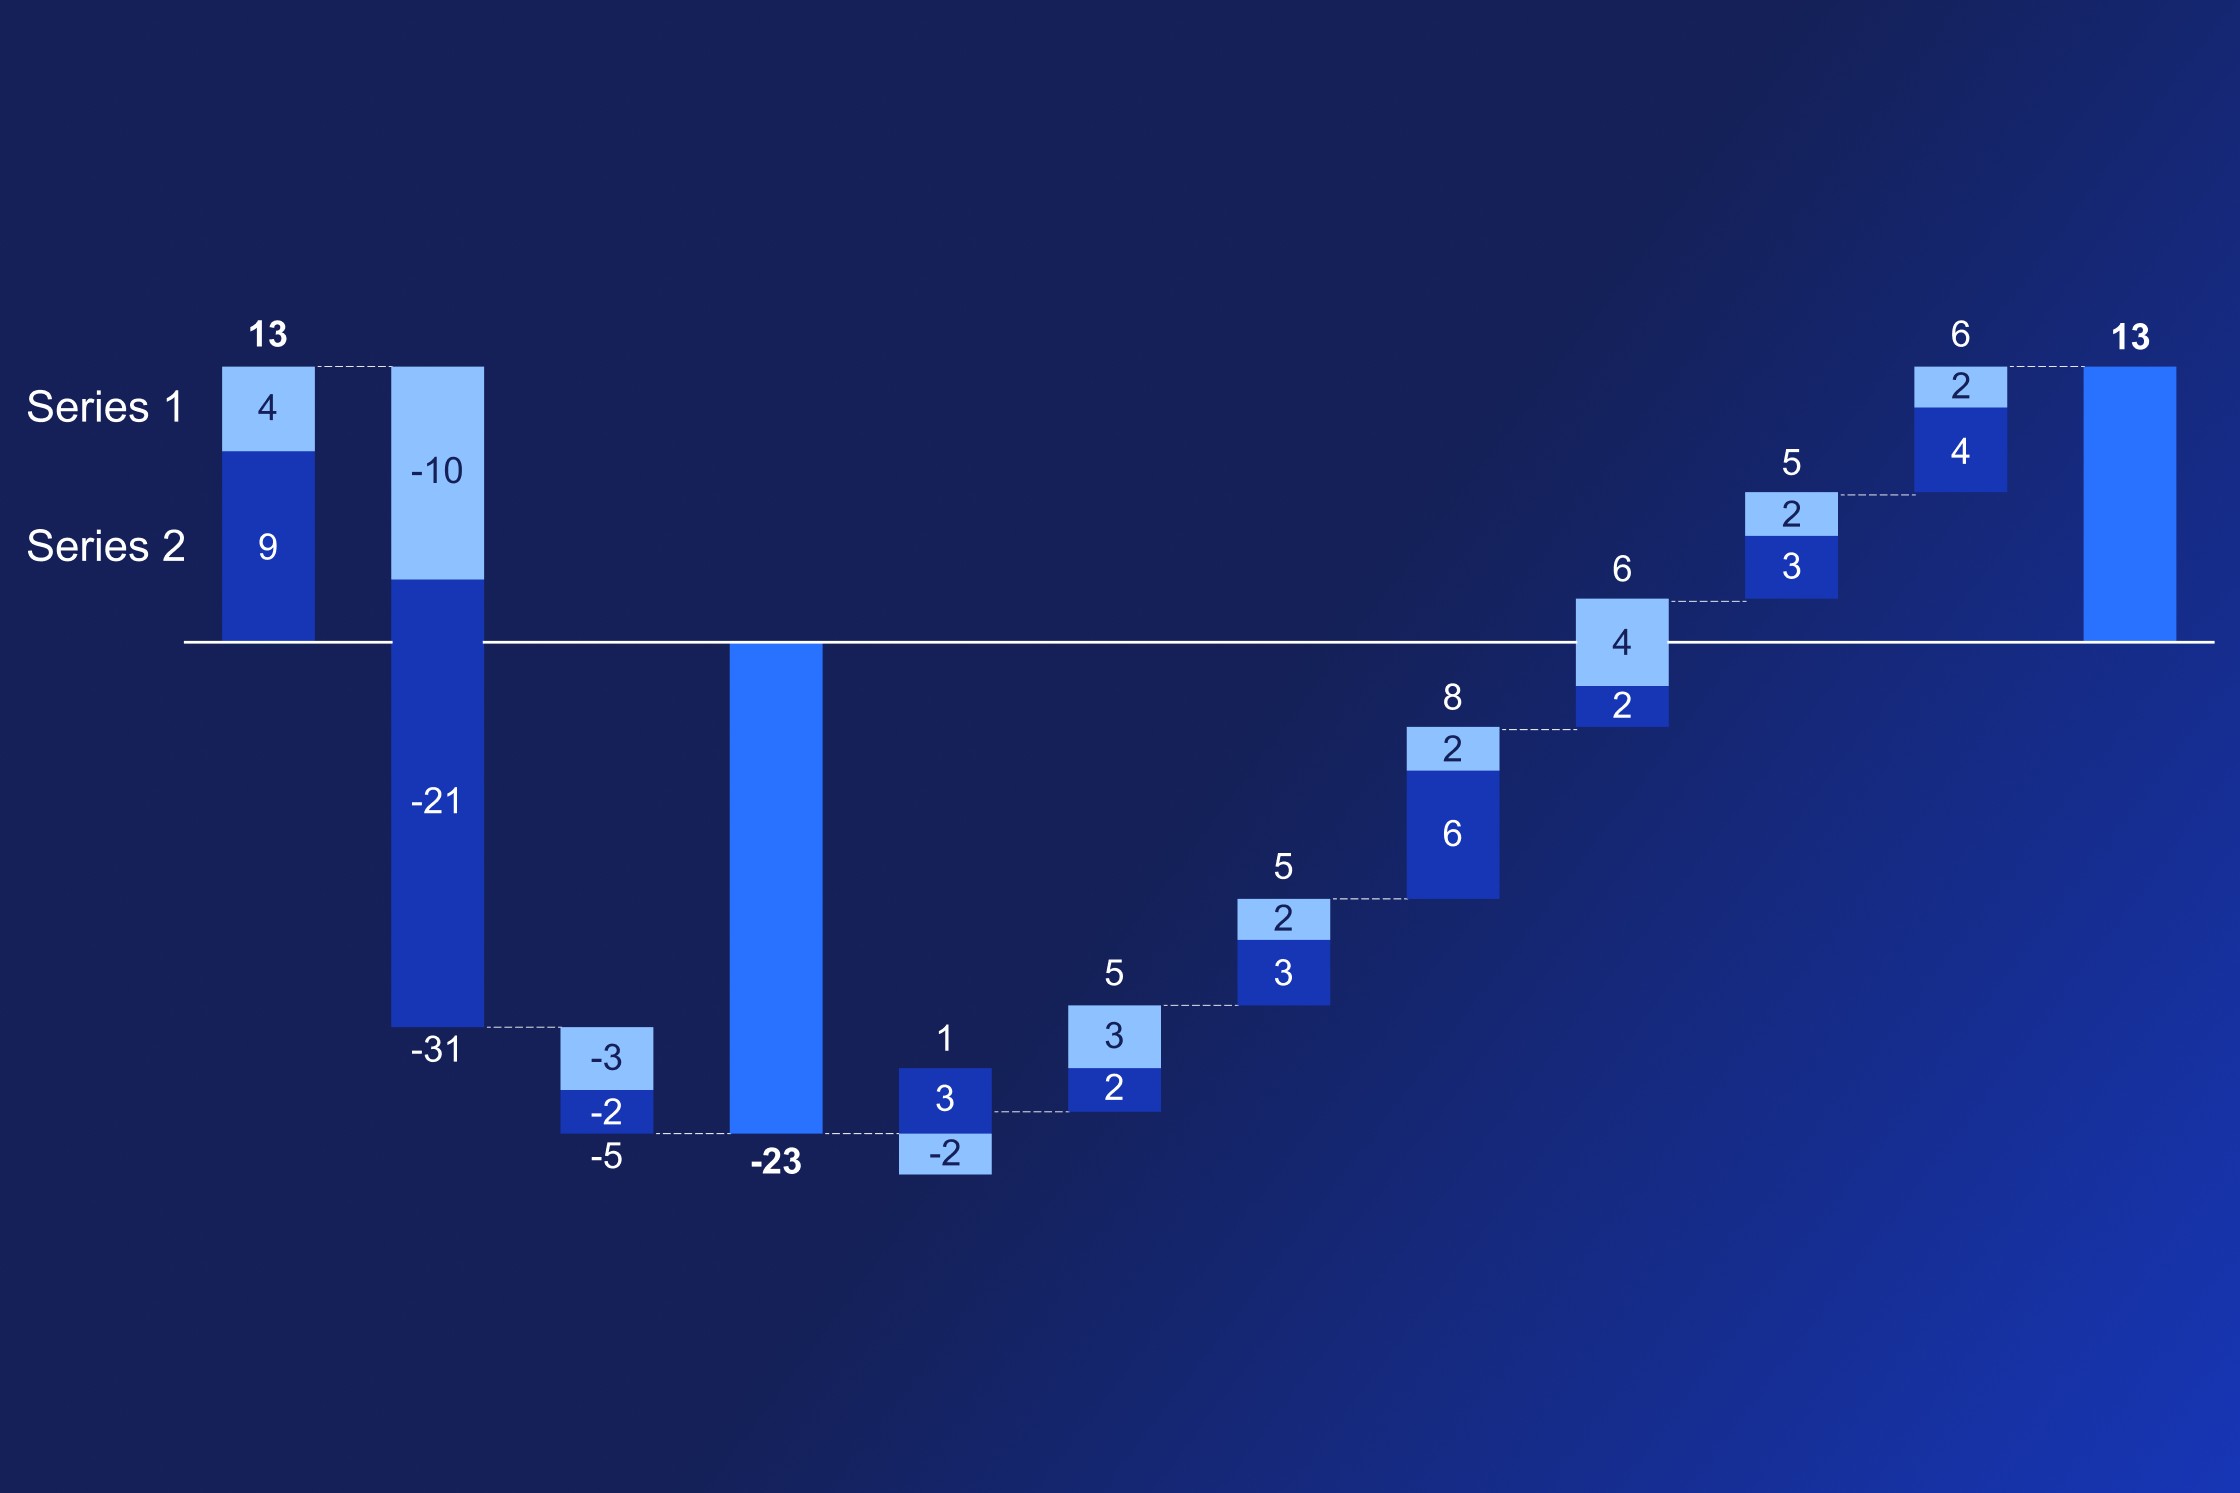
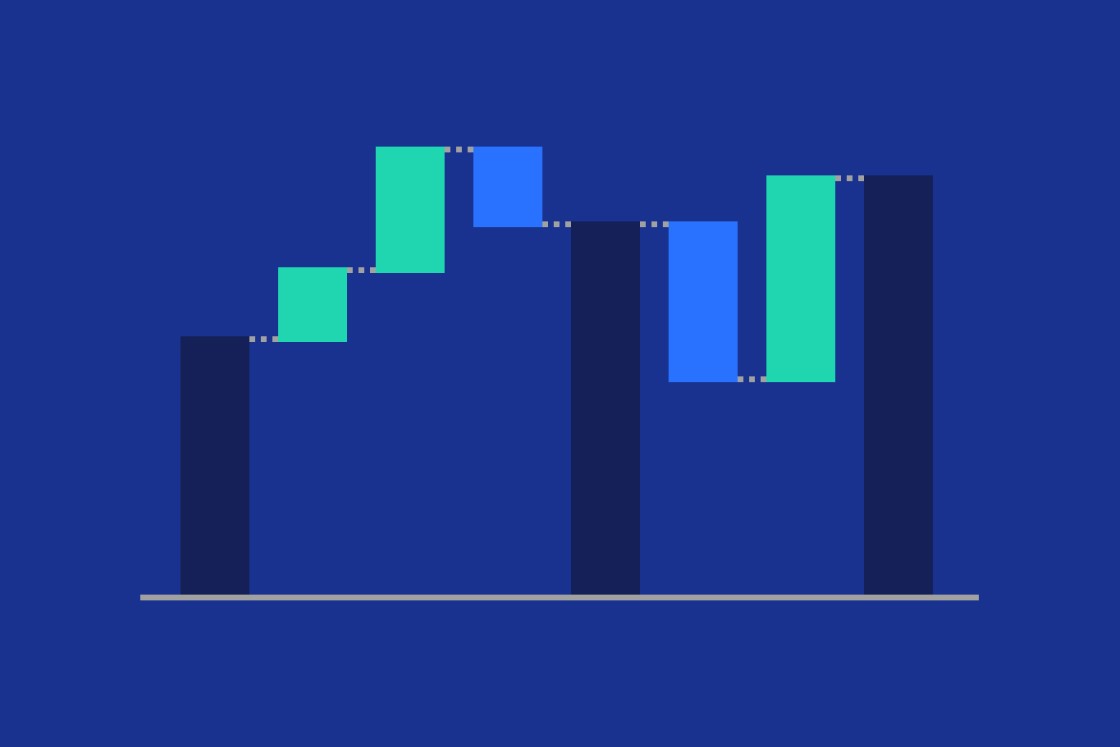
了解如何使用多系列瀑布图,讲述一个有力量、层次丰富的故事,呈现不同因素如何共同构成总体。
2026年3月21日 - 阅读约 14 分钟
获取免费的 PowerPoint 项目规划模板,其中包含完整的大纲,您可以轻松编辑以用于您的商务演示。
2026年2月10日 - 阅读约 8 分钟
五种实用方法,将杂乱的数据幻灯片转化为清晰、以故事为驱动且能打动受众的可视化呈现。
2026年1月29日 - 阅读约 19 分钟
了解构建箱形图的分步过程,首先了解可以使用哪种图表和如何调整图表,以制作出专业的数据可视化效果。
2026年1月22日 - 阅读约 15 分钟
从设置矩阵和输入数据到设置专业可视化效果的格式,逐步学习构建气泡图矩阵的过程。
2025年12月16日 - 阅读约 18 分钟
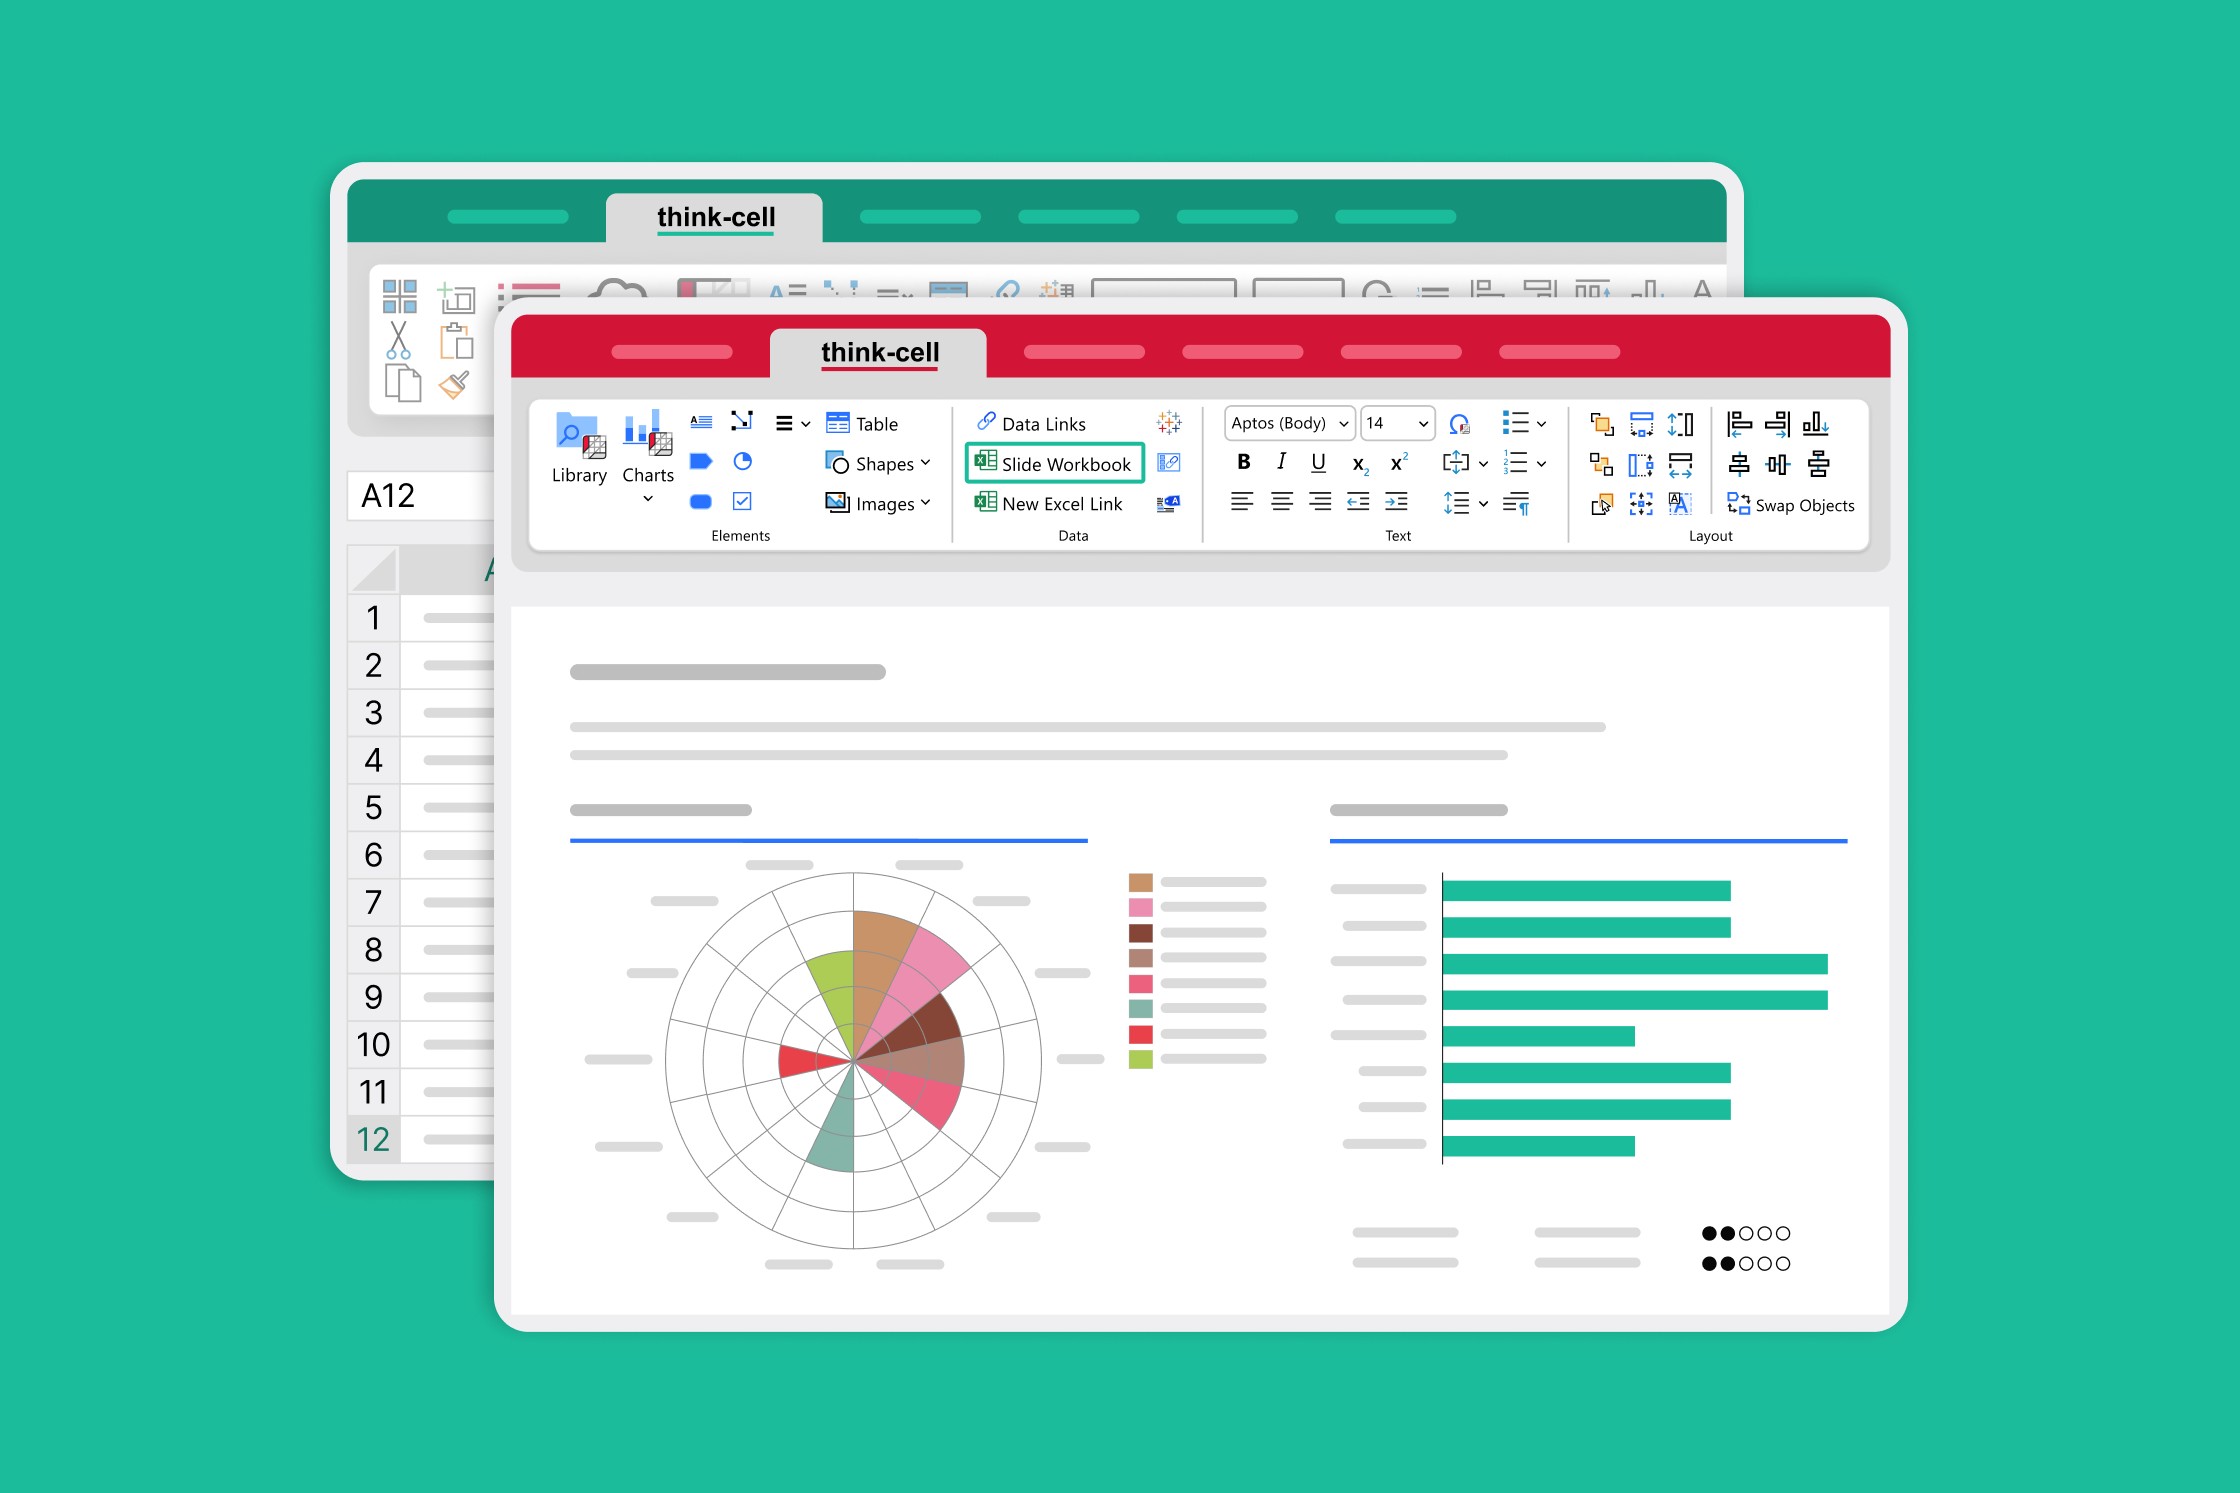
了解幻灯片工作簿如何通过将临时数据表的灵活性与 Excel 的全部功能相结合来改变数据密集型演示文稿的构建方式。
2025年12月8日 - 阅读约 20 分钟
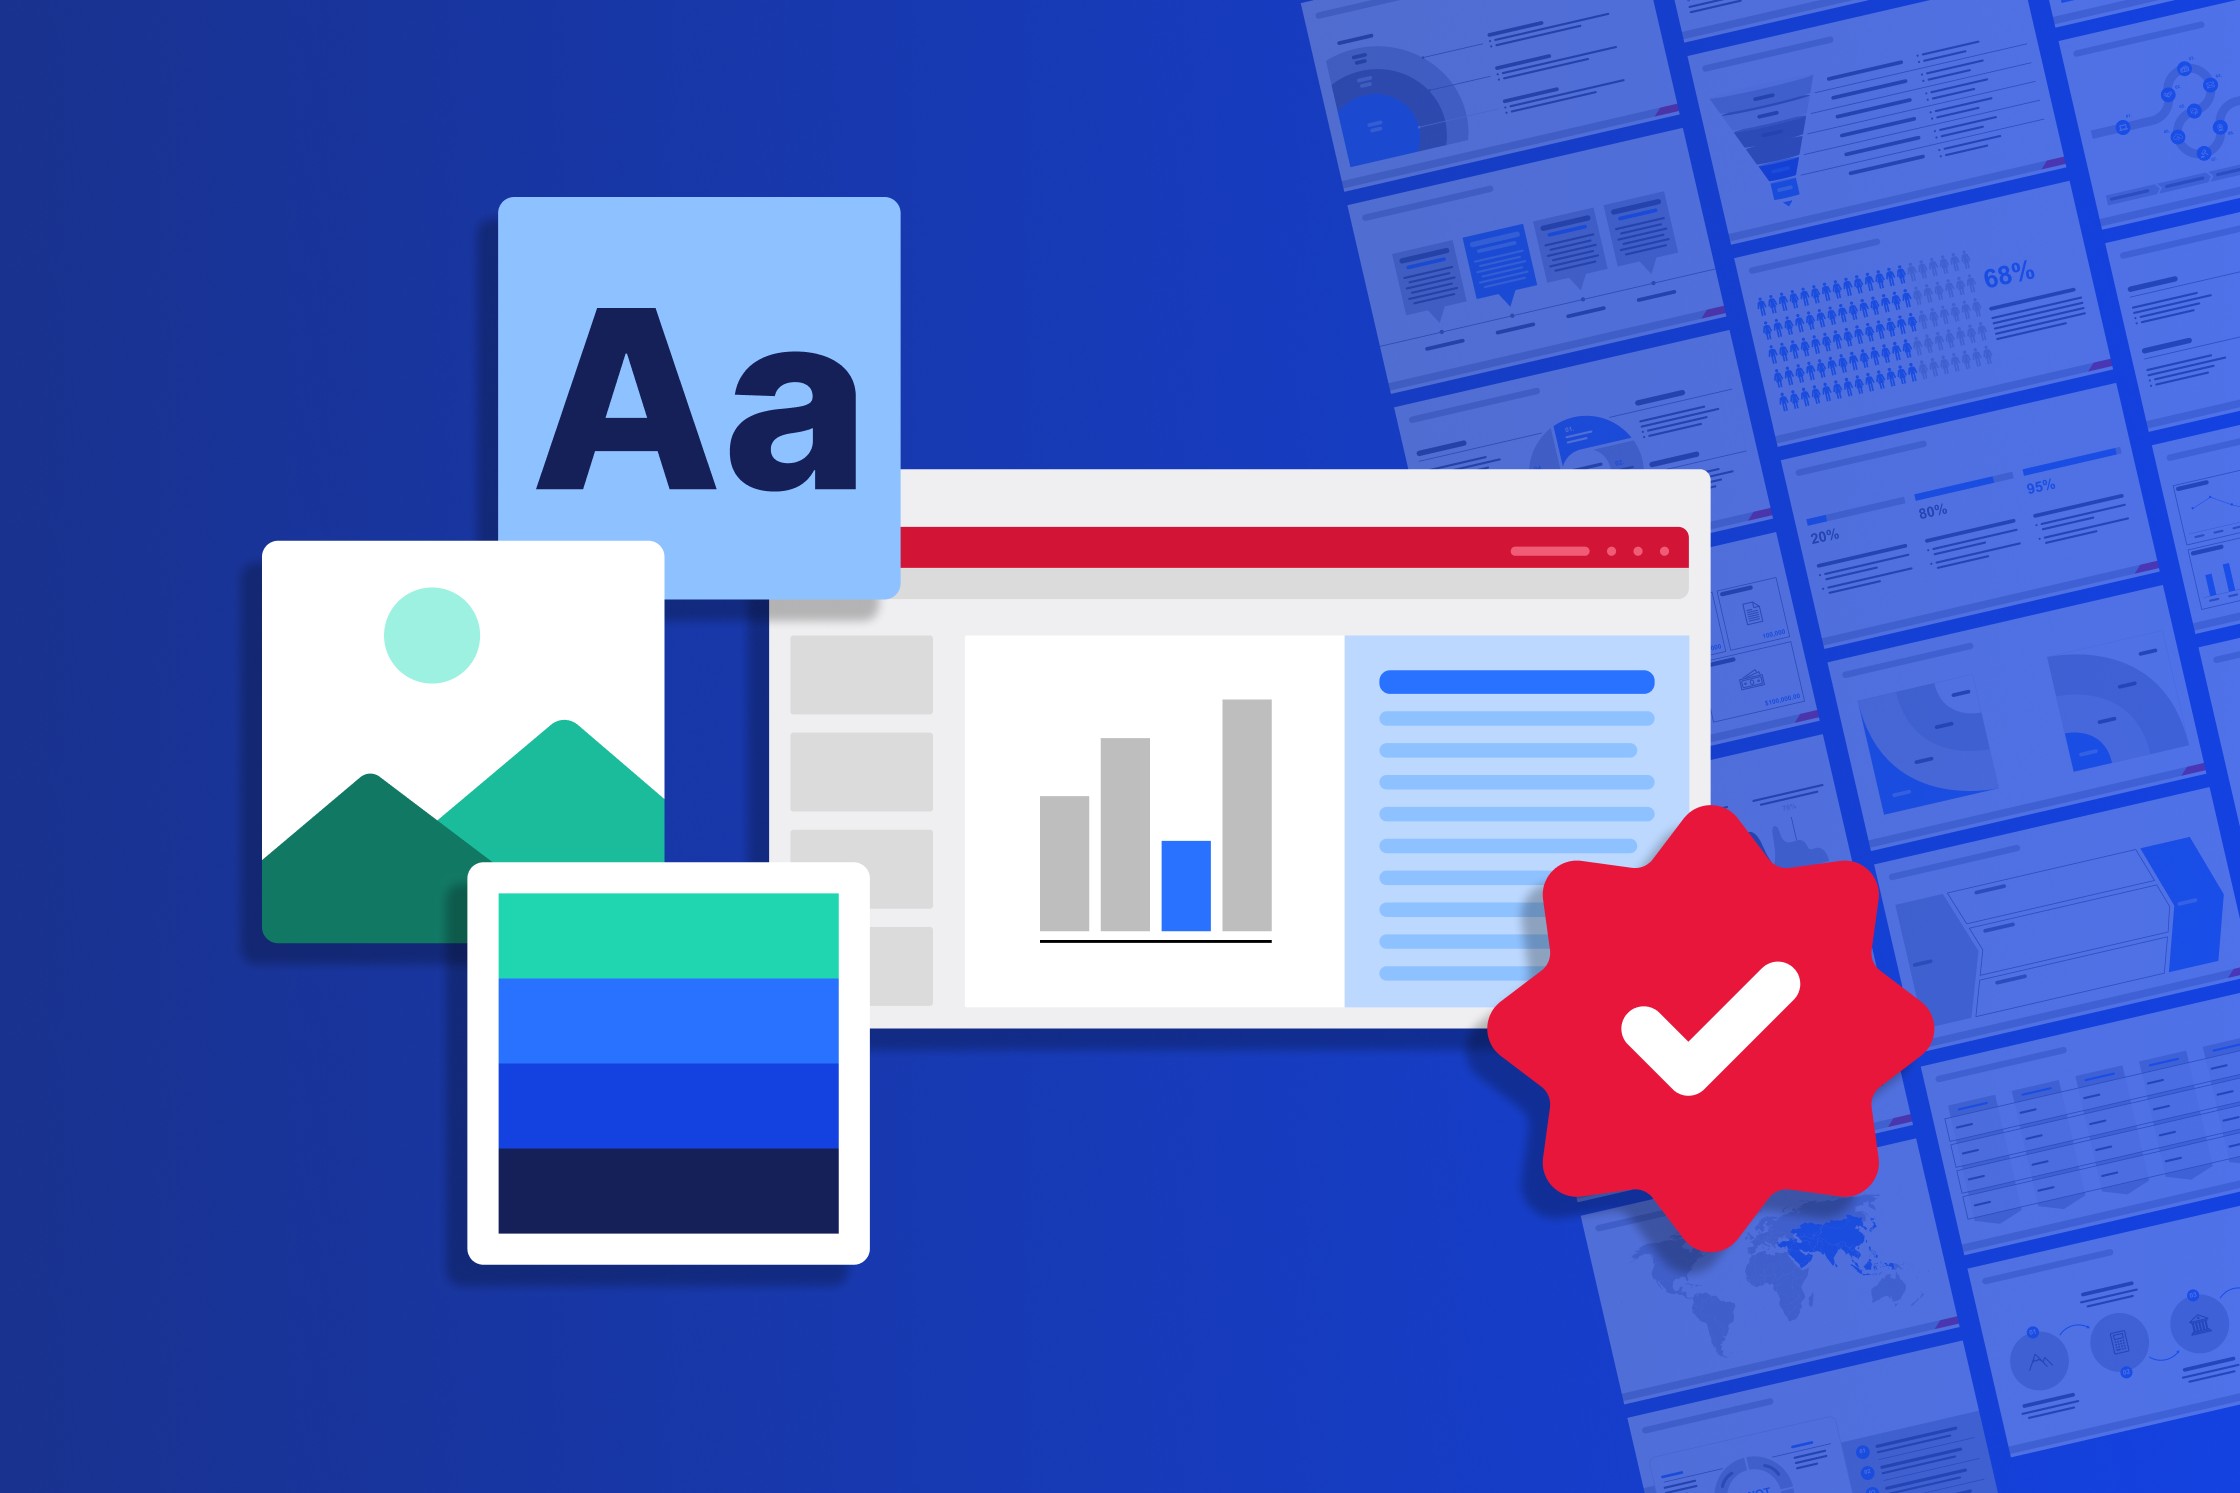
想更专注于打造演示文稿的核心信息?来看一下 think-cell 14 如何通过五项全新功能,大幅减少您的排版、布局和数据准备耗时,让您真正专注演示内容本身。
2025年12月2日 - 阅读约 10 分钟
了解 PowerPoint 演示中的企业形象与品牌合规的重要意义,并进一步认识 think-cell 如何帮助团队轻松实现 100% 品牌一致性。
2025年11月24日 - 阅读约 21 分钟
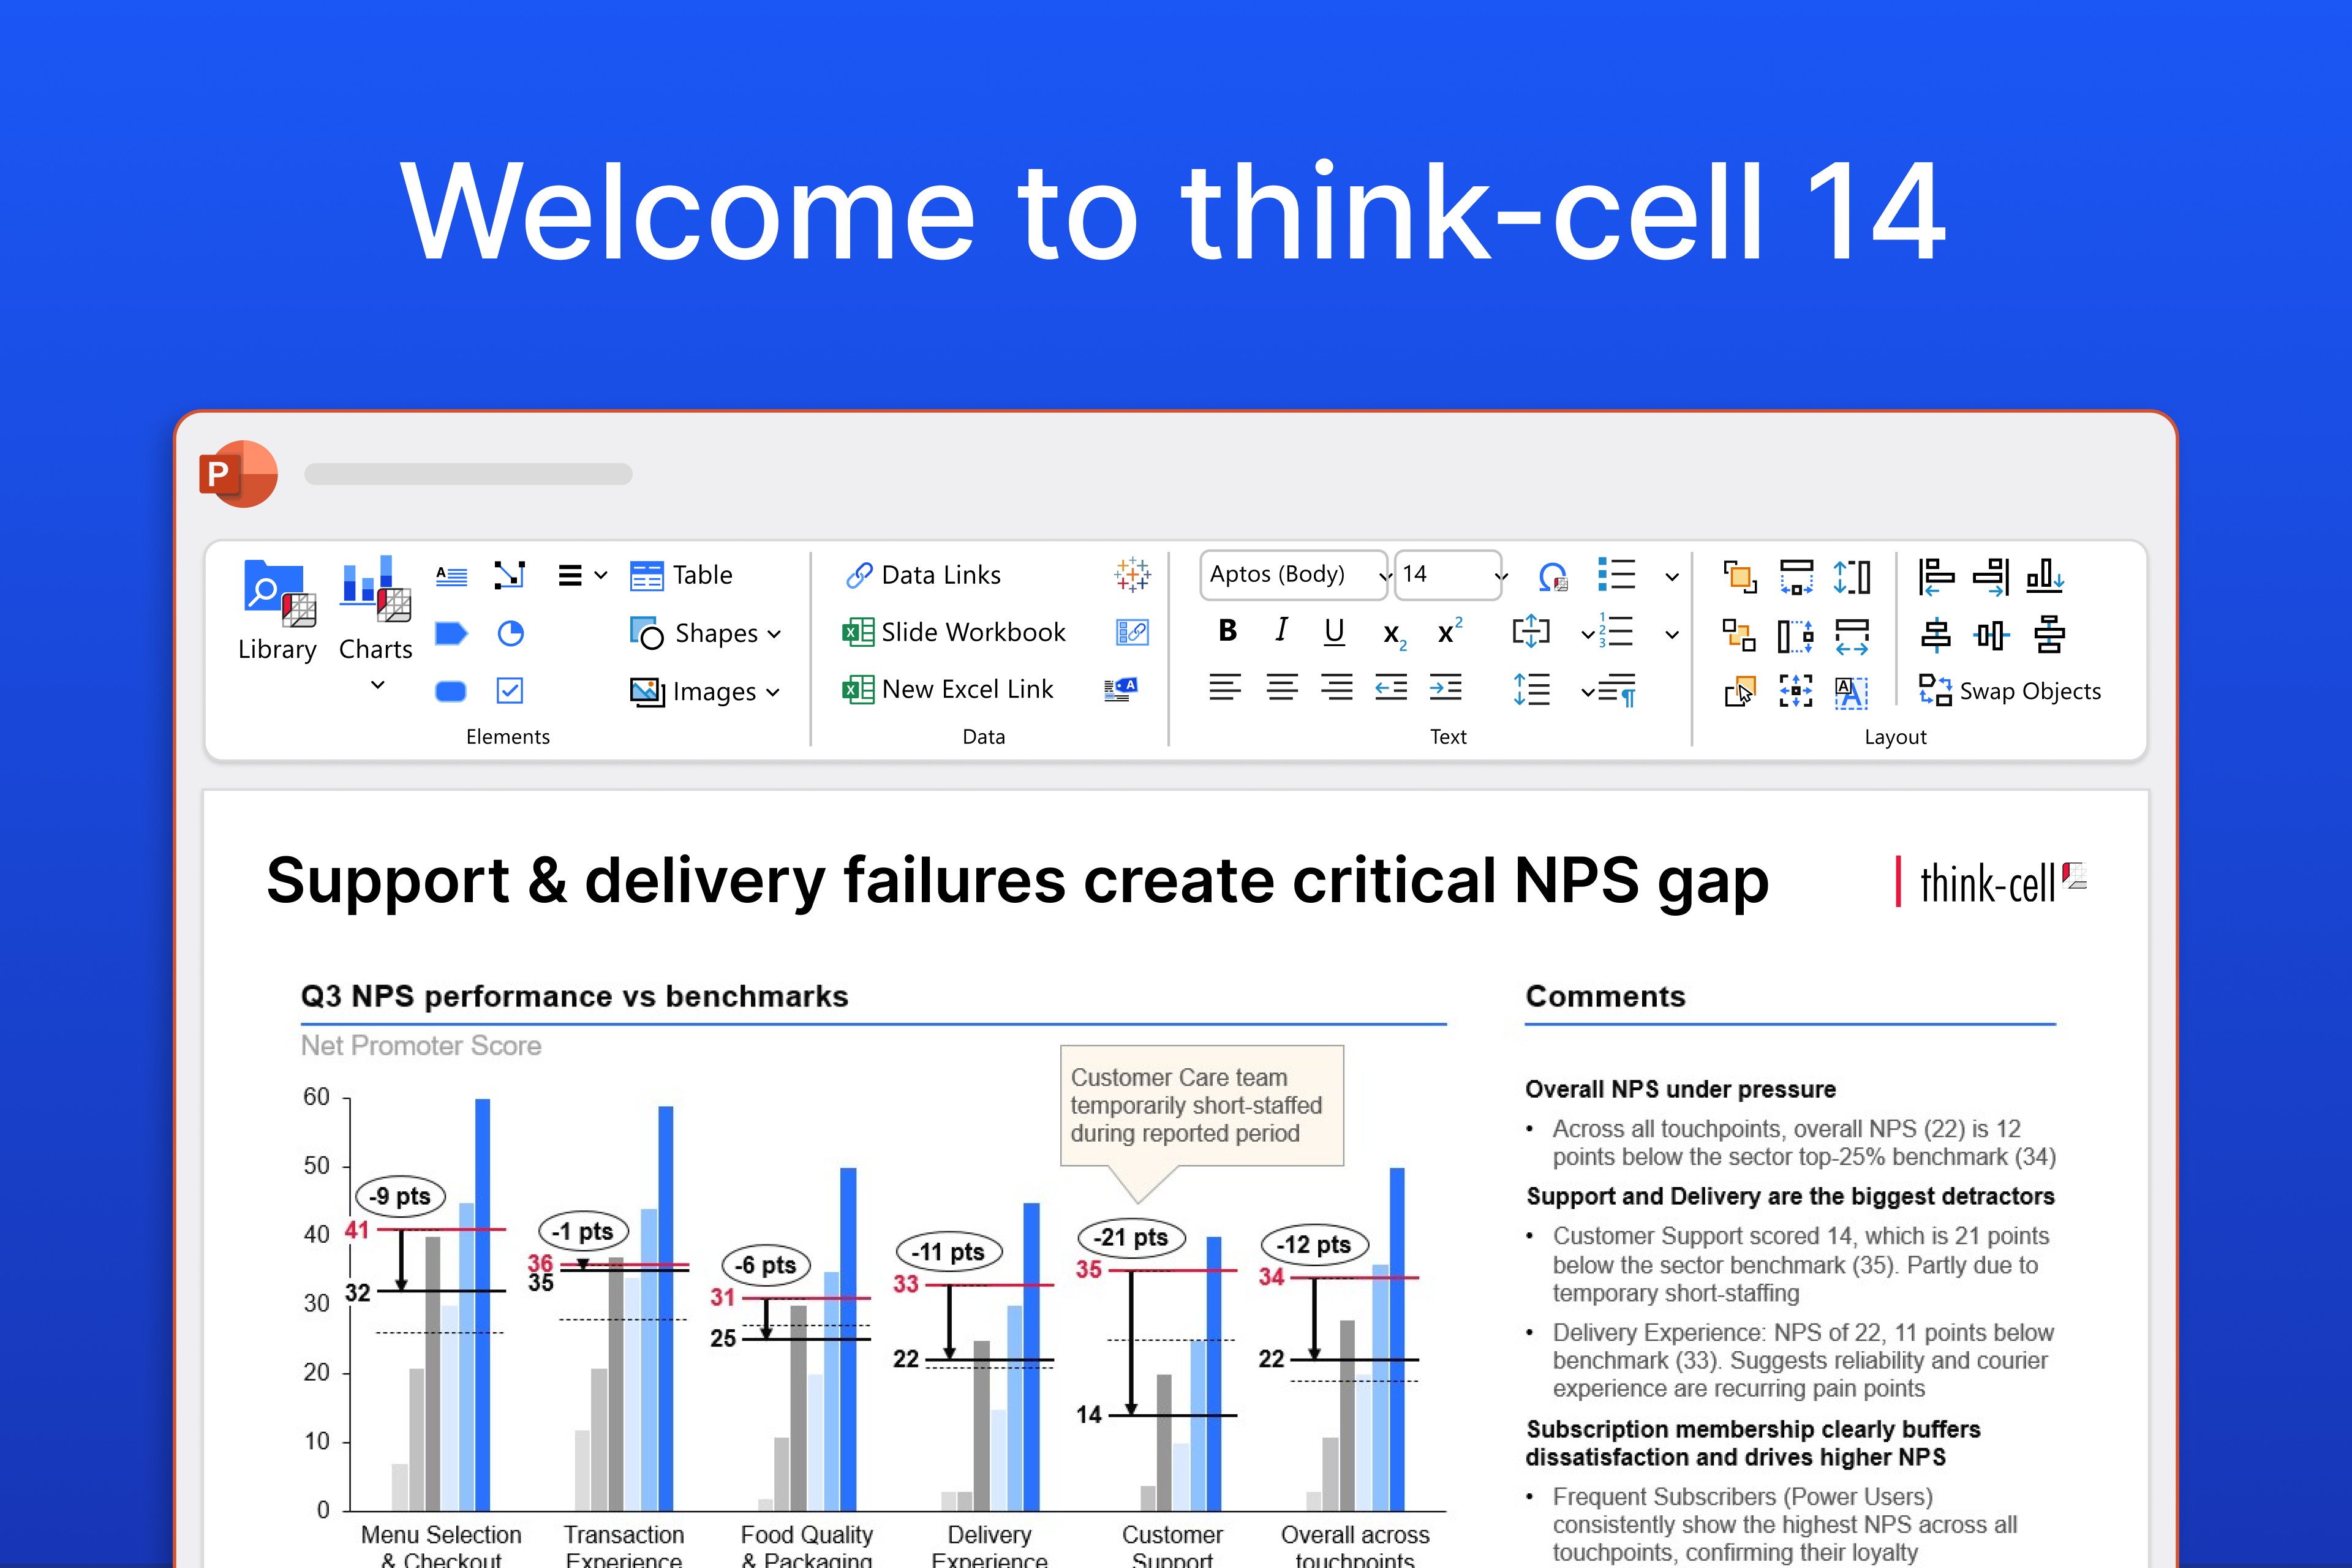
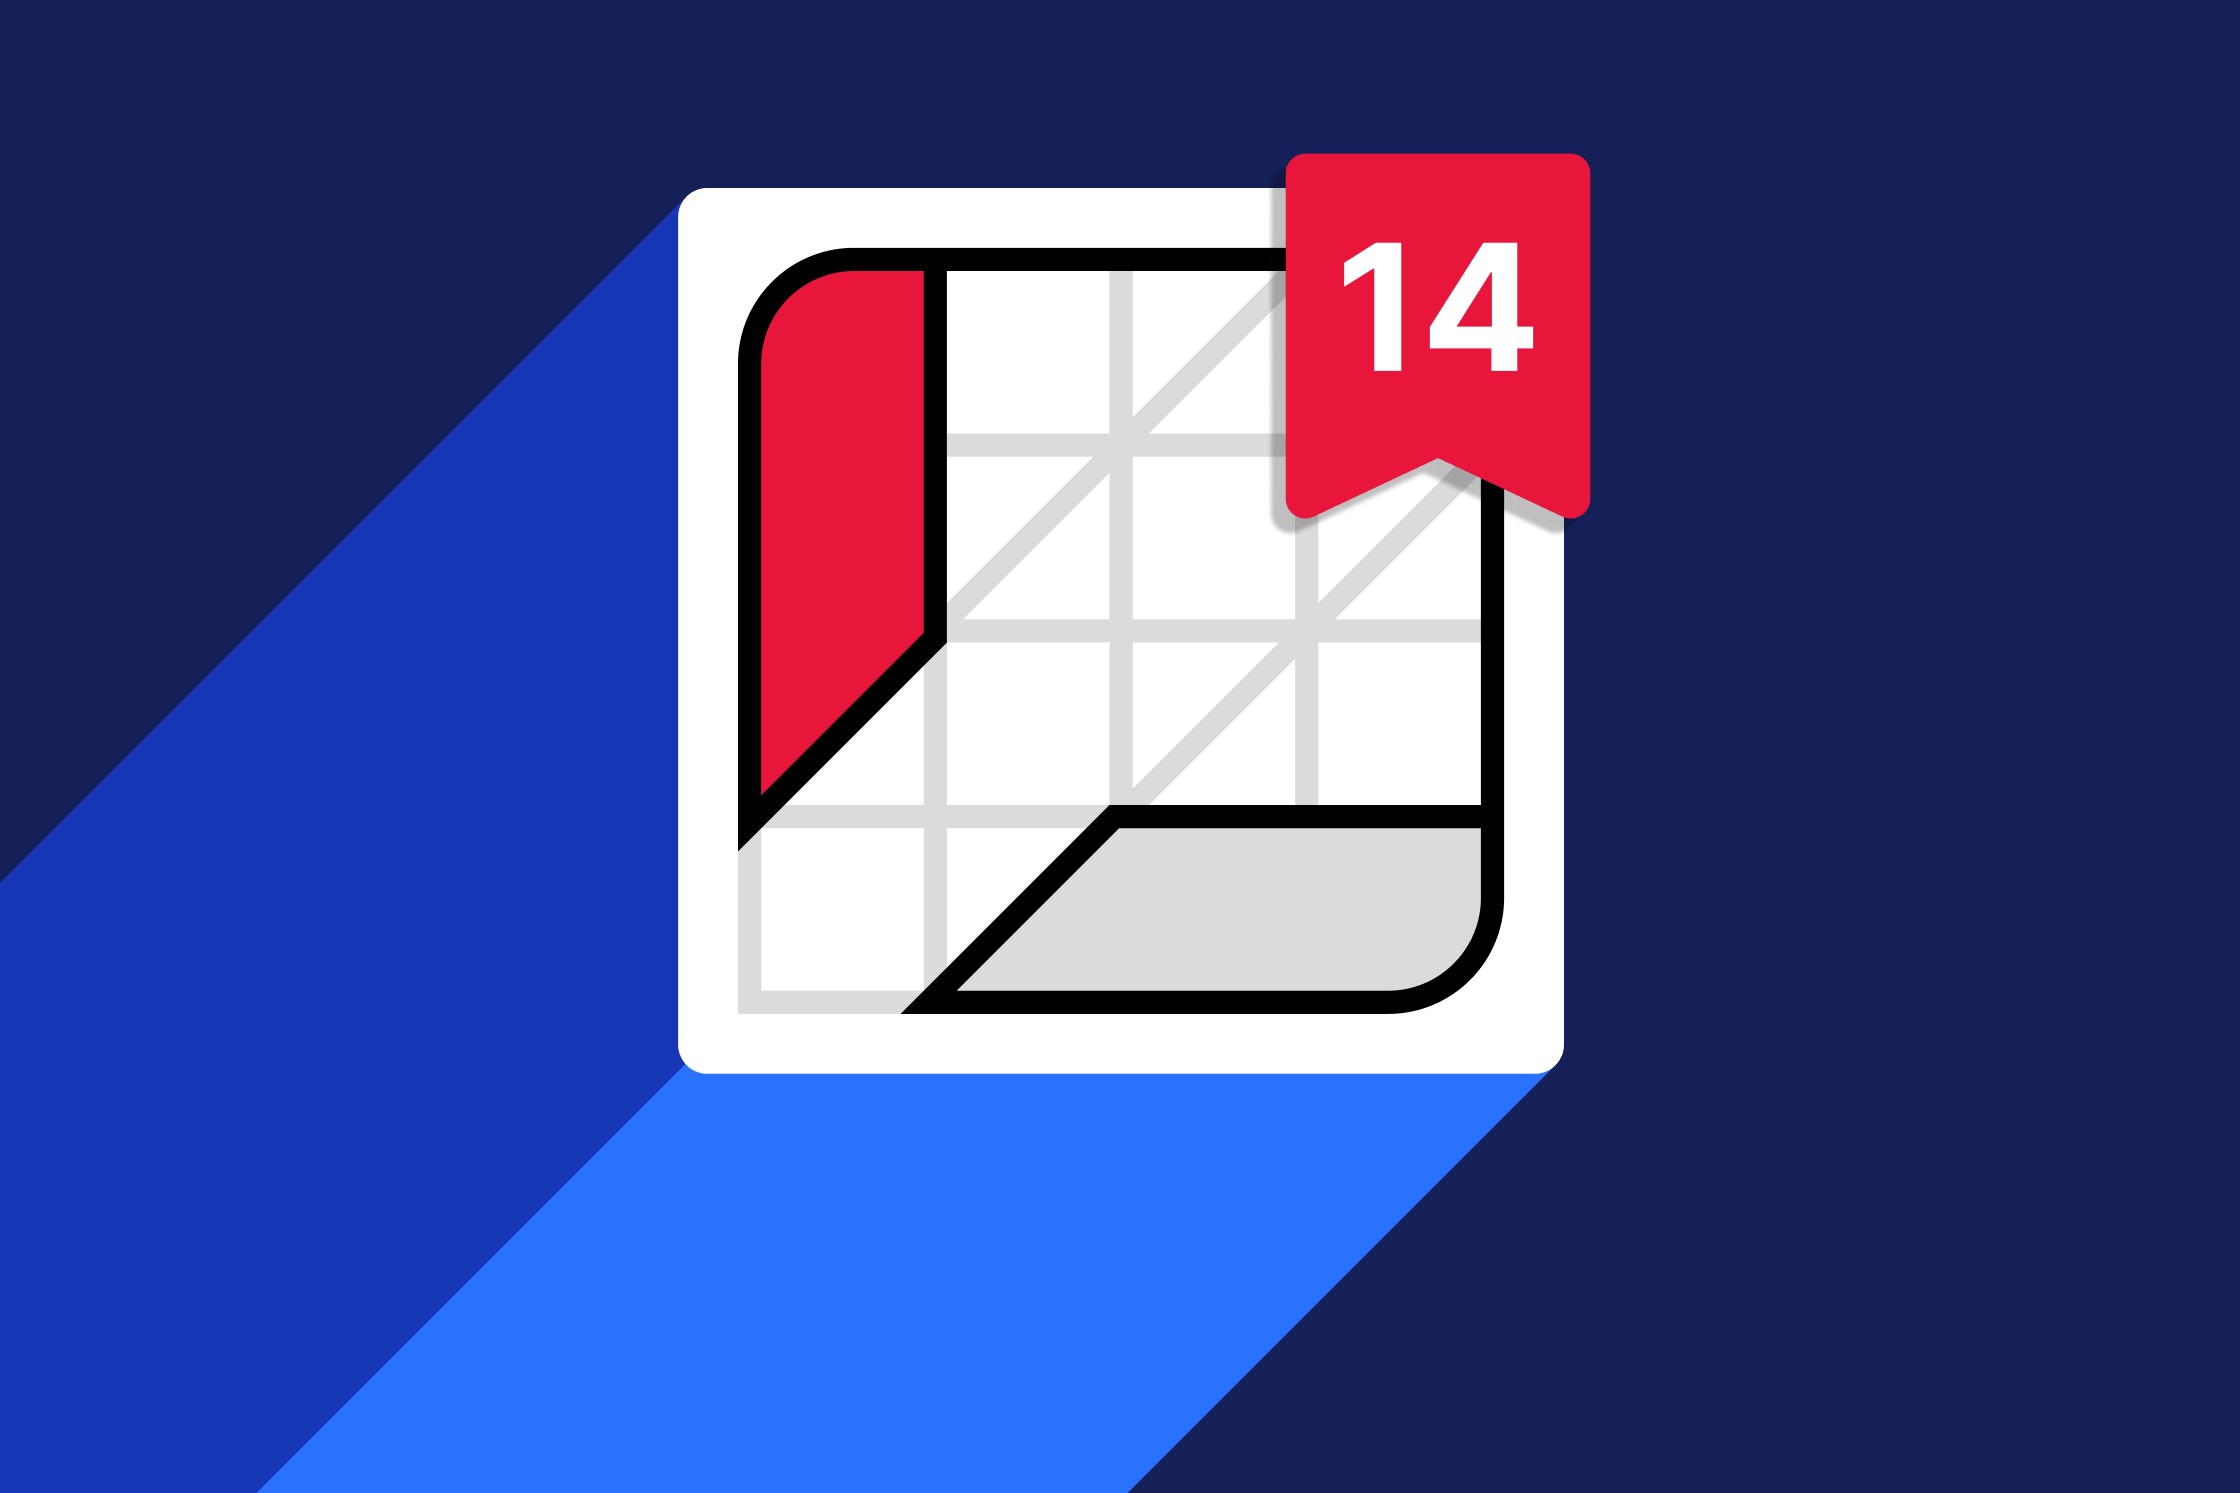
阅读关于推出 think-cell 14 的信息。这款产品是我们的旗舰 PowerPoint 生产力软件 think-cell Suite 的新版本,它引入了一系列强大的创新,为用户节省时间并提供更多功能,让他们可以更高效地完成 PowerPoint 工作流程。
2025年10月31日 - 阅读约 7 分钟
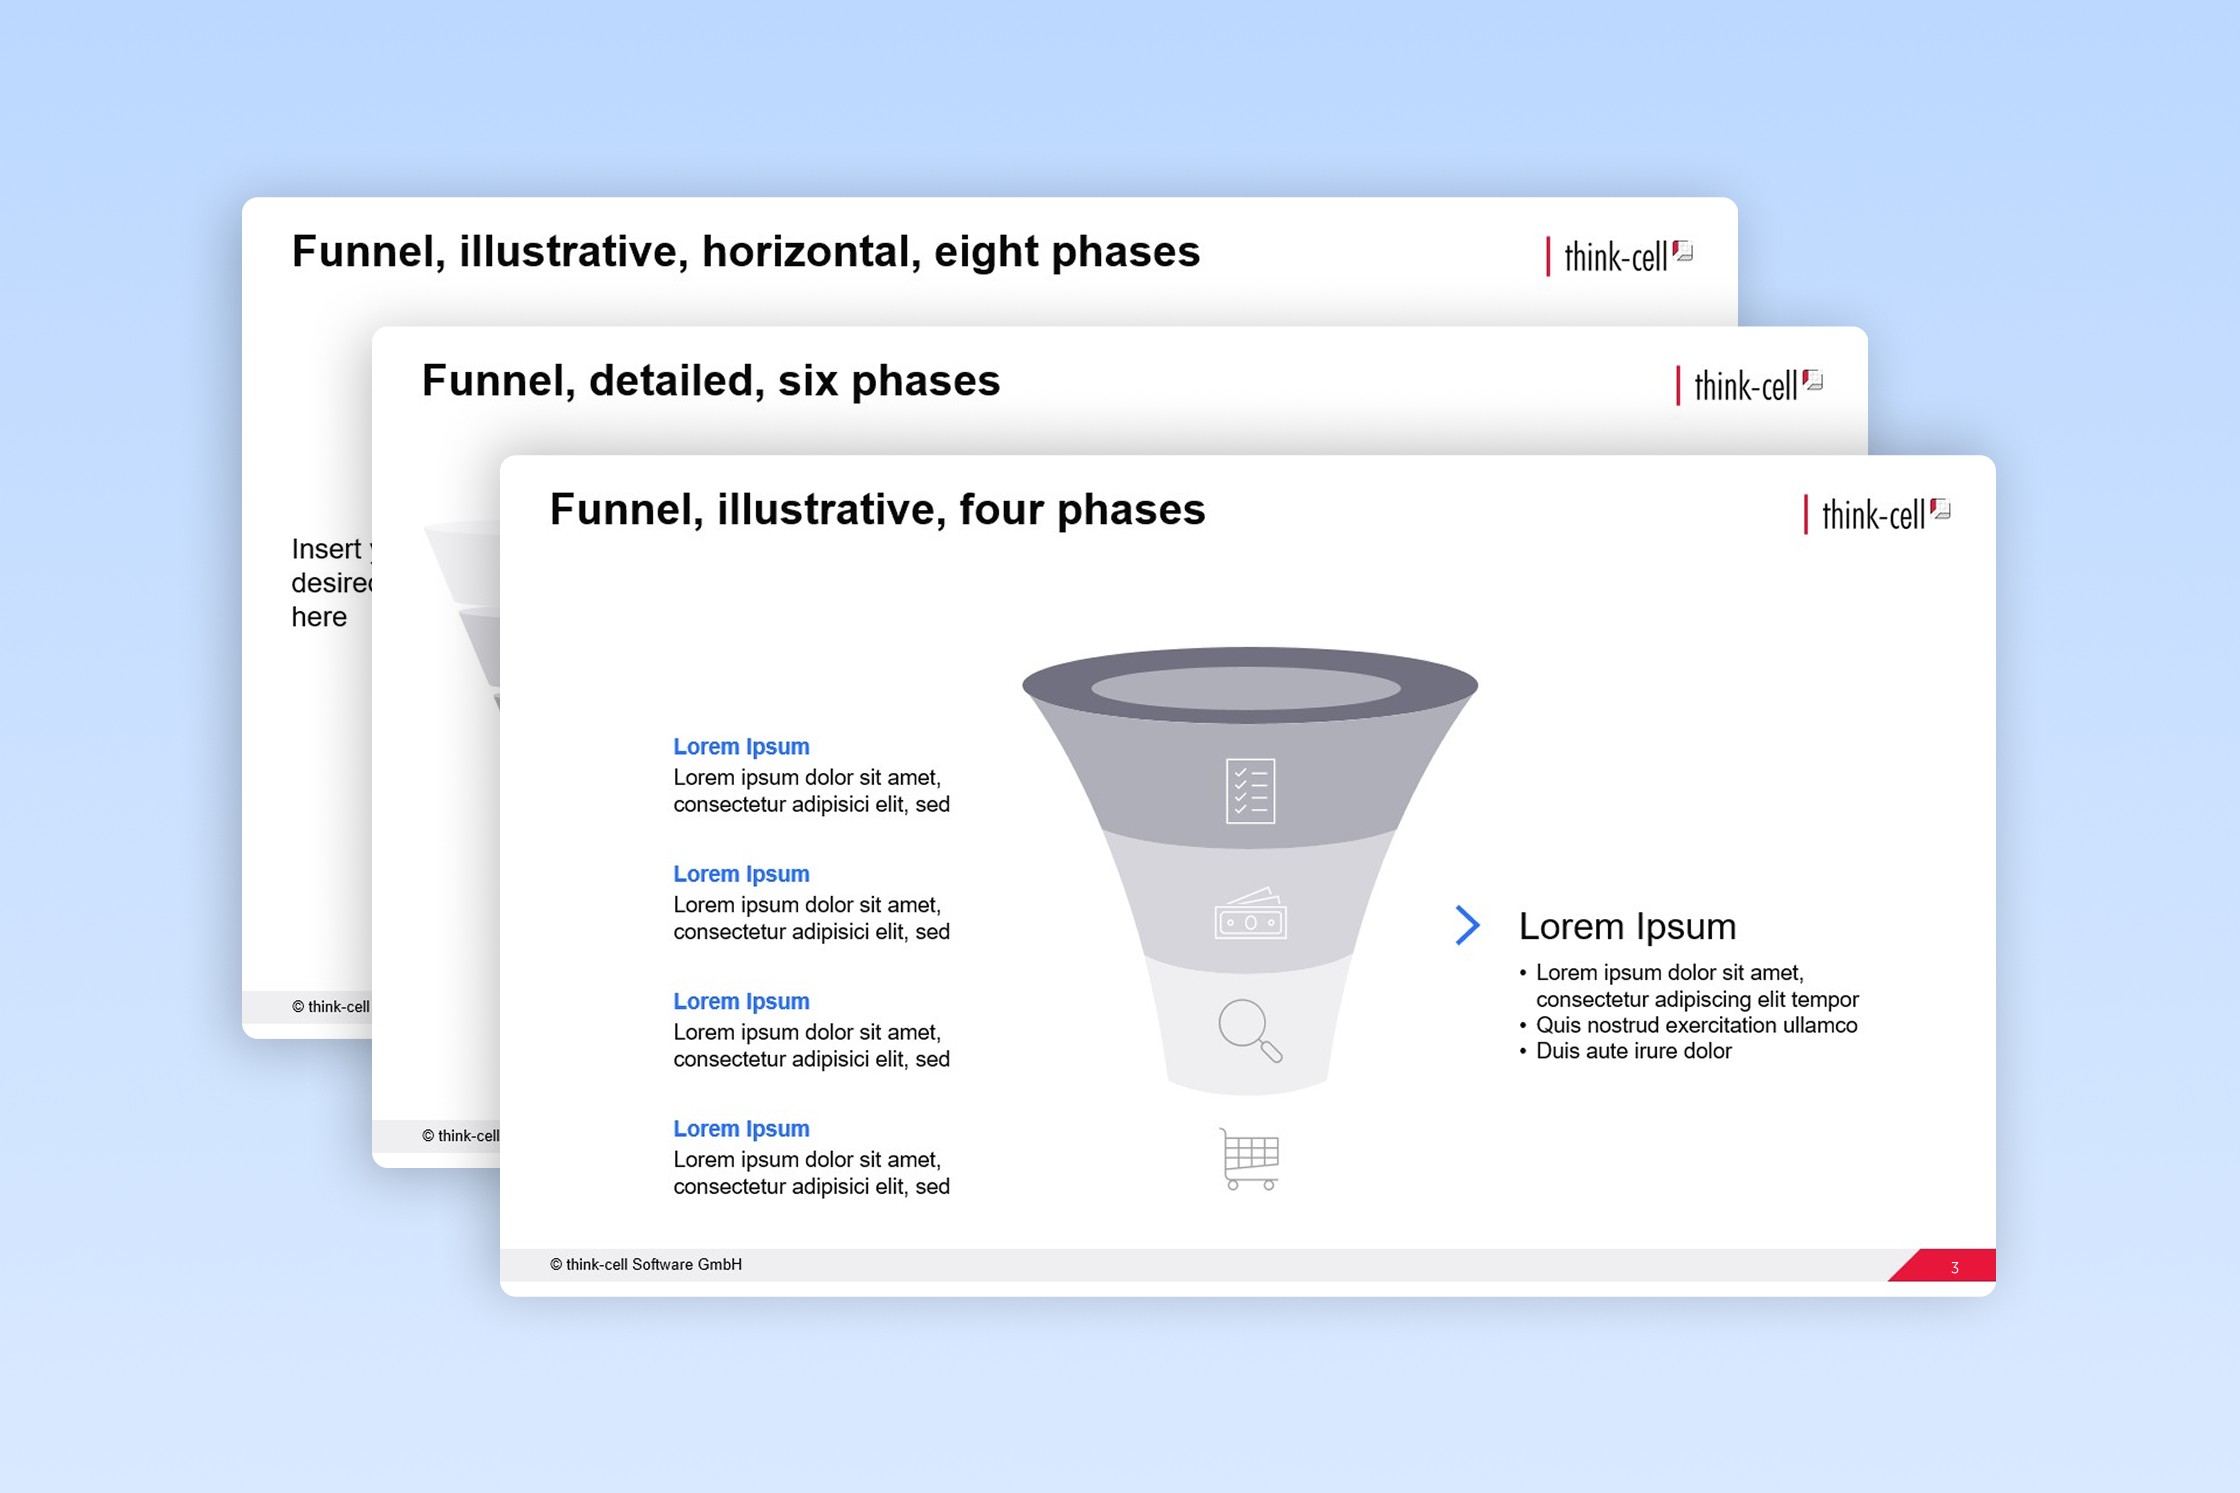
获取免费的 PowerPoint 漏斗图模板,让您可以轻松编辑商业演示文稿。
2025年10月14日 - 阅读约 7 分钟
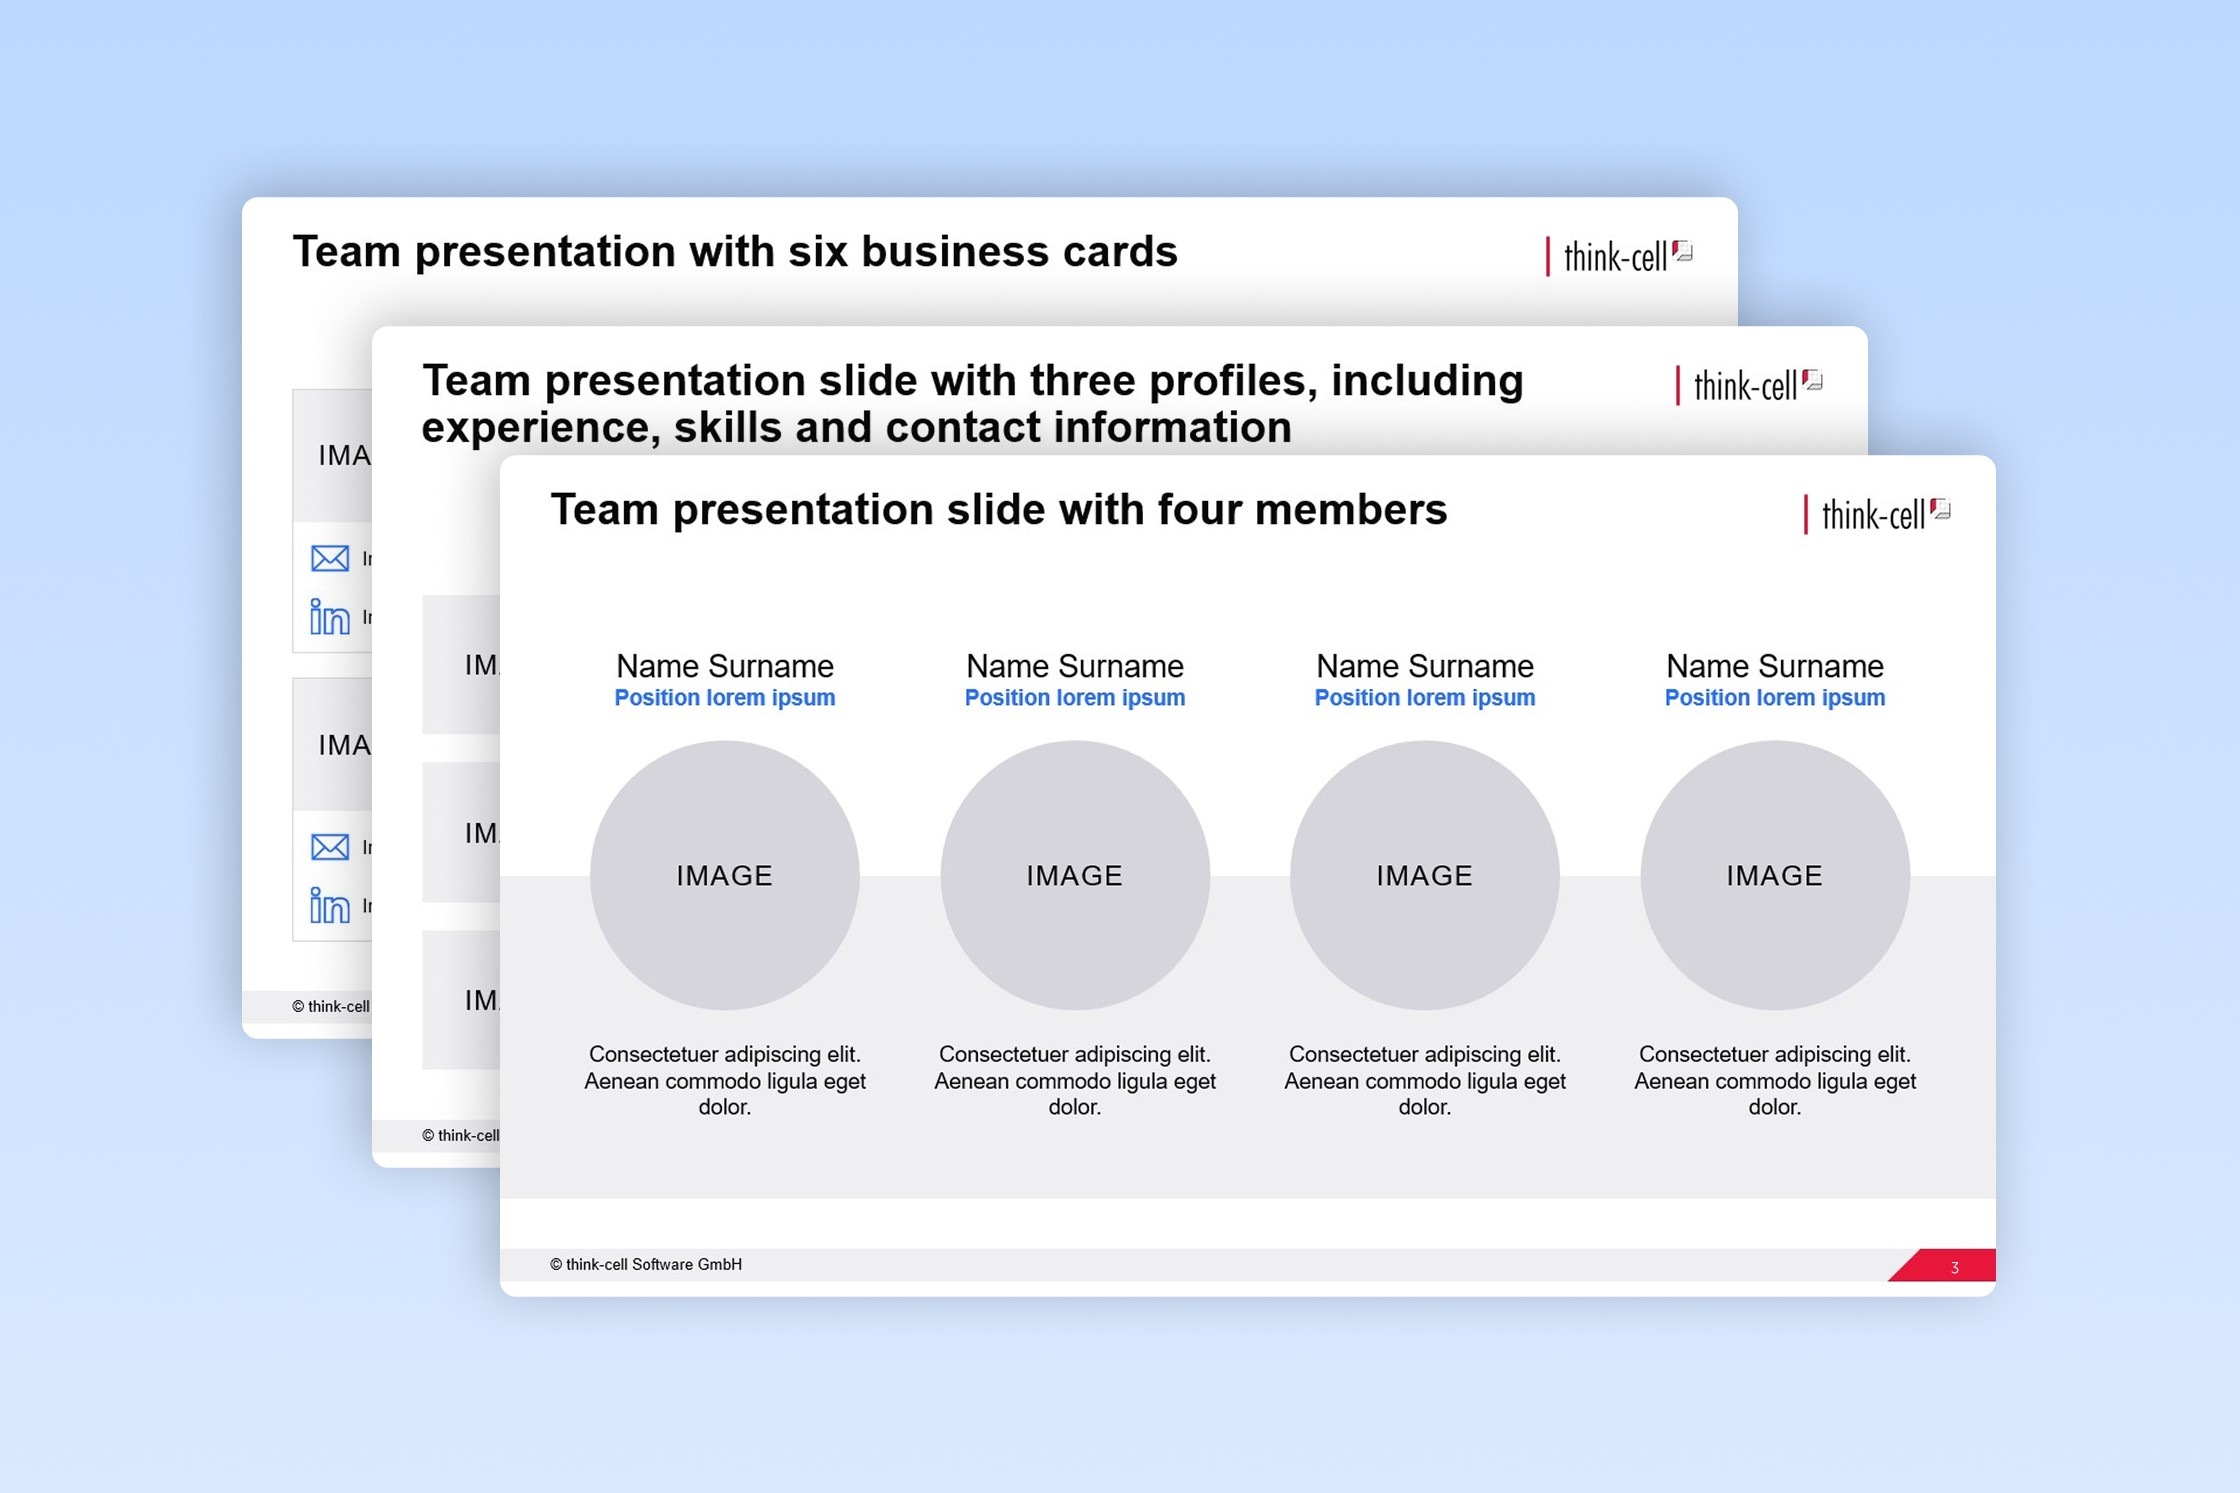
获取免费的 PowerPoint 团队演示文稿模板,让您可以轻松编辑商业演示文稿。
2025年10月13日 - 阅读约 7 分钟
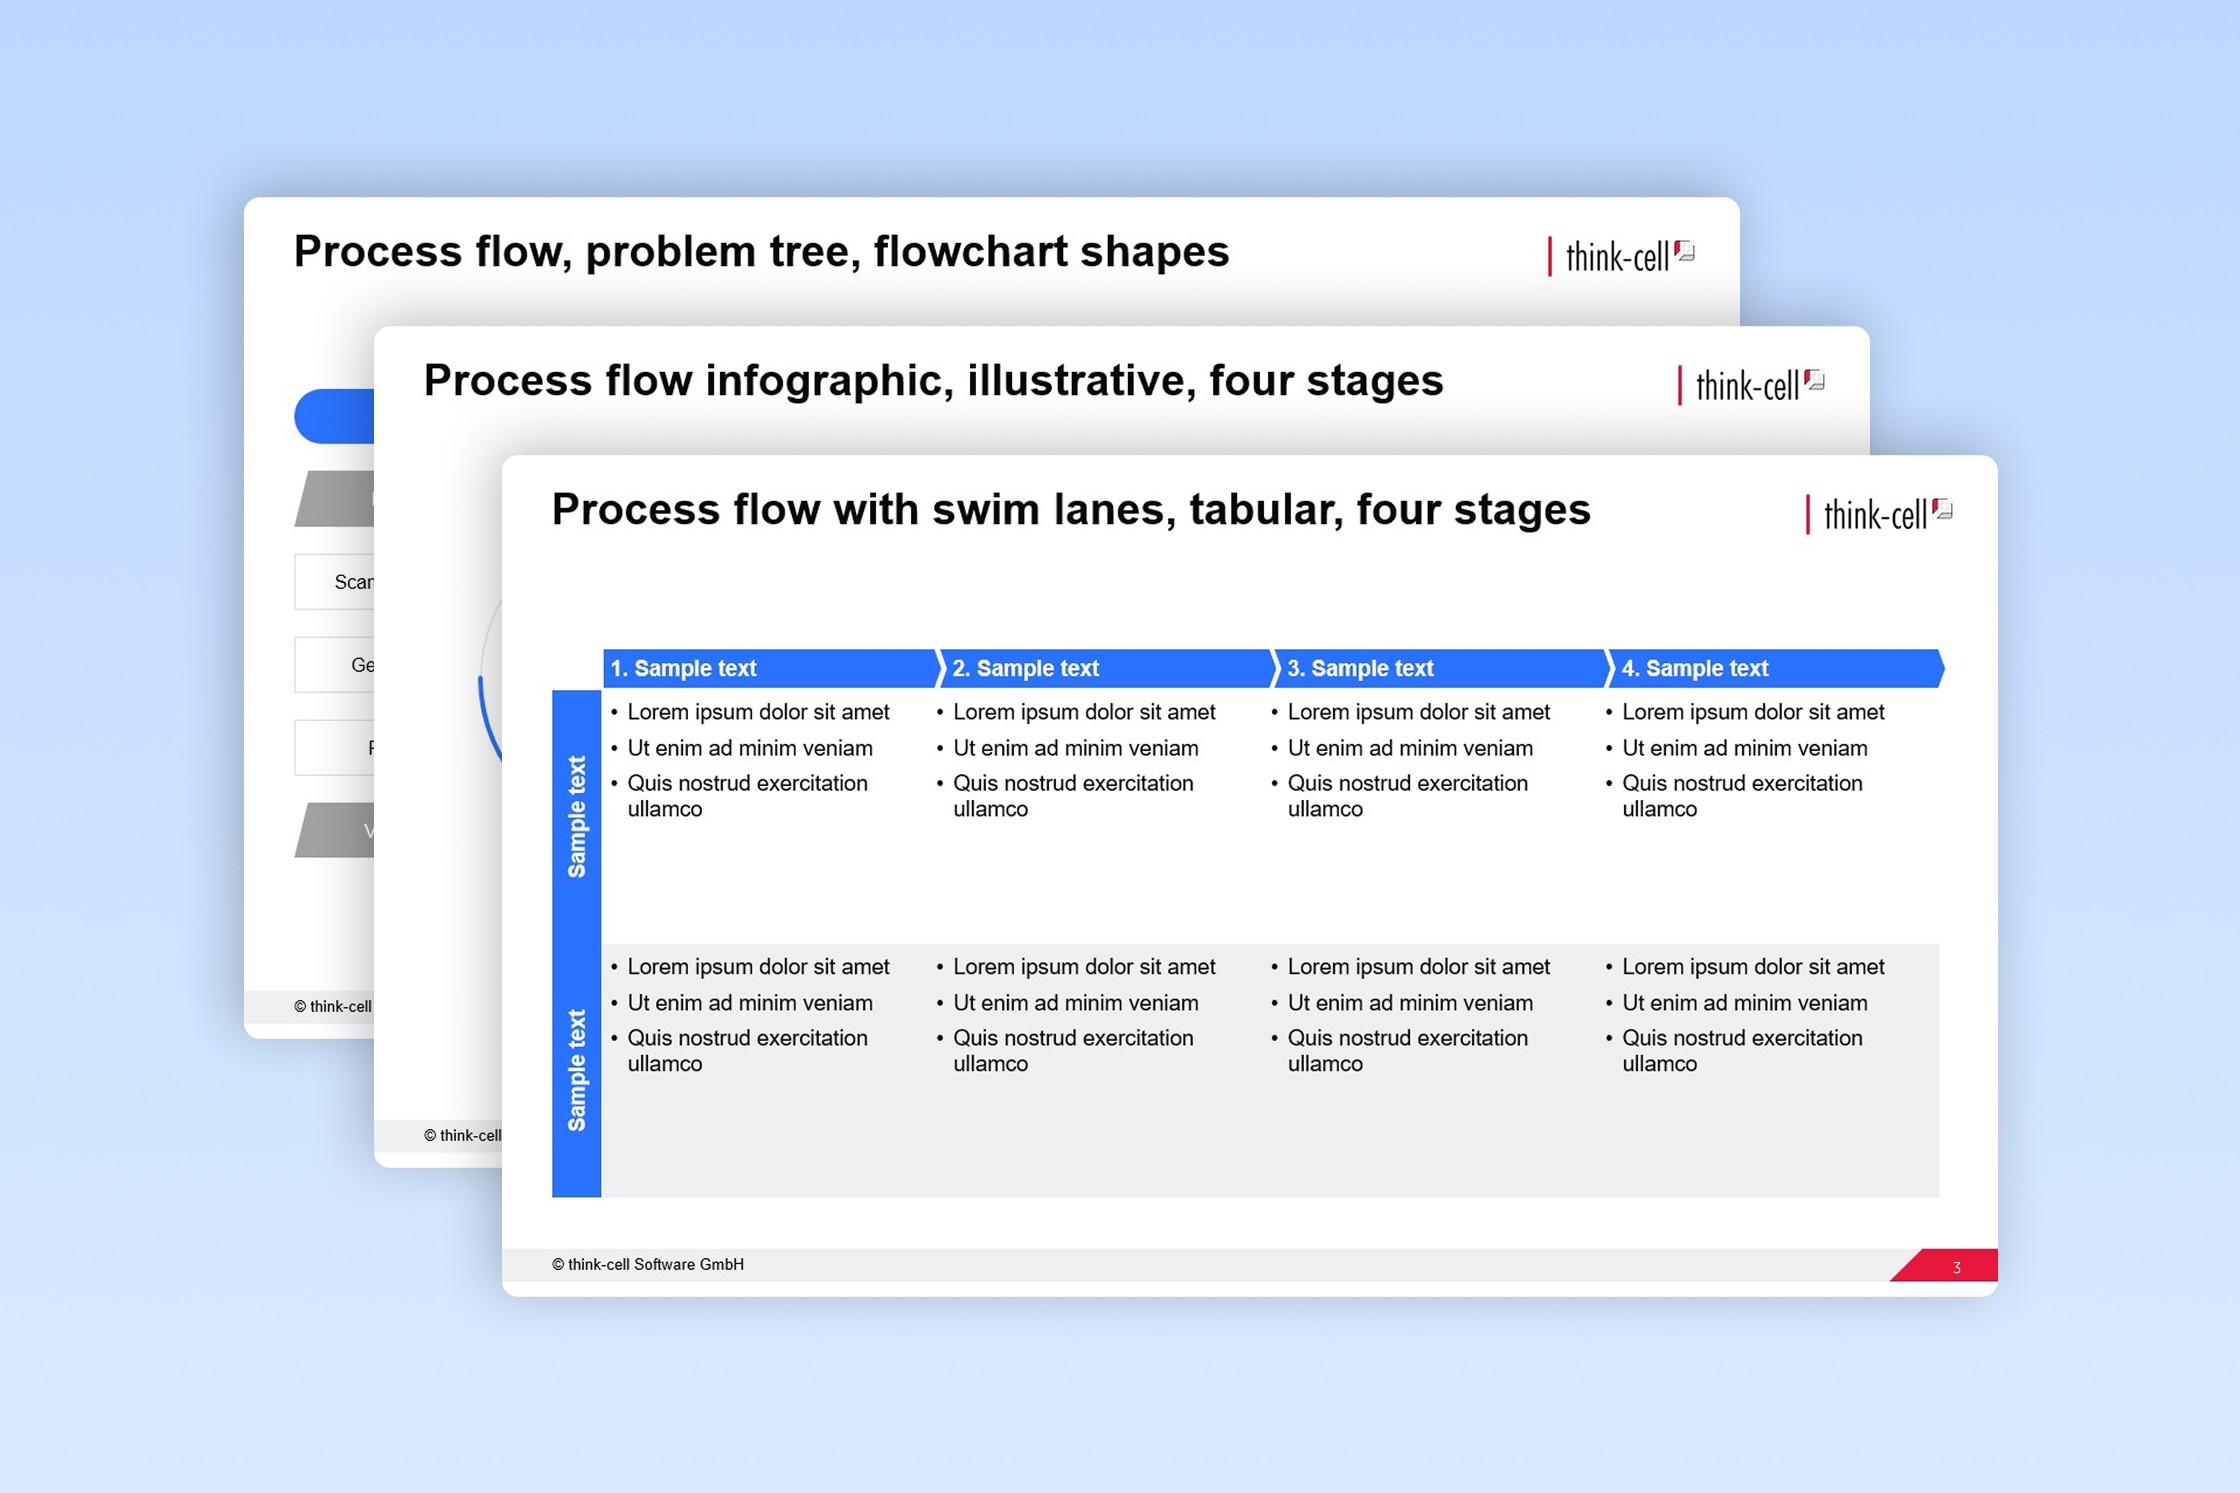
获取免费的 PowerPoint 流程图模板,让您可以轻松编辑商业演示文稿。
2025年10月10日 - 阅读约 7 分钟
我们向您介绍创建帕累托图的过程——从构建数据到格式化和微调专业的数据可视化效果。
2025年8月5日 - 阅读约 10 分钟
了解微软为何弃用 PowerPoint 的“重用幻灯片”功能,以及如何轻松查找和重用现有演示文稿中的幻灯片。
2025年7月31日 - 阅读约 9 分钟
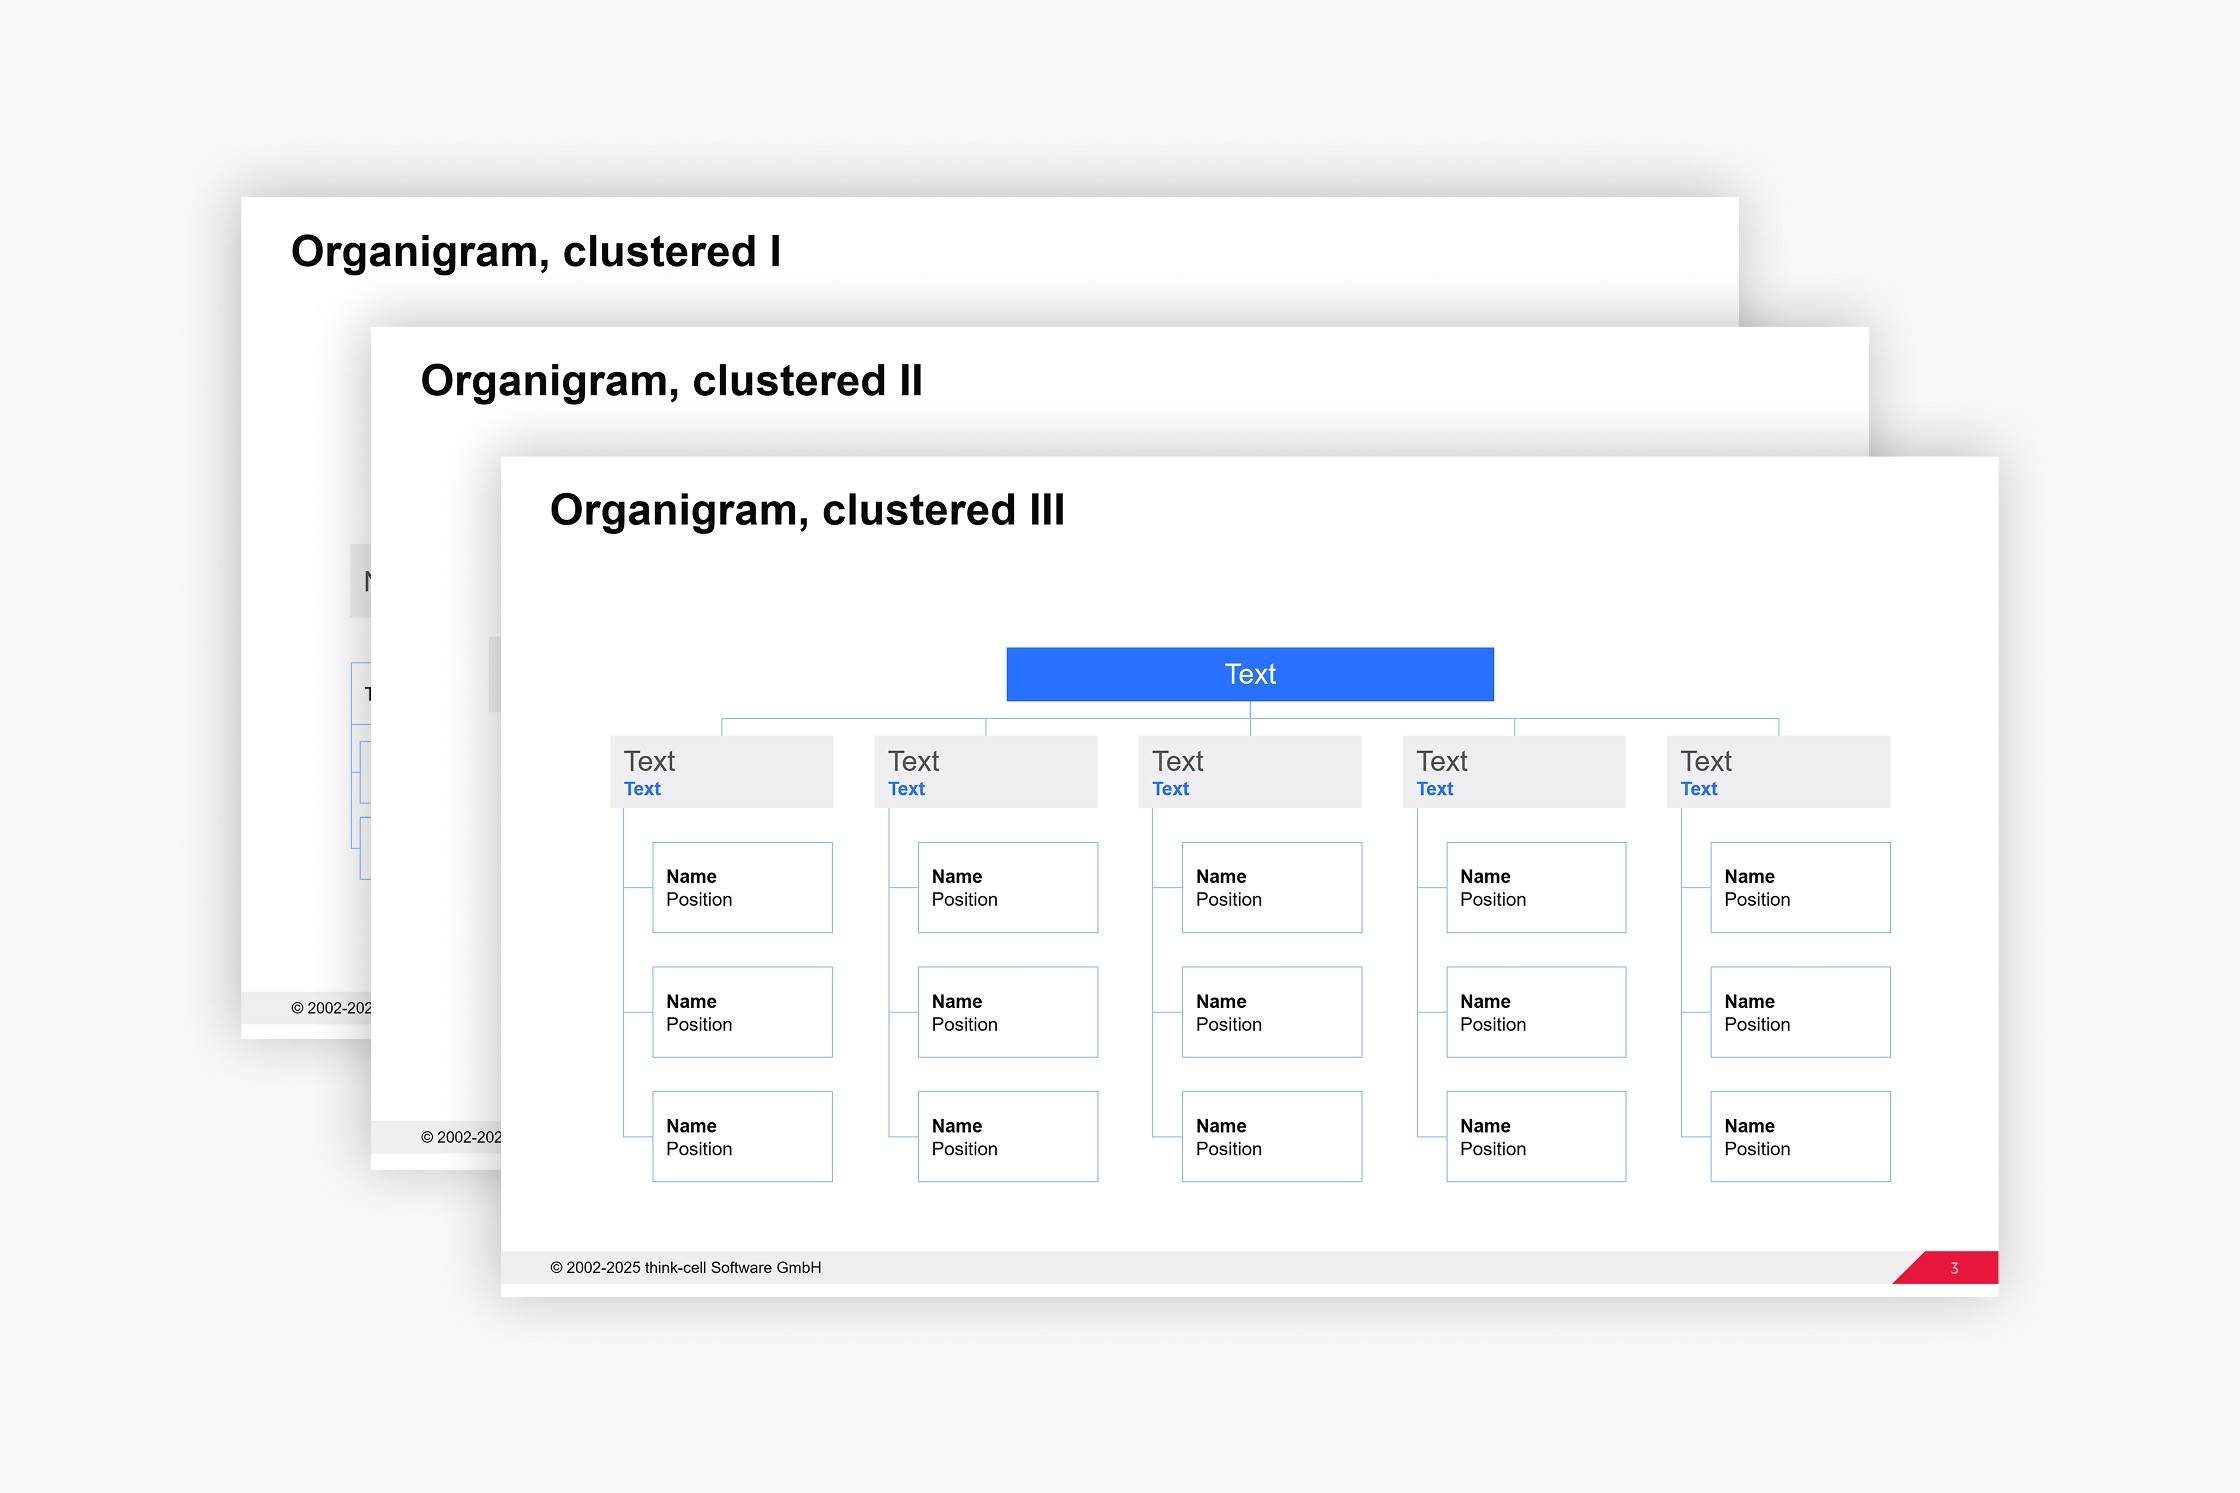
获取免费的 PowerPoint 组织架构图模板,让您可以轻松编辑商业演示文稿。
2025年7月23日 - 阅读约 6 分钟
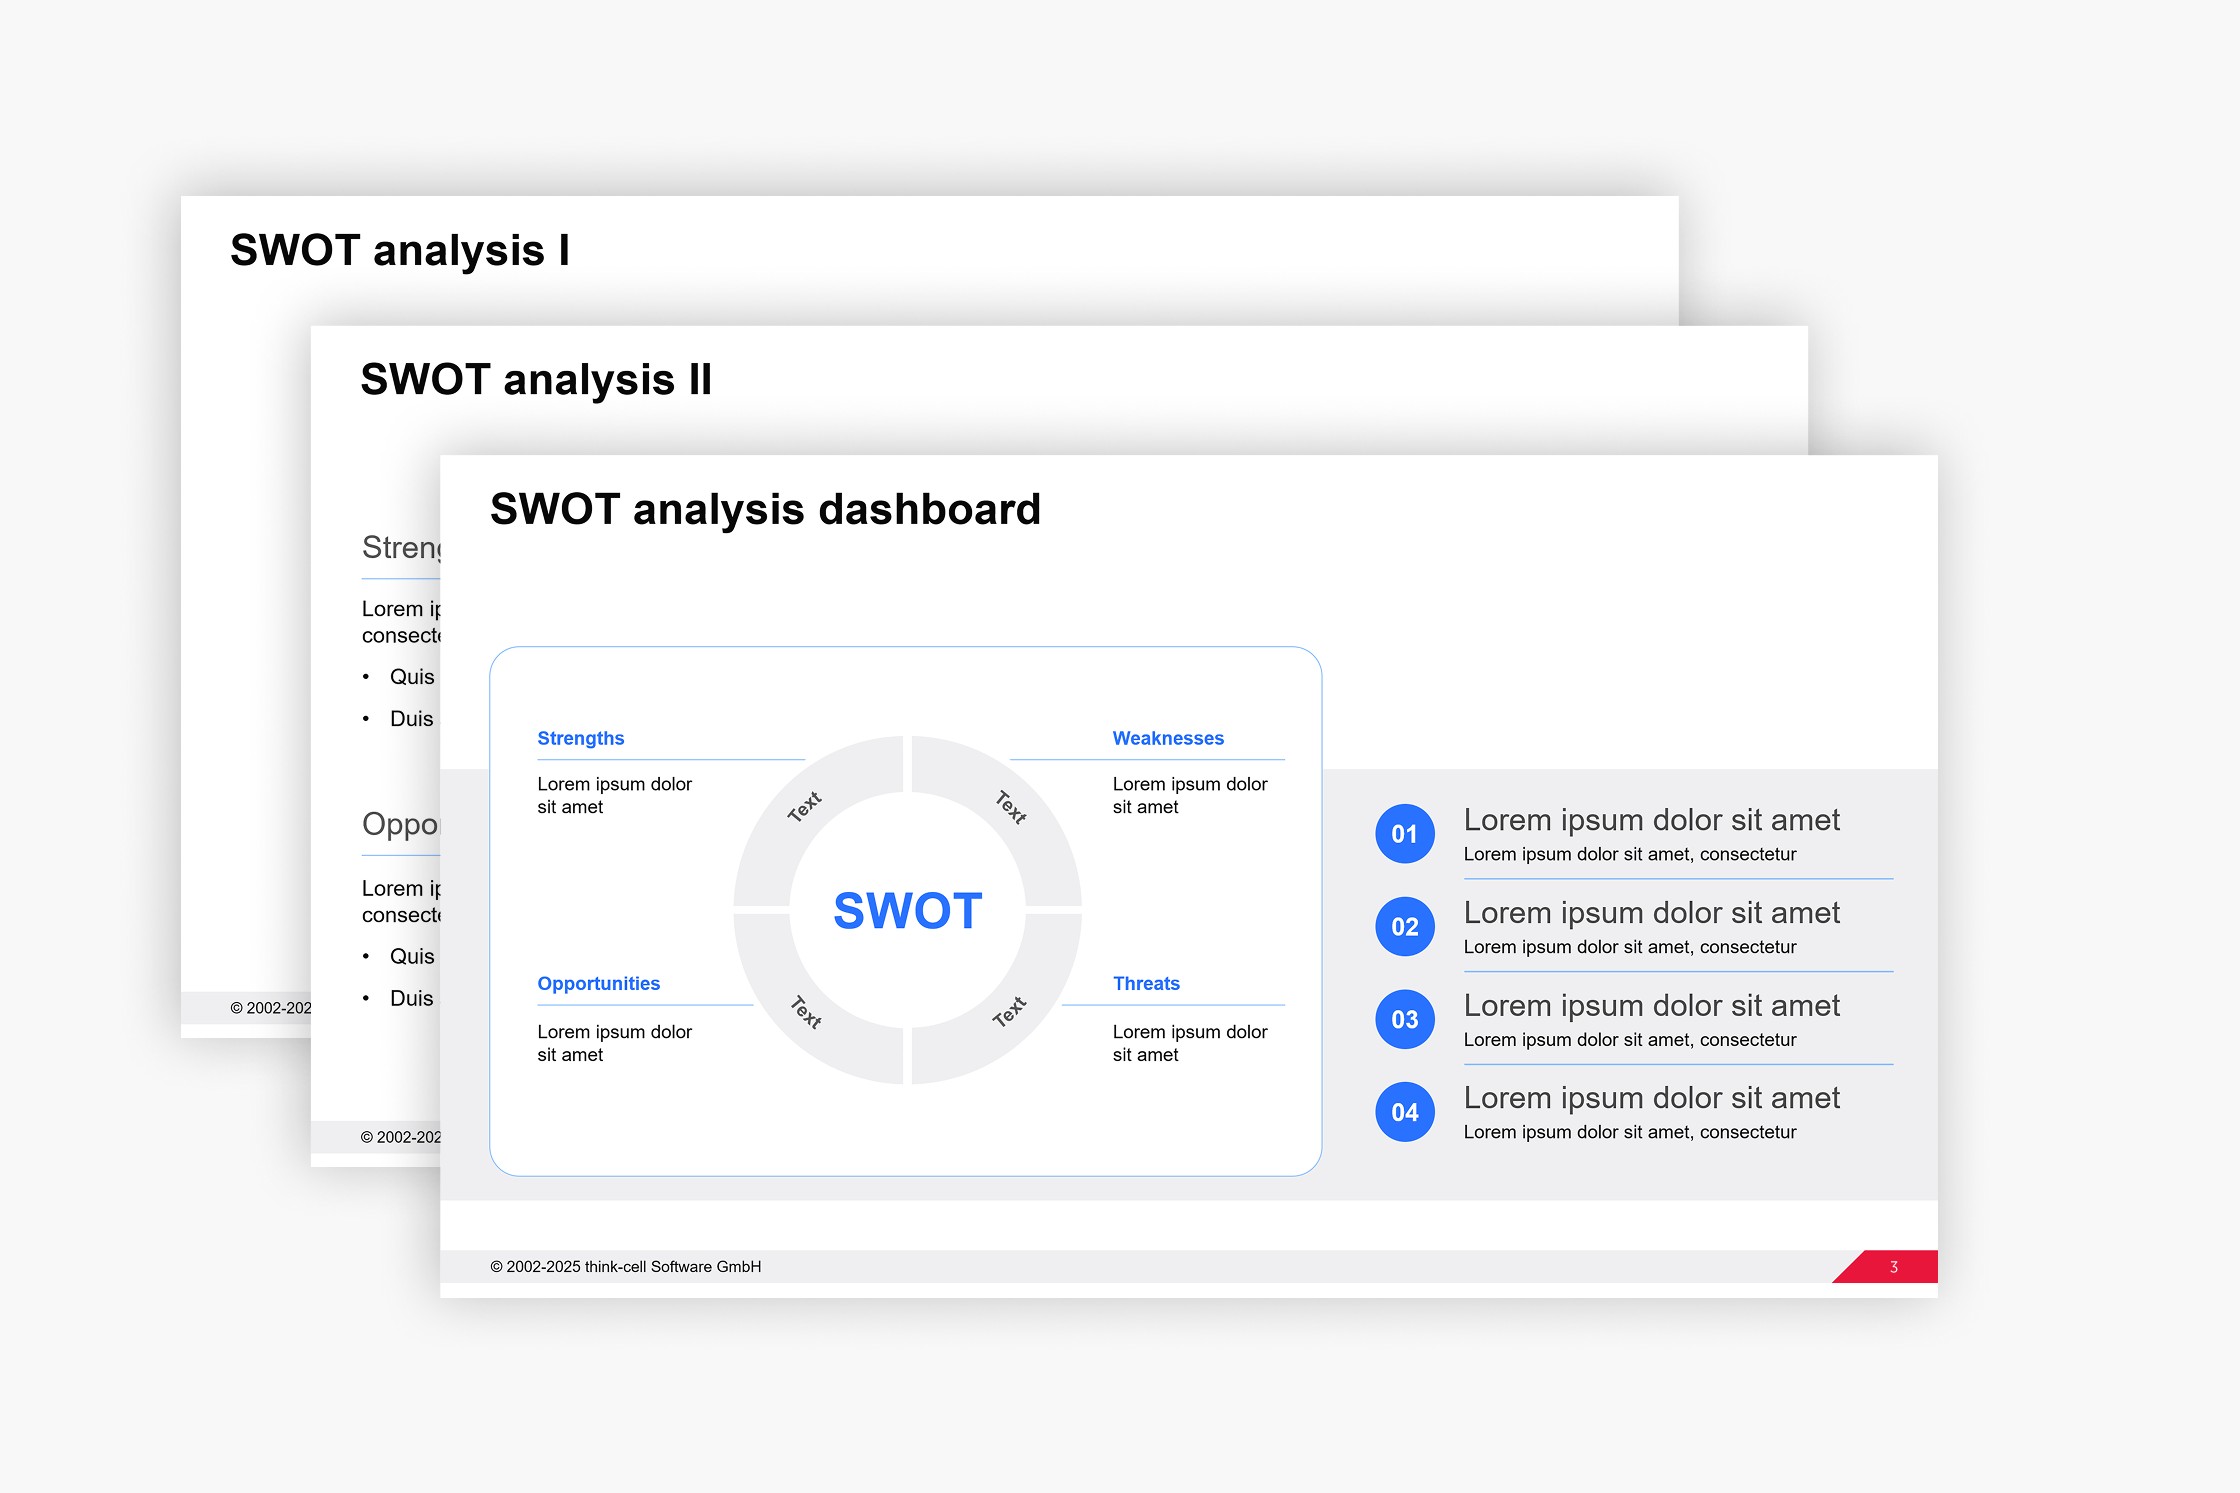
获取免费的 PowerPoint SWOT 分析模板,让您可以轻松编辑商业演示文稿。
2025年7月22日 - 阅读约 7 分钟
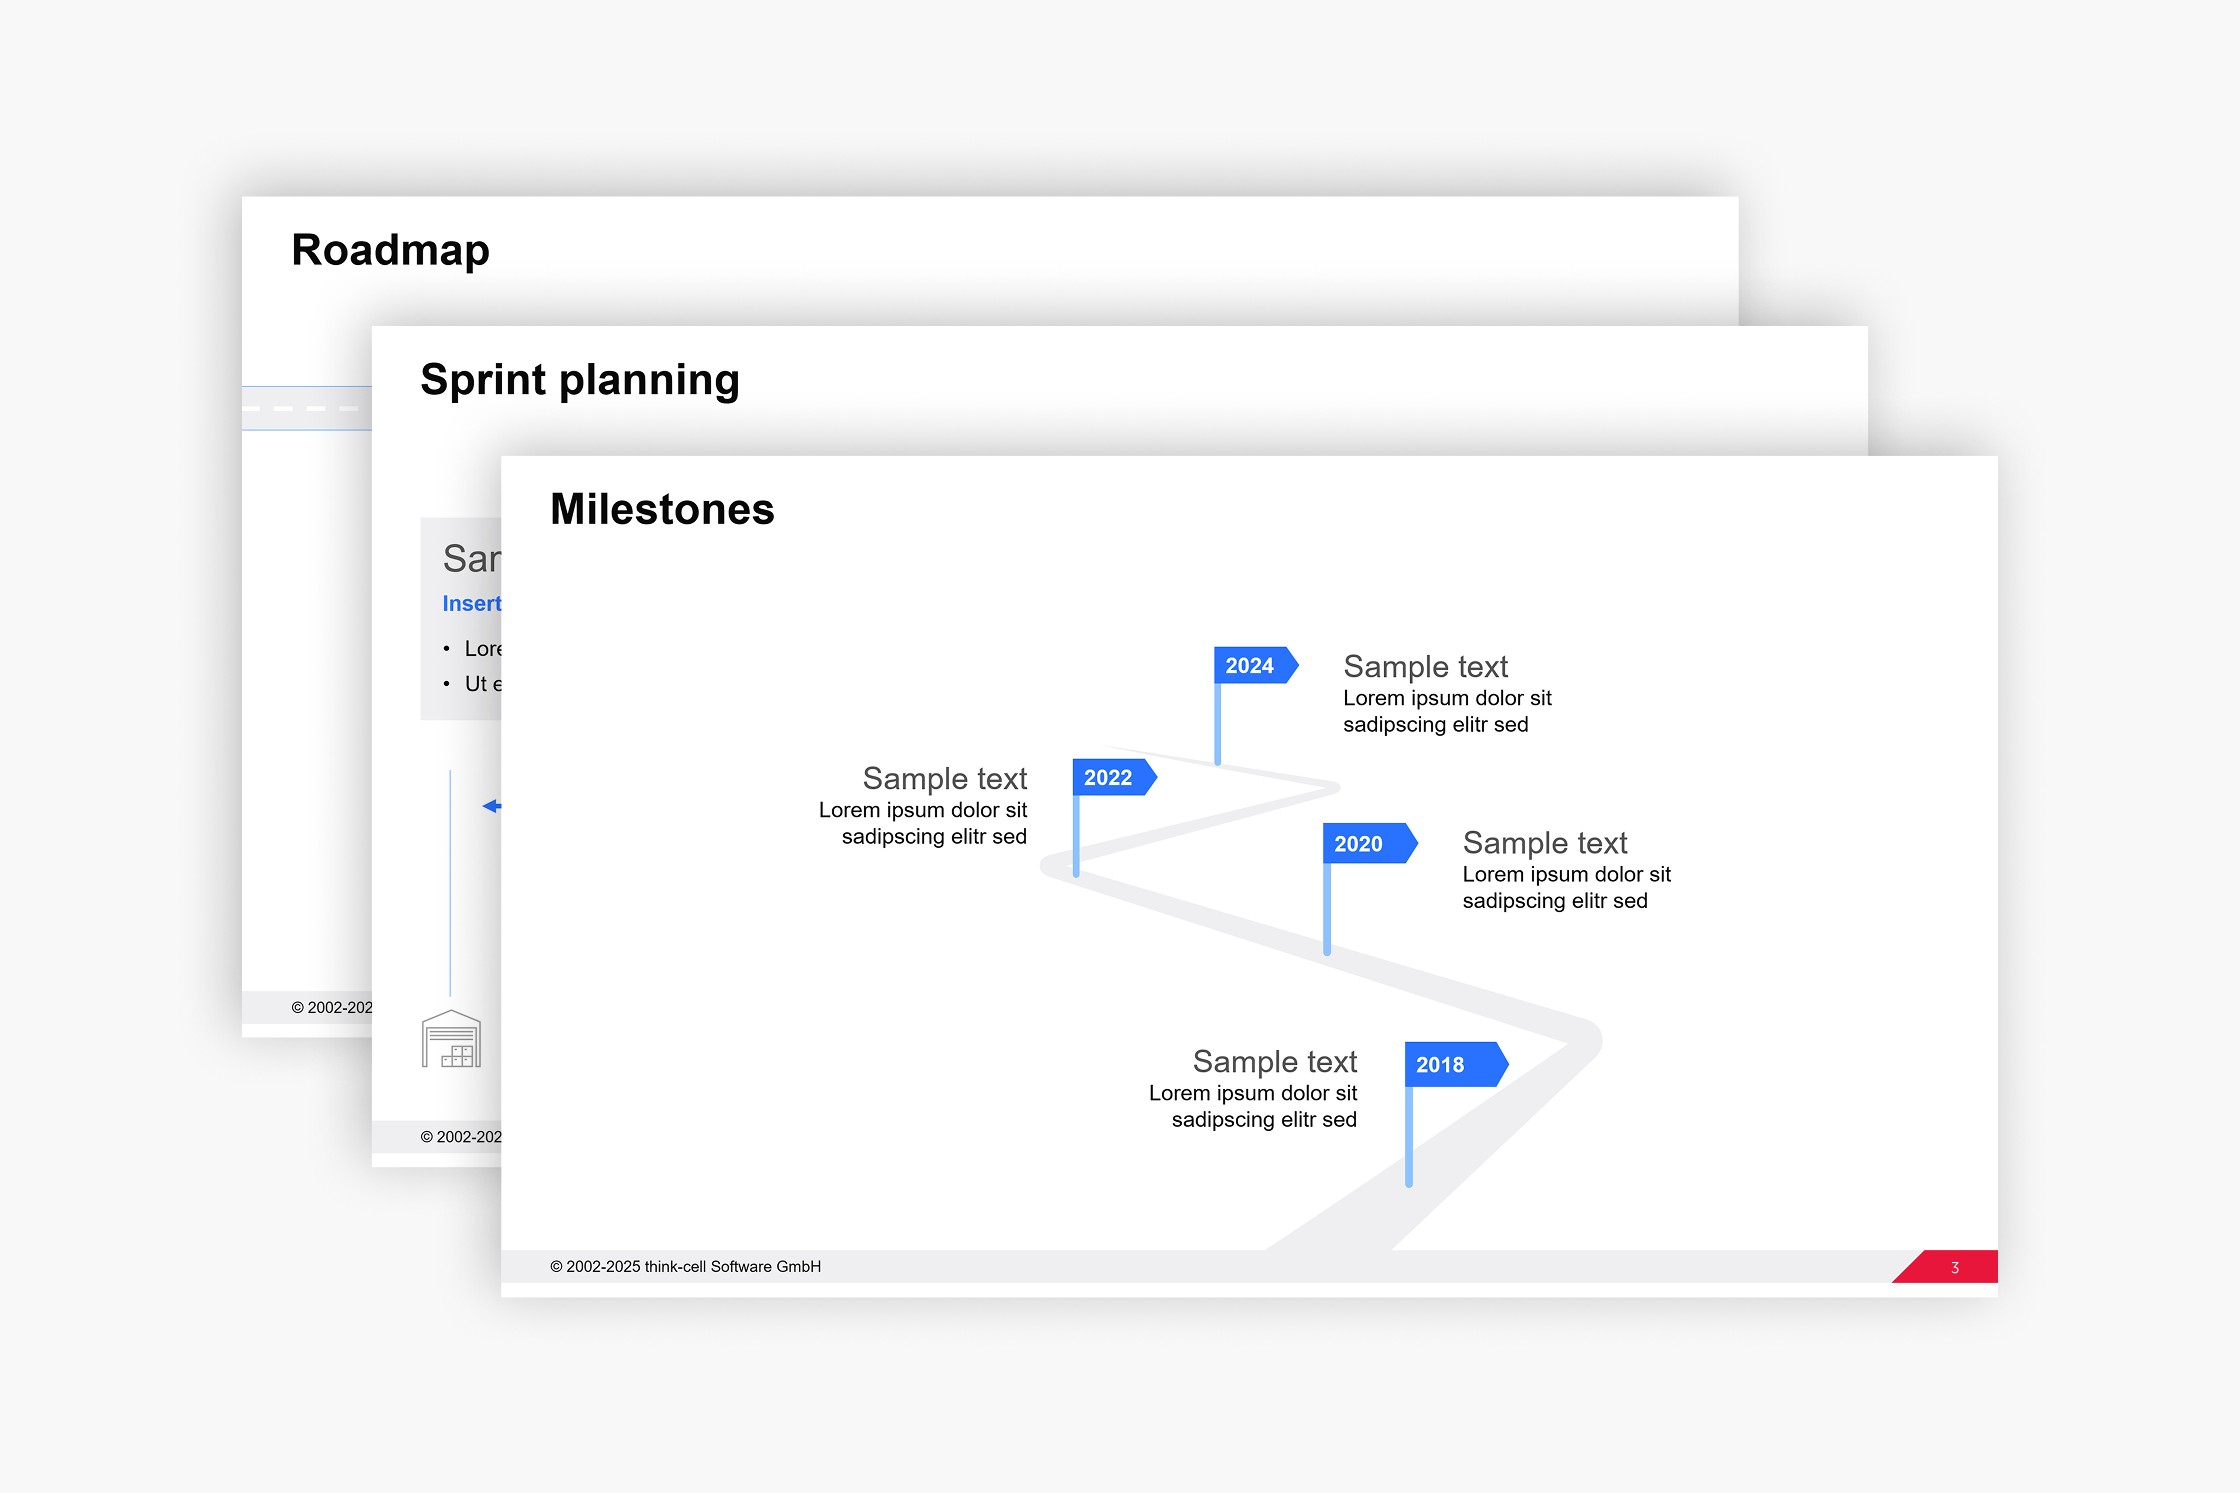
获取免费的 PowerPoint 路线图模板,让您可以轻松编辑商业演示文稿。
2025年7月21日 - 阅读约 7 分钟

了解在 PowerPoint 演示文稿中何时应使用饼图、何时应避免使用。提供关于扇区数量限制、标注方式以及常见错误的实用指导。
2025年7月4日 - 阅读约 31 分钟
看看 think-cell.com 有哪些变化!think-cell 网站全新改版,带来了新的配色方案、更优化的导航结构,以及更清晰的产品信息传达。
2025年7月3日 - 阅读约 8 分钟

think-cell 已任命 Adam Conlon 为首席财务官兼首席运营官,自 2025 年 7 月起生效。
2025年6月30日 - 阅读约 3 分钟
通过具体的示例来了解如何让商业演示文稿脱颖而出,并了解应避免的常见 PowerPoint 错误。
2025年5月28日 - 阅读约 31 分钟
了解如何将 Excel 数据透视表分析变成可插入到 PowerPoint 的专业图表,以便创建自动报告和富有见地的临时演示文稿。
2025年3月5日 - 阅读约 29 分钟
think-cell 自豪地宣布推出 think-cell Suite,这是一款扩展的产品,它不仅支持图表,还支持整个演示文稿创建过程。
2025年1月21日 - 阅读约 3 分钟
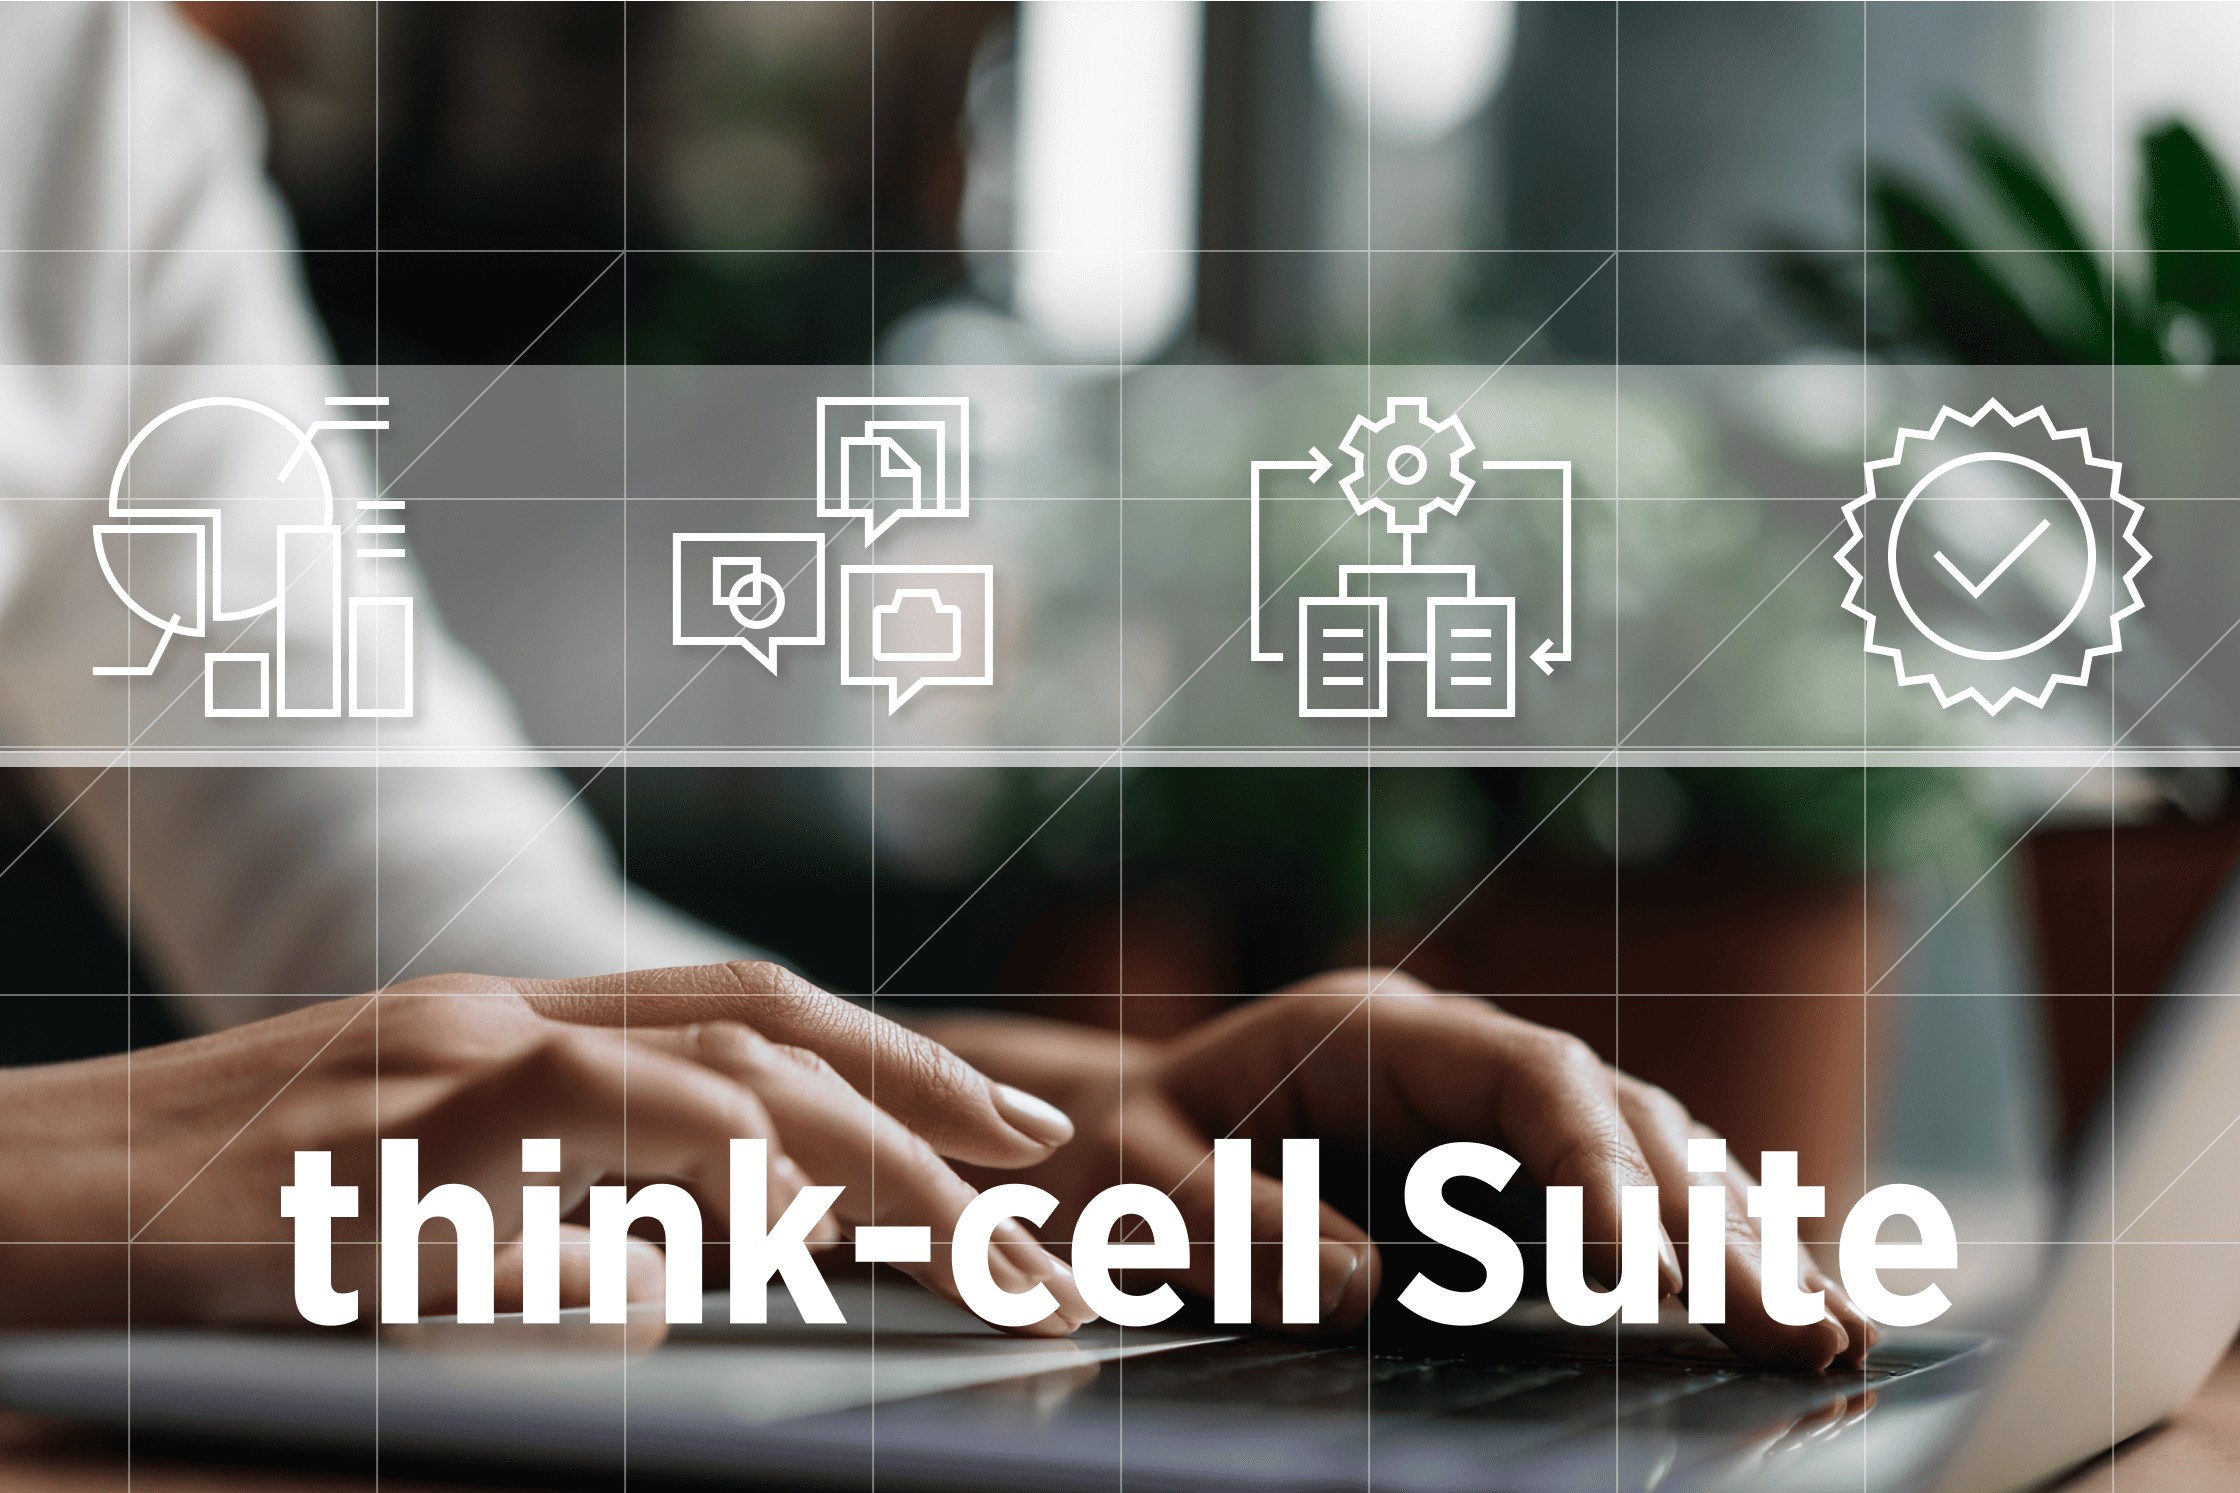
探索 think-cell Suite 及其全面的 PowerPoint 和 Excel 工具,在演示文稿制作过程的每个阶段为您提供支持。
2025年1月21日 - 阅读约 8 分钟

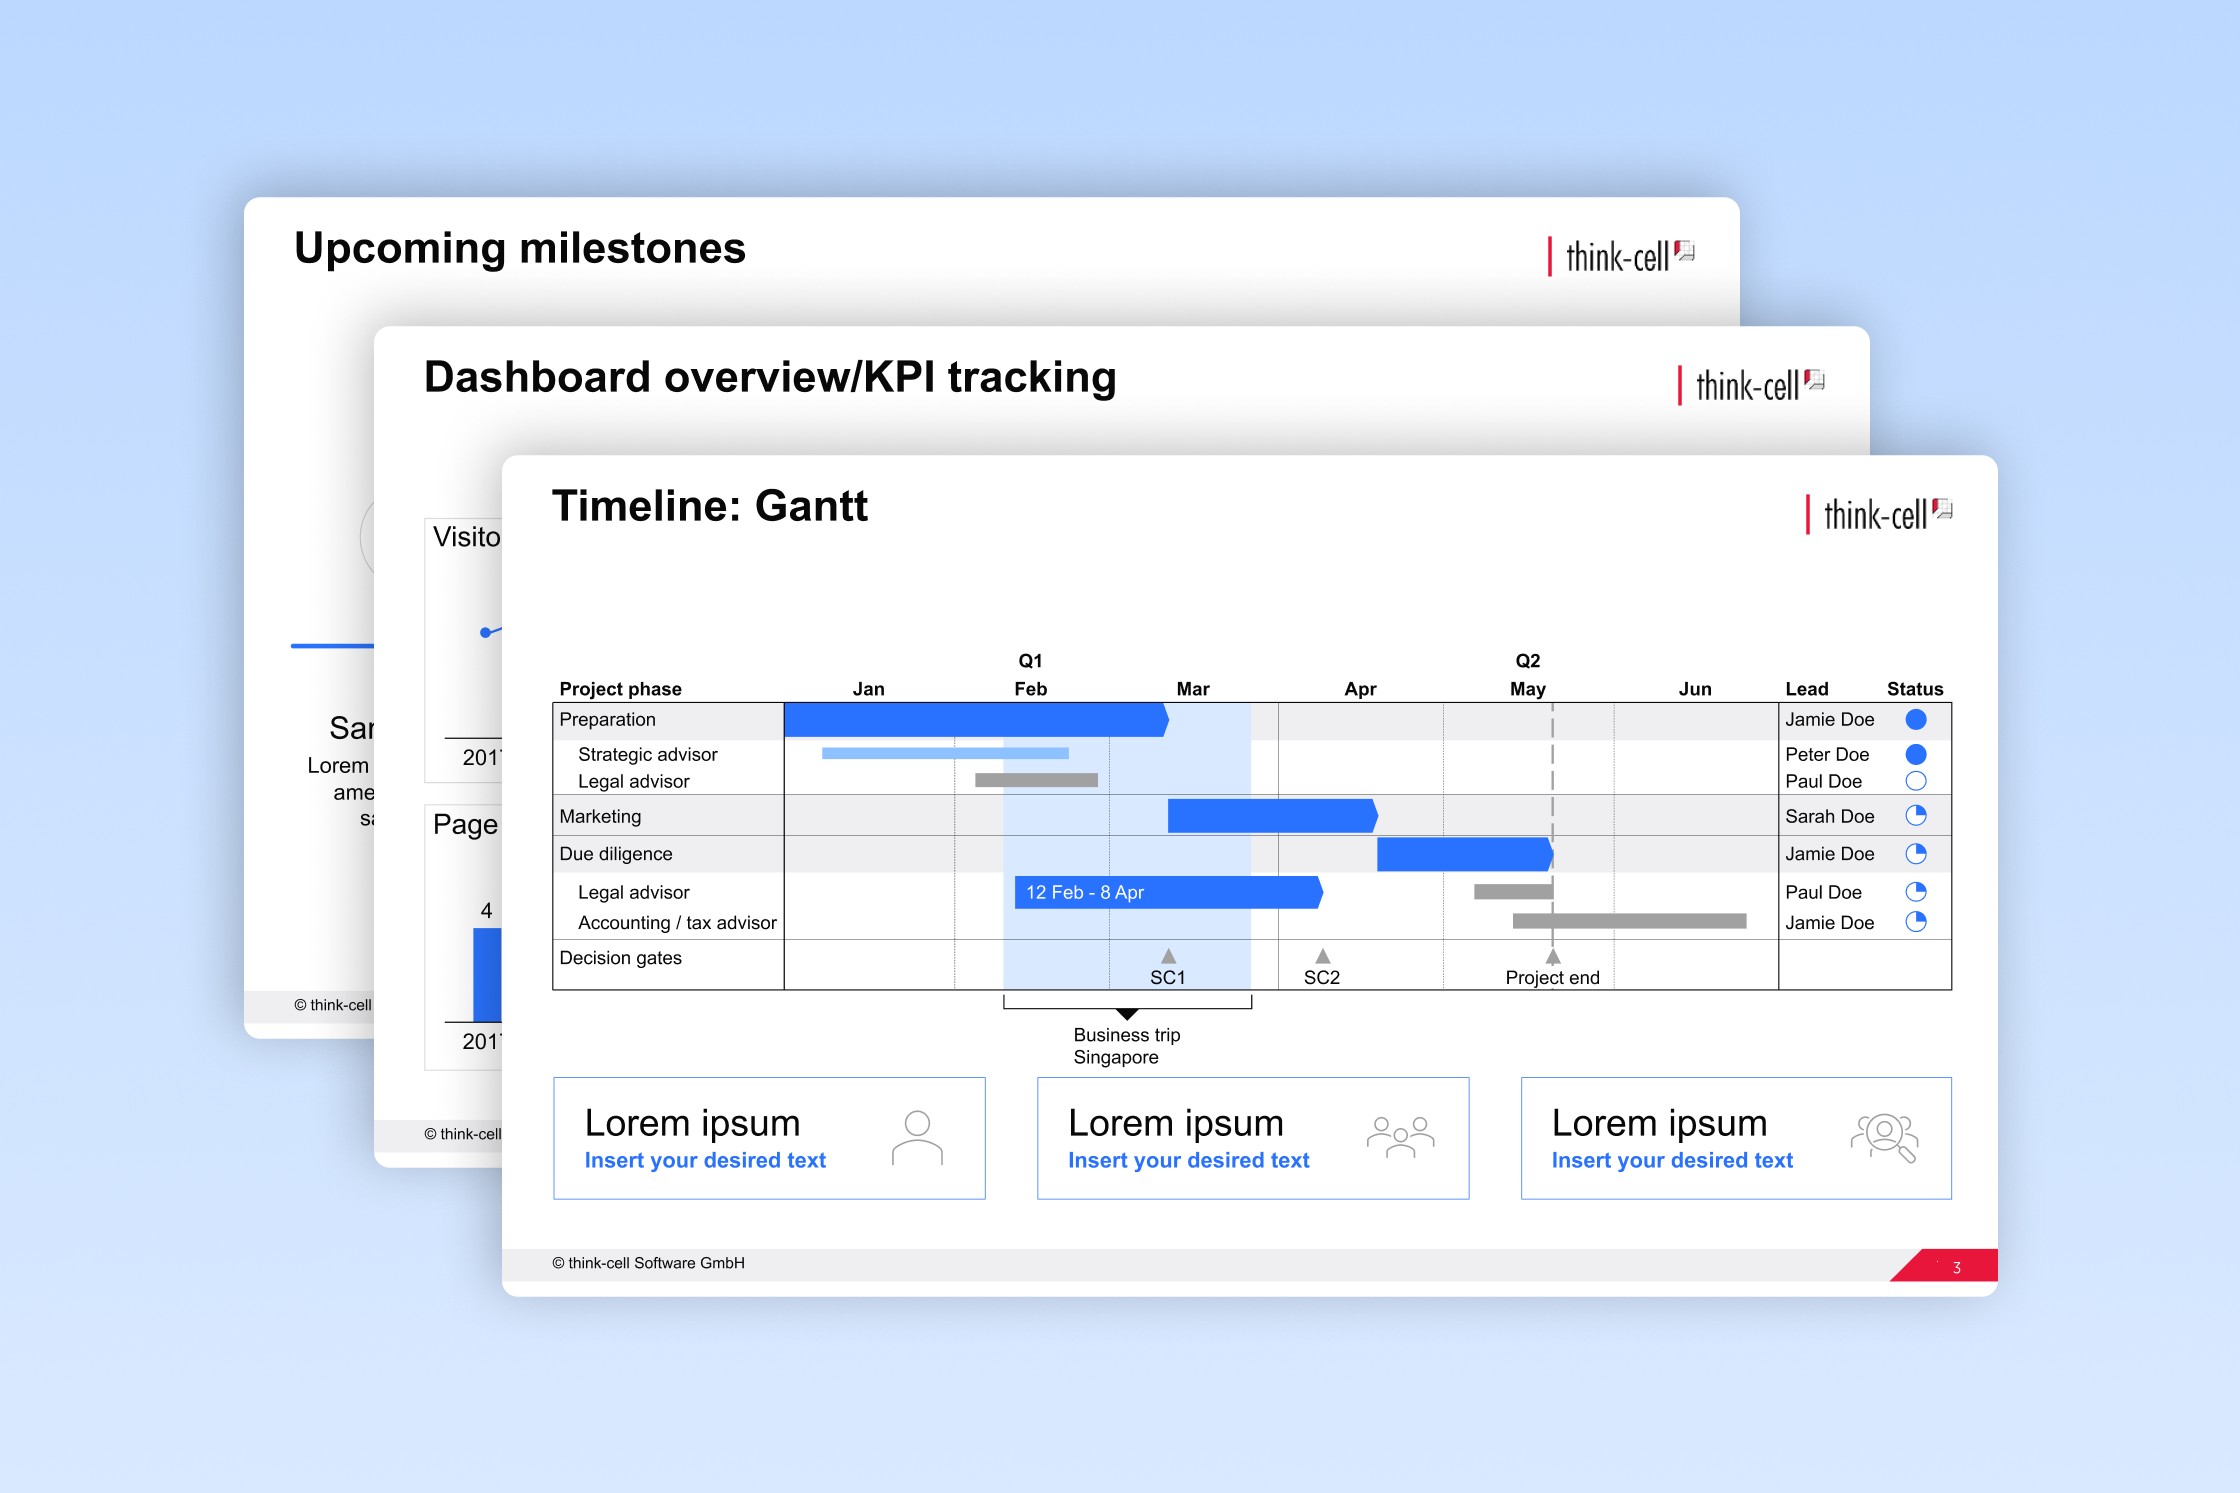
了解创建各类 PowerPoint 时间轴的全部知识,包括制作简单里程碑图和详细项目计划的最佳工具。
2024年7月9日 - 阅读约 26 分钟
了解什么是瀑布图、它们为何有效,以及如何在 Excel 或 PowerPoint 中创建它们,以说服您的受众并辅助您的决策。
2024年7月9日 - 阅读约 44 分钟
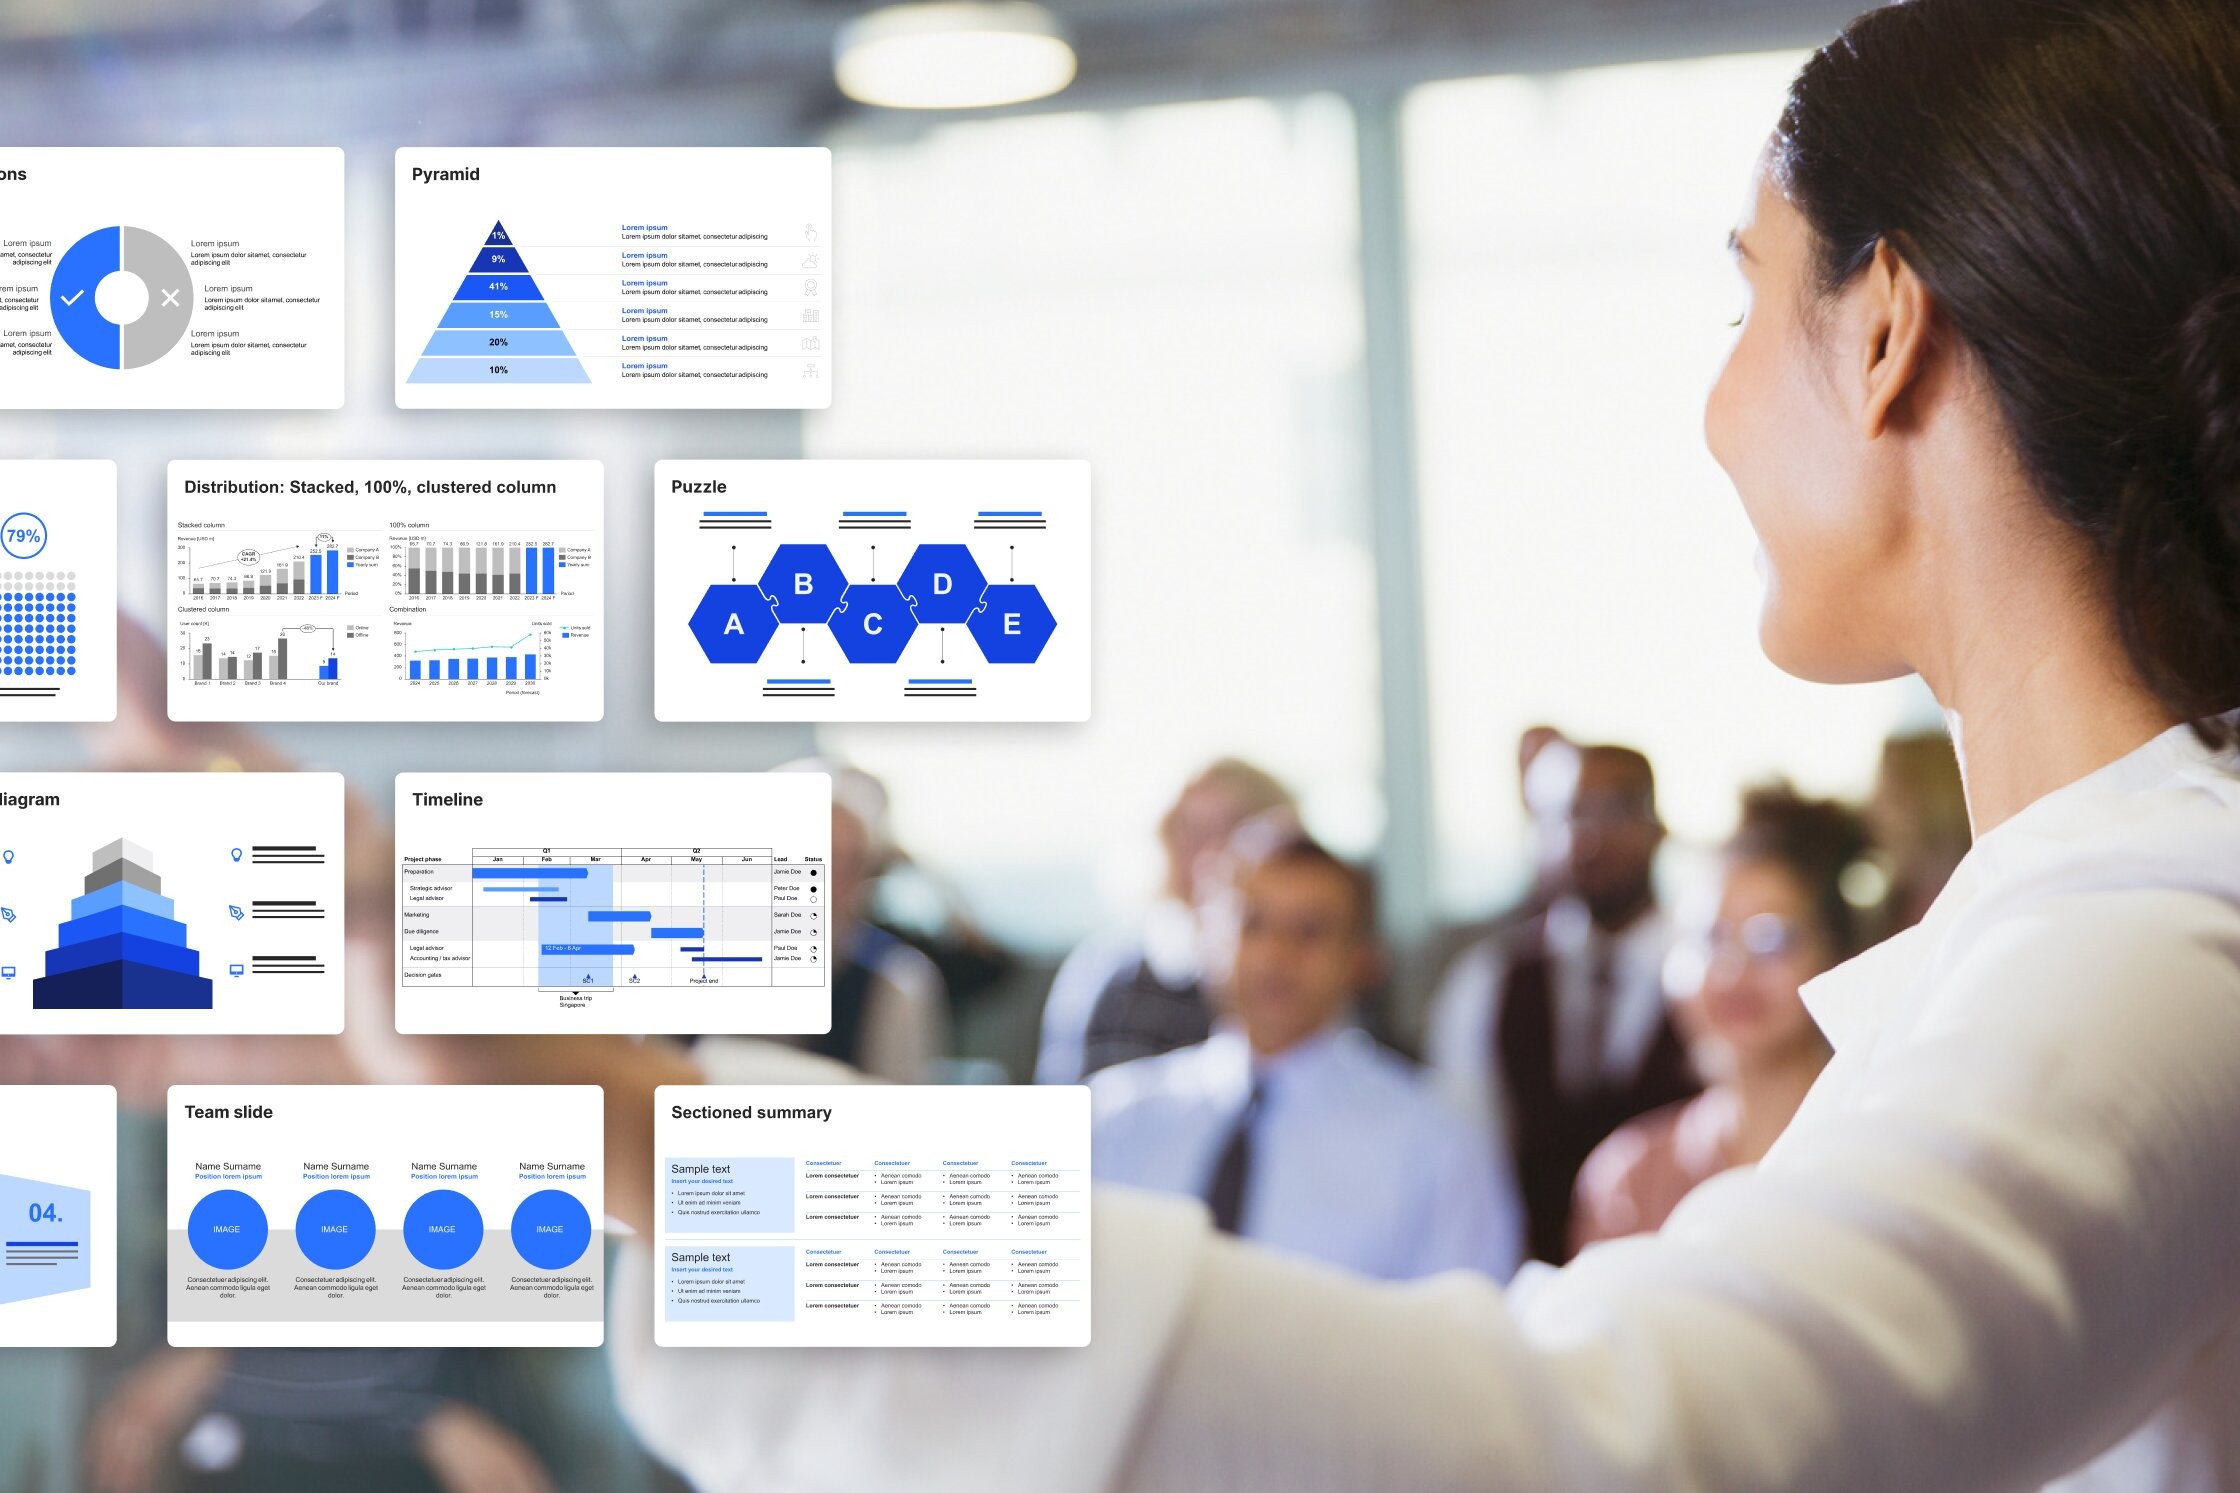
探索最适合幻灯片的可视化形式和图表,讲好故事并打动受众。
2024年3月26日 - 阅读约 22 分钟
think-cell成功收购AskBrian,进一步提升工作空间生产力
2023年9月26日 - 阅读约 2 分钟
清晰、准确的 FP&A 仪表板对一致的财务报告至关重要。了解 FP&A 专业人士如何设计并自动化仪表板,以支持业务目标。
2023年9月12日 - 阅读约 17 分钟

FP&A 场景管理是现代组织在不确定环境中制定计划并做出快速、明智决策时应采用的一种基本思维模式。本博客就如何转向更敏捷和适应性更强的场景管理提供指导。
2023年8月29日 - 阅读约 10 分钟

在本博客中,我们将探讨创作具有说服力的数据驱动型商业故事所涉及的基本要素和实际步骤。
2023年8月1日 - 阅读约 8 分钟
了解大脑对视觉信息的快速处理在商业世界中具有重大意义,特别是对于决策者而言。在本博客中,我们将深入探讨数据可视化在商业决策中发挥的关键作用。
2023年7月25日 - 阅读约 12 分钟
我们来探讨一下 Copilot、它对 PowerPoint 用户的潜在影响、人机交互在整个过程中的重要性以及我们对 Copilot 的看法。
2023年7月14日 - 阅读约 7 分钟

学习制作有效 PowerPoint 演示文稿的 7 个步骤,包括如何组织故事结构、安排幻灯片布局和创建更加简洁、更具影响力的图表。
2023年6月12日 - 阅读约 20 分钟
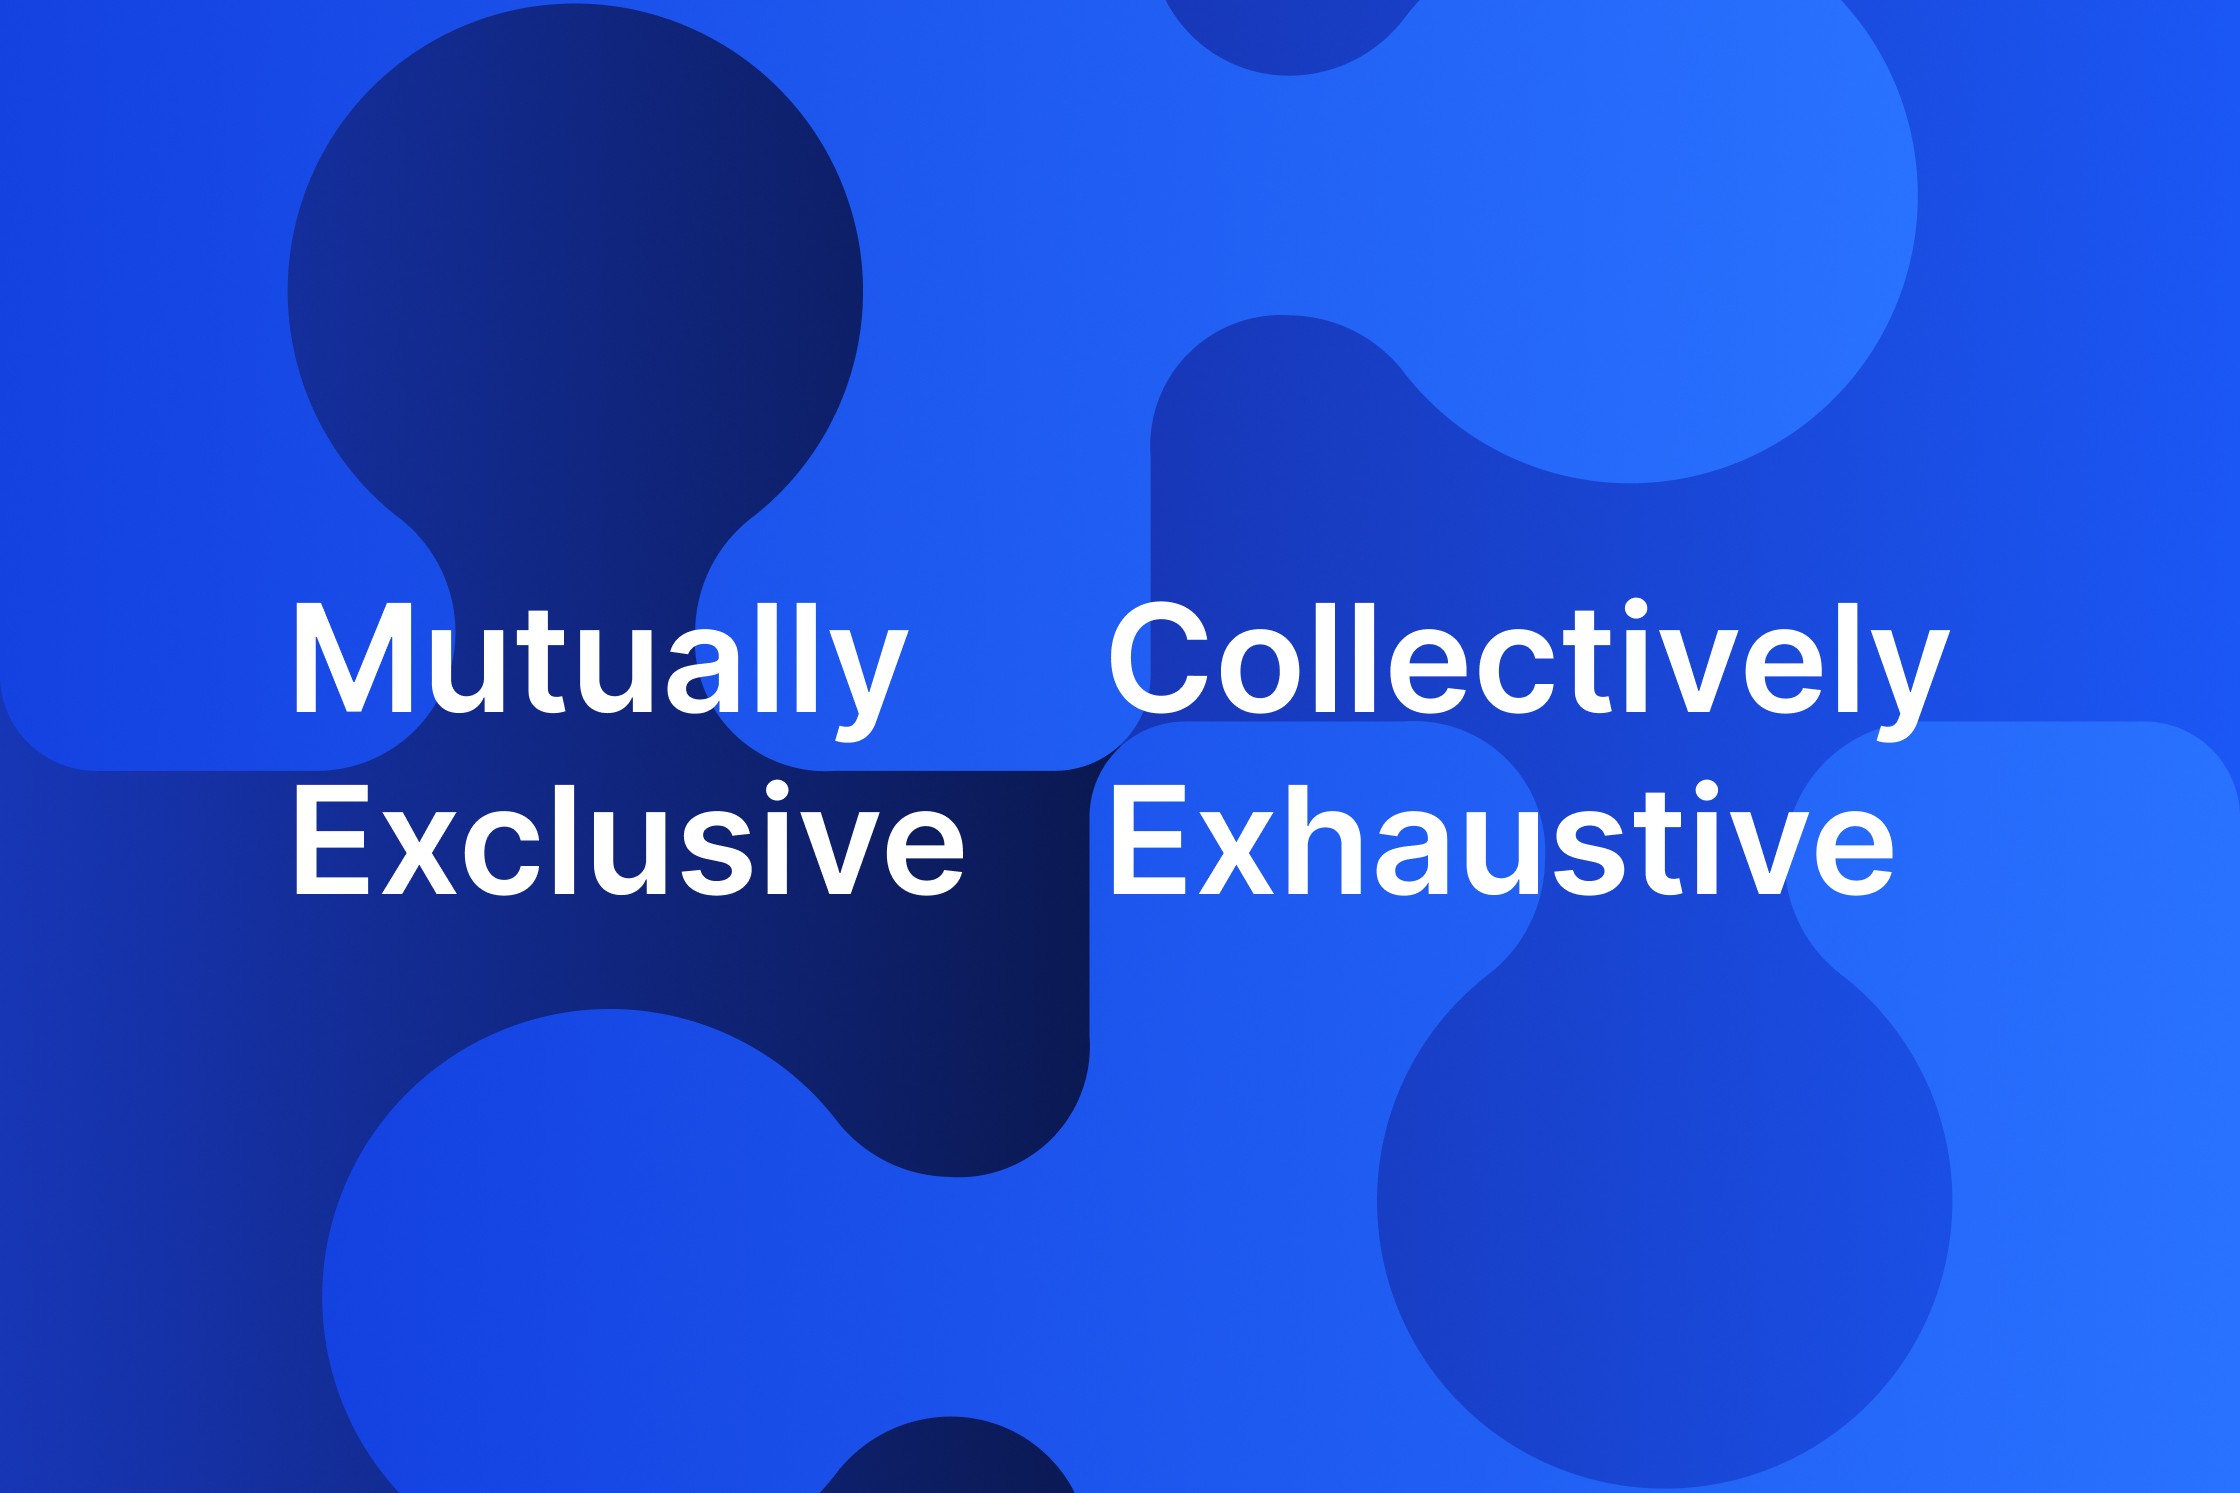
了解 MECE 原则及其应用示范,以及如何利用该原则更快速地创建更出色的 PowerPoint 演示文稿。
2023年5月17日 - 阅读约 13 分钟
2023年3月9日 - 阅读约 3 分钟

了解如何使用 Barbara Minto 提出的金字塔沟通原则来创建更有条理的 PowerPoint 演示文稿,从而更有效地讲述故事。
2023年2月7日 - 阅读约 11 分钟
演示文稿能塑造推动业务发展的对话和决策。通过采用这种方式,您可以加速成长。
2023年2月7日 - 阅读约 5 分钟
2022年12月15日 - 阅读约 2 分钟
2020年12月8日 - 阅读约 2 分钟
think-cell brings full PowerPoint charting functionality to macOS for the first time. Same features, same interface, now on Windows and Mac.
2019年5月3日 - 阅读约 1 分钟
关于 think-cell 博客!
在 think-cell 博客,我们痴迷于 PowerPoint,致力于帮助大家不仅做出更好的演示文稿,还能在制作过程中乐在其中。我们探讨数据可视化最佳实践、有效叙事原则等宏大主题,也提供上手即用的建议和实用技巧,让你的工作更轻松,并让你的商务演示真正产生影响力。
如果你想获取 C++ 方面的洞见和会议报道,欢迎访问我们的 开发者博客。