Automação com dados JSON
- Página inicial
- Recursos
- Manual do usuário
- think-cell Charts: visualização de dados
- Automação avançada de relatórios
- Automação com dados JSON
Crie automaticamente apresentações think-cell com JavaScript Object Notation (JSON). Com a automação JSON do think-cell, você pode fazer o seguinte:
- Preencha os modelos do PowerPoint com dados (por exemplo, títulos de slides e gráficos)
- Reutilize e reordene modelos para criar novas apresentações
- Use dados JSON e modelos de PowerPoint de fontes locais ou remotas
- Transforme dados em tempo real em novas apresentações com um serviço web
Estrutura do arquivo JSON
Esta seção explica como estruturar o arquivo JSON. Trechos de um arquivo de exemplo, sample.ppttc, acompanham esta explicação. Veja o exemplo completo no final desta seção (Exemplo JSON completo).
Esquema JSON e arquivos de exemplo
Na pasta de instalação do think-cell, a pasta ppttc contém os seguintes arquivos:
- O esquema JSON
ppttc-schema.json - O Modelo do PowerPoint
template.pptx - O arquivo de dados JSON
sample.ppttc
O arquivo ppttc-schema.json descreve as regras que um arquivo .ppttc deve seguir para criar uma apresentação do PowerPoint com o think-cell.
O arquivo template.pptx contém elementos nomeados (consulte Automação avançada de relatórios). Um modelo pode ter qualquer número de slides.
O arquivo sample.ppttc especifica:
- Os modelos que o think-cell usará para criar uma nova apresentação
- A ordem em que os modelos aparecerão
- Os dados JSON que preenchem os modelos
Especificar modelos, elementos e seus dados
O exemplo sample.ppttc mostra uma matriz que representa uma apresentação do PowerPoint (consulte Exemplo JSON completo).
Modelos
A matriz contém uma série de objetos, cada um dos quais representa uma cópia de um modelo do PowerPoint. Na nova apresentação, os modelos aparecem na ordem especificada na matriz. Se um modelo tiver vários slides, você só poderá modificar a ordem dos slides editando o modelo no PowerPoint.
Na matriz, cada objeto de modelo deve ter duas propriedades: template e data.
template
A propriedade template é uma string que especifica o modelo do PowerPoint que você deseja usar. A string pode ser uma das seguintes:
- Se você armazenou o modelo localmente, especifique o caminho relativo ou absoluto do modelo no sistema de arquivos local. O separador de diretório deve ser uma barra invertida (\) no Windows – com escape para uma barra invertida dupla (\\) em JSON – ou uma barra (/) no macOS.
- Se você armazenou o modelo remotamente, especifique a URL onde o modelo está armazenado (consulte Fornecer modelos remotamente).
No caso mais simples, como mostrado em Exemplo JSON completo, a string template é apenas o nome do arquivo do modelo do PowerPoint, dado que o modelo está na mesma pasta que o arquivo .ppttc.
"template": "template.pptx",data
A propriedade data é uma matriz de objetos que especificam o seguinte:
- Gráficos e outros elementos com um nome AddRangeData (consulte Automação avançada de relatórios)
- Os dados que preenchem esses elementos
Os objetos podem aparecer em qualquer ordem na matriz data, independentemente da posição dos elementos correspondentes no modelo do PowerPoint.
"data": [ ... ]Elementos
Cada objeto na matriz data tem duas propriedades:
nameespecifica o nome de um elemento, que você atribui no AddRangeData Name (consulte Automação avançada de relatórios).tableespecifica os dados que preenchem o elemento.
Se dois elementos tiverem o mesmo nome, o think-cell preenche-os com os mesmos dados.
O valor table é uma matriz. A estrutura da matriz depende do tipo de elemento:
- Para um campo de texto de automação, Harvey Ball ou caixa de seleção, a matriz
tablecontém uma única submatriz com um único objeto. O objeto, como uma sequência de texto ou um número, preenche o campo de texto. - Para um gráfico ou tabela, a matriz
tablecontém submatrizes que representam os elementos da planilha de dados.
{
"name": "RightChartTitle",
"table": [[{"string": "Our orders (10K)"}]]
},
{
"name": "LeftChart",
"table": [
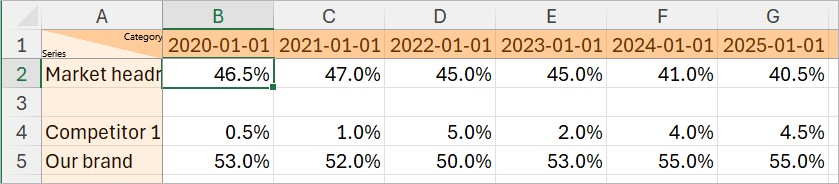
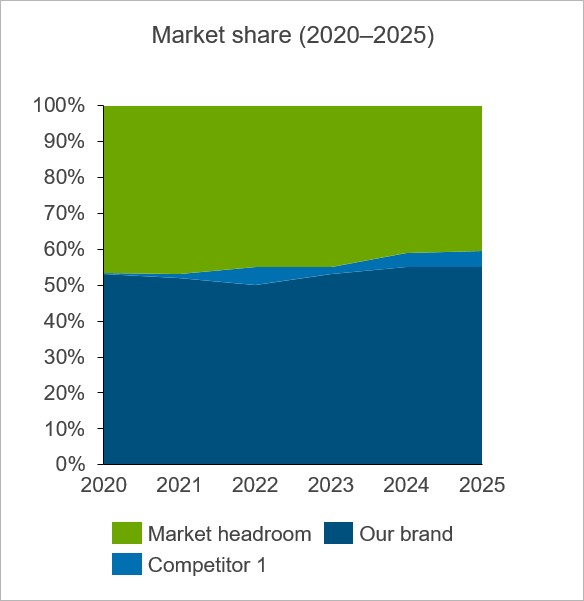
[null, {"date": "2020-01-01"}, {"date": "2021-01-01"}, {"date": "2022-01-01"}, {"date": "2023-01-01"}, {"date": "2024-01-01"}, {"date": "2025-01-01"}],
[{"string": "Market headroom"}, {"percentage": 46.5}, {"percentage": 47}, {"percentage": 45}, {"percentage": 45}, {"percentage": 41}, {"percentage": 40.5}],
[],
[{"string": "Competitor 1"}, {"percentage": 0.5}, {"percentage": 1}, {"percentage": 5}, {"percentage": 2}, {"percentage": 4}, {"percentage": 4.5}],
[{"string": "Our brand"}, {"percentage": 53}, {"percentage": 52}, {"percentage": 50}, {"percentage": 53}, {"percentage": 55}, {"percentage": 55}]
]
},Estrutura da planilha de dados do gráfico
Para um gráfico, cada submatriz na matriz table representa uma linha de uma planilha de dados do gráfico. Para obter o layout específico da planilha de dados de um gráfico, consulte o capítulo correspondente no manual do usuário ou abra a planilha de dados do gráfico para referência (consulte Inserir dados de gráficos). A seguir, é descrita a estrutura das linhas padrão dos gráficos, conforme especificado no esquema JSON.
Primeira linha
A primeira linha é uma submatriz contendo rótulos de categoria. Uma primeira célula vazia (null) precede os rótulos de categoria. Os dados na primeira célula não aparecem no gráfico, portanto podem conter qualquer tipo de informação.
[null, {"date": "2020-01-01"}, {"date": "2021-01-01"}, {"date": "2022-01-01"}, {"date": "2023-01-01"}, {"date": "2024-01-01"}, {"date": "2025-01-01"}],Linhas subsequentes
As linhas seguintes são submatrizes que contêm os rótulos da série e os pontos de dados dos gráficos. A ordem dos elementos em uma submatriz corresponde à ordem das células em uma linha na planilha de dados. A primeira célula da linha contém o rótulo da série, que geralmente é uma string. As células subsequentes na linha devem conter números ou, para gráficos de Gantt, datas.
[{"string": "Market headroom"}, {"percentage": 46.5}, {"percentage": 47}, {"percentage": 45}, {"percentage": 45}, {"percentage": 41}, {"percentage": 40.5}],
[],
[{"string": "Competitor 1"}, {"percentage": 0.5}, {"percentage": 1}, {"percentage": 5}, {"percentage": 2}, {"percentage": 4}, {"percentage": 4.5}],
[{"string": "Our brand"}, {"percentage": 53}, {"percentage": 52}, {"percentage": 50}, {"percentage": 53}, {"percentage": 55}, {"percentage": 55}]Linhas vazias
Para especificar uma linha vazia, use uma matriz vazia ([]).
No trecho anterior, a matriz vazia altera a forma como o think-cell aplica o esquema de cores à série de gráficos PowerPoint Theme (consulte Esquema de preenchimento do gráfico). O esquema de cores atribui verde escuro à série na linha 3. Ao deixar a linha 3 em branco, a série Competitor 1 e Our brand agora estão nas linhas 4 e 5, às quais o esquema de cores atribui azul claro e azul escuro, respectivamente.
Linhas e colunas opcionais
Nas planilhas de dados do gráfico do seu modelo do PowerPoint, você pode adicionar ou remover linhas e colunas opcionais (consulte Editar layout da planilha de dados). Isso afeta a forma como o think-cell interpreta os dados JSON nas linhas e colunas correspondentes.
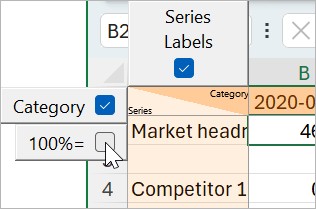
Por exemplo, se você adicionar a linha 100%= em uma planilha de dados do gráfico, o think-cell interpreta a segunda linha dos dados JSON como os totais a partir dos quais as porcentagens são calculadas. Se você omitir a linha 100%=, como neste exemplo, o think-cell interpreta os dados JSON na segunda linha como pontos de dados comuns.
A tabela a seguir resume as linhas e colunas opcionais comuns, suas posições na planilha de dados e suas configurações padrão. Para verificar o layout dos dados de um gráfico específico, clique duas vezes no gráfico para abrir sua planilha de dados.
|
Option |
Contents |
Datasheet position |
Default setting |
|---|---|---|---|
|
Series |
Rótulos de série |
Coluna 1 |
Selecionado |
|
Category |
Rótulos de categoria |
Linha 1 |
Selecionado |
|
100%= |
Totais para cálculos de porcentagem |
Linha 2 (se Category selecionada) |
Não selecionado |
Campos de texto de automação, Harvey Ball e caixas de seleção
Ao preencher campos de texto de automação, bolas Harvey únicas e caixas de seleção únicas com dados JSON, o think-cell espera uma matriz table com uma célula. Dentro do vetor table, a célula é representada como uma única submatriz contendo um único objeto.
{
	"name": "SlideTitle",
	"table": [[{"string": "Competition: Germany"}]]
},Se uma Harvey Ball ou caixa de seleção fizer parte de uma tabela, basta especificar o conteúdo dos elementos na célula correspondente da tabela.
Tipos de dados de células
Em um arquivo .ppttc, as células podem conter os seguintes tipos de dados.
|
Data type |
Key |
Example |
Notes |
|---|---|---|---|
|
Texto |
|
|
Todos os caracteres Unicode imprimíveis (UTF-8) são válidos. |
|
Número |
|
|
O separador decimal deve ser um ponto (.). |
|
Data do calendário |
|
|
Formato obrigatório: |
|
Porcentagem |
|
|
O separador decimal deve ser um ponto (.). Não inclua o sinal de porcentagem (%). |
|
Cor de preenchimento da célula da planilha de dados |
|
Hex: RGB: |
Adicione Para aplicar as cores de preenchimento da planilha de dados aos recursos do gráfico, no modelo do PowerPoint, selecione Use Datasheet Fill (consulte Esquema de preenchimento do gráfico). |
|
Célula vazia |
Não aplicável |
|
Não coloque |
Exemplo JSON completo
Veja o exemplo JSON completo sample.ppttc abaixo:
[
	{
		"template": "template.pptx",
		"data": [
			{
				"name": "SlideTitle",
				"table": [[{"string": "Competition: Germany"}]]
			},
			{
				"name": "LeftChartTitle",
				"table": [[{"string": "Market share (2020–2025)"}]]
			},
			{
				"name": "RightChartTitle",
				"table": [[{"string": "Our orders (10K)"}]]
			},
			{
				"name": "LeftChart",
				"table": [
					[null, {"date": "2020-01-01"}, {"date": "2021-01-01"}, {"date": "2022-01-01"}, {"date": "2023-01-01"}, {"date": "2024-01-01"}, {"date": "2025-01-01"}],
					[{"string": "Market headroom"}, {"percentage": 46.5}, {"percentage": 47}, {"percentage": 45}, {"percentage": 45}, {"percentage": 41}, {"percentage": 40.5}],
					[],
					[{"string": "Competitor 1"}, {"percentage": 0.5}, {"percentage": 1}, {"percentage": 5}, {"percentage": 2}, {"percentage": 4}, {"percentage": 4.5}],
					[{"string": "Our brand"}, {"percentage": 53}, {"percentage": 52}, {"percentage": 50}, {"percentage": 53}, {"percentage": 55}, {"percentage": 55}]
				]
			},
			{
				"name": "RightChart",
				"table": [
					[null, {"date": "2020-01-01"}, {"date": "2021-01-01"}, {"date": "2022-01-01"}, {"date": "2023-01-01"}, {"date": "2024-01-01"}, {"date": "2025-01-01"}],
					[{"string": "Pending"}, {"number": 0, "fill": "#ff0000"}, {"number": 0, "fill": "#ff0000"}, {"number": 0, "fill": "#ff0000"}, {"number": 0, "fill": "#ff0000"}, {"number": 0, "fill": "#ff0000"}, {"number": 14, "fill": "#ff0000"}],
					[null, {"number": 709}, {"number": 712}, {"number": 710}, {"number": 700}, {"number": 760}, {"number": 747}]
				]
			}
		]
	},
	{
		"template": "template.pptx",
		"data": [
			{
				"name": "SlideTitle",
				"table": [[{"string": "Competition: Canada"}]]
			},
			{
				"name": "LeftChartTitle",
				"table": [[{"string": "Market share (2022–2025)"}]]
			},
			{
				"name": "RightChartTitle",
				"table": [[{"string": "Our orders (1K)"}]]
			},
			{
				"name": "LeftChart",
				"table": [
					[null, {"date": "2022-01-01"}, {"date": "2023-01-01"}, {"date": "2024-01-01"}, {"date": "2025-01-01"}],
					[{"string": "Market headroom"}, {"percentage": 34}, {"percentage": 38}, {"percentage": 41}, {"percentage": 42}],
					[{"string": "Competitor 2"}, {"percentage": 31}, {"percentage": 17}, {"percentage": 15}, {"percentage": 14}],
					[{"string": "Competitor 1"}, {"percentage": 20}, {"percentage": 10}, {"percentage": 9}, {"percentage": 7}],
					[{"string": "Our brand"}, {"percentage": 15}, {"percentage": 35}, {"percentage": 35}, {"percentage": 37}]
				]
			},
			{
				"name": "RightChart",
				"table": [
					[null, {"date": "2022-01-01"}, {"date": "2023-01-01"}, {"date": "2024-01-01"}, {"date": "2025-01-01"}],
					[{"string": "Pending"}, {"number": 0, "fill": "#ff0000"}, {"number": 0, "fill": "#ff0000"}, {"number": 0, "fill": "#ff0000"}, {"number": 15, "fill": "#ff0000"}],
					[null, {"number": 250}, {"number": 401}, {"number": 481}, {"number": 476}]
				]
			}
		]
	}
]Criar apresentações com dados JSON
Quando o think-cell é instalado, ele instrui o sistema operacional a abrir arquivos .ppttc com o think-cell. Para abrir arquivos JSON com o think-cell no Explorador de arquivos (Windows) ou no Finder (macOS), por exemplo, clicando duas vezes, use a extensão .ppttc.
Quando um arquivo JSON é aberto, o think-cell faz o seguinte:
- O think-cell lê o arquivo e verifica se há erros.
- O think-cell cria uma nova apresentação. A apresentação consiste em cópias dos modelos de slides especificados na matriz de nível superior no arquivo JSON.
- Nas cópias do modelo, o think-cell preenche os elementos (identificados por
name) com seus dados correspondentes (especificados natable). Os elementos são atualizados de acordo. - A nova apresentação é aberta no PowerPoint. Você pode salvar ou continuar editando a apresentação.
Crie apresentações a partir da linha de comando
![]()
Crie uma apresentação a partir de dados JSON da linha de comando inserindo o seguinte:
<var>PPTTC_PATH</var> <var>PPTTC_INPUT</var> -o <var>PPTX_OUTPUT</var>Substitua o seguinte:
PPTTC_PATH: o caminho deppttc.exePPTTC_INPUT: o caminho do seu arquivo .ppttcPPTX_OUTPUT: o nome do arquivo .pptx criado, precedido pelo caminho onde deseja salvá-lo
O arquivo executável ppttc.exe está localizado em ppttc na pasta de instalação do think-cell. Chame ppttc.exe nos scripts de automação para criar novas apresentações do PowerPoint.
Fornecer dados JSON remotamente
Gere remotamente dados JSON para um arquivo .ppttc em um servidor. Para criar uma nova apresentação, o usuário faz o download do arquivo .ppttc de um navegador da web e o abre com o think-cell.
Para obter um exemplo de como gerar e baixar dados JSON com um servidor, na pasta de instalação do think-cell, consulte /ppttc/sample.html. O arquivo sample.html contém os seguintes elementos:
- Marcação HTML para um botão que, quando clicado, compila dados JSON instantaneamente
- Alguns dados JSON estáticos. Em um caso de uso típico, os dados JSON vêm de outras fontes.
- Uma função JavaScript que faz o download do arquivo .ppttc para o computador do usuário.
Depois que o usuário faz o download do arquivo .ppttc, ele poderá salvá-lo ou abri-lo. Quando o usuário abre o arquivo, o think-cell cria uma nova apresentação usando os dados JSON (consulte Criar apresentações com dados JSON).
Fornecer modelos remotamente
Para fornecer modelos do PowerPoint por meio de um servidor, faça o seguinte:
- No arquivo JSON, forneça uma URL em vez de um caminho local para a chave
template. O protocolo de URL pode ser HTTP ou HTTPS. - Certifique-se de que o usuário que abre o arquivo .ppttc tenha acesso ao modelo remoto.
Uma instalação padrão do think-cell na máquina do usuário é suficiente para gerar apresentações do think-cell com dados JSON remotos e modelos.
Criar apresentações remotamente
Configure fluxos de trabalho automatizados nos quais os usuários fazem download das apresentações do think-cell com dados personalizados. Para baixar apresentações, os usuários precisam apenas de um navegador da web. Eles não precisam ter o think-cell instalado em seu computador.
A configuração desses fluxos de trabalho requer o servidor think-cell, que só funciona no Windows. O servidor think-cell recebe dados JSON como entrada e gera apresentações do PowerPoint como saída.
Execute o servidor think-cell
![]()
Para iniciar o servidor think-cell, siga estas etapas:
- Na pasta de instalação do think-cell, execute o
tcserver.exe. - Insira uma URL que especifique o endereço IP e a porta que o servidor deve ouvir. O protocolo do servidor é HTTP ou HTTPS.
- Selecione Register URL.
- Quando solicitado, permita que o servidor think-cell faça alterações no seu dispositivo.
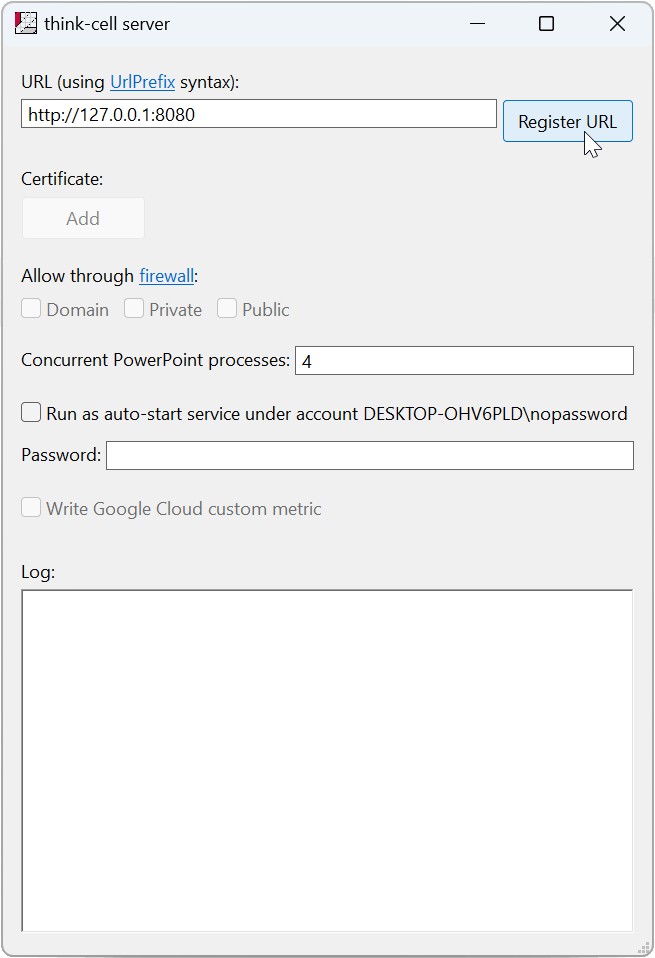
Para parar o servidor think-cell, siga estas etapas:
- Selecione Unregister URL.
- Quando solicitado, permita que o servidor think-cell faça alterações no seu dispositivo.
O campo Log exibe o seguinte:
- Confirmação de que o servidor iniciou ou parou de escutar em uma URL
- Todas as solicitações do cliente e respostas do servidor
O servidor aceita dados JSON como solicitações HTTP POST com tipo de mídia (também conhecido como tipo MIME) application/vnd.think-cell.ppttc+json e responde com um arquivo PowerPoint.
Executar como serviço automático
Para iniciar automaticamente o servidor think-cell ao ligar o computador, siga estas etapas:
- Na caixa de diálogo think-cell server, selecione a opção Run as auto-start service.
- Em Password, insira a senha para a conta nomeada na opção Run as auto-start service.
Experimente!
![]()
Crie uma apresentação do PowerPoint com o clique de um botão usando nosso exemplo pronto.
- Inicie o servidor think-cell com o URL
http://127.0.0.1:8080. - Abra
http://127.0.0.1:8080em um navegador. - A página da web "teste ppttc" será aberta. Selecione Send .ppttc to server and get .pptx.
O servidor think-cell cria uma apresentação do PowerPoint a partir de dados JSON. O navegador faz download da apresentação para o seu computador.
O código-fonte HTML da página de "teste ppttc" demonstra um possível uso da automação JSON do think-cell. O código-fonte pode servir como ponto de partida para o seu próprio fluxo de trabalho automatizado. O código contém os seguintes elementos:
- Marcação HTML para um botão que, quando clicado, invoca um método usando o
XMLHttpRequestpara se comunicar com o servidor think-cell. - Alguns dados JSON estáticos. Em um caso de uso típico, os dados JSON vêm de outras fontes.
- Uma função JavaScript para enviar os dados JSON para o servidor think-cell. O servidor gera a solicitação HTTP POST com os dados JSON estáticos. A resposta do servidor é um download de arquivo.
A página de "teste ppttc" usa JavaScript para enviar solicitações HTTP POST e salvar a resposta dos servidores think-cell como um arquivo PowerPoint. Obviamente, outros idiomas também funcionam.amplo
Precisa solucionar problemas
Confira nossa base de conhecimento