25. Introduction to automation
think-cell helps you to quickly create professional, data-driven charts in PowerPoint. But what about automating periodic reports, or using a web service to create charts based on your parameters, or exporting your business intelligence reports as PowerPoint slides? Using think-cell’s automation, you can do this quickly with your Excel or JSON data, and without the mistakes commonly found in a manual process. All you need is:
- A PowerPoint presentation with think-cell charts.
- Programmatic logic to control the automation.
Let’s begin by creating a PowerPoint presentation with a think-cell chart and a text box for the slide title as an automation template:
- Create a chart in PowerPoint as described in 4. Introduction to charting and later chapters. Any think-cell chart type will work, including all decorations like axes and difference arrows.
The initial data is not important as it will later be replaced programmatically by the real data.
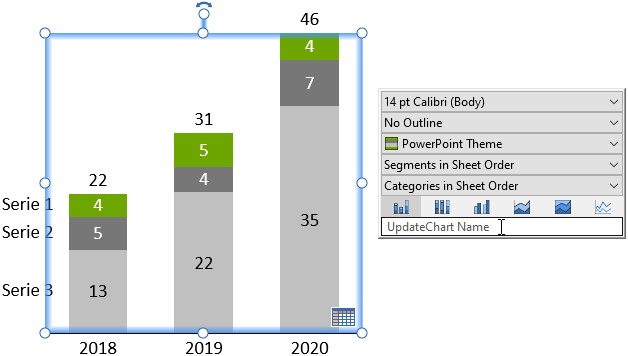
- In the contextual toolbar of the chart, click on the field that says UpdateChart Name.
- Enter a unique name, e.g.,
Chart1, which you will refer to later.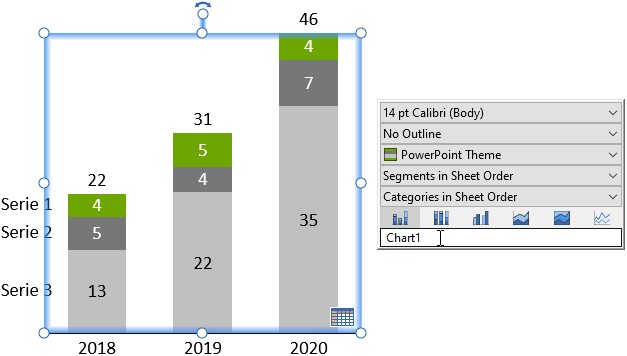
- Where the slide title should appear on the slide, insert a

- In the contextual toolbar of the text field, click on the field that says UpdateChart Name.
- Enter a unique name, e.g.,
Title, which you will refer to later.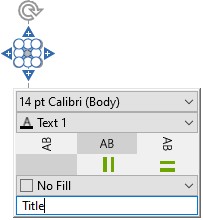
- Save the presentation, e.g., as
template.pptx.
The next step is to create programmatic logic which will merge your Excel or JSON data with the template slide.
- For Excel data, refer to 26. Automation with Excel data.
- For JSON data, refer to 27. Automation with JSON data.
With the process above you can create presentations with arbitrary combinations of think-cell charts. You can prepare a library of all the chart types you need and, as required, versions with different chart decorations enabled. Then, you can freely combine these templates and supply them with data for use in a new presentation using either Excel or JSON.
Note:
This approach replaces the need for a general API to create charts and add chart decorations, which is not supported.