Crear elementos desde Excel
- Inicio
- Recursos
- Manual del usuario
- think-cell Charts: Visualización de datos
- Vínculos de datos externos
- Crear elementos desde Excel
Cuando los datos de origen para sus gráficos basados en datos se encuentran en Excel, puede crear gráficos, tablas, imágenes, Harvey Balls y casillas de verificación directamente desde la aplicación Excel. Al cambiar los datos en Excel, puede actualizar los gráficos ejecutando una tarea o bien hacer que think-cell ejecute la actualización automáticamente (consulte Administrar los datos en elementos vinculados).
Crear gráficos desde Excel
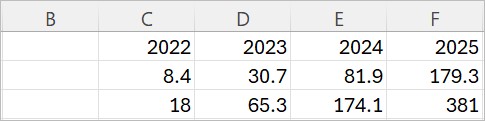
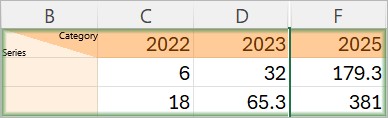
Supongamos que desea recrear el gráfico de ejemplo de Introducción a los gráficos, pero en lugar de introducir los datos en la hoja de datos interna de PowerPoint, desea utilizarlo directamente desde una hoja de Excel. Los datos se presentan de la siguiente manera en Excel:
Para crear un gráfico a partir de Excel, seleccione el rango de datos deseado del libro de Excel, incluidas las etiquetas de serie (vacía en nuestro ejemplo) y categoría:
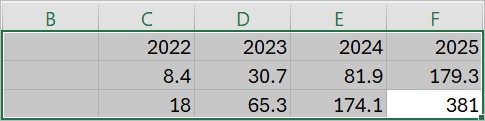
El rango que seleccionamos en nuestro ejemplo se ajusta perfectamente a la hoja de datos predeterminada de un gráfico de columnas acumuladas, donde las filas representan series, las columnas representan categorías, las etiquetas de categoría en la primera y una primera columna en la que irían etiquetas de serie. Este es el caso más sencillo, ya que inicialmente se creará un vínculo utilizando el diseño de datos predeterminado para el tipo de gráfico seleccionado. Pero no es estrictamente necesario, ya que la interpretación de un rango vinculado de celdas puede modificarse como se explica en Transponer y editar el diseño de datos de los rangos vinculados.
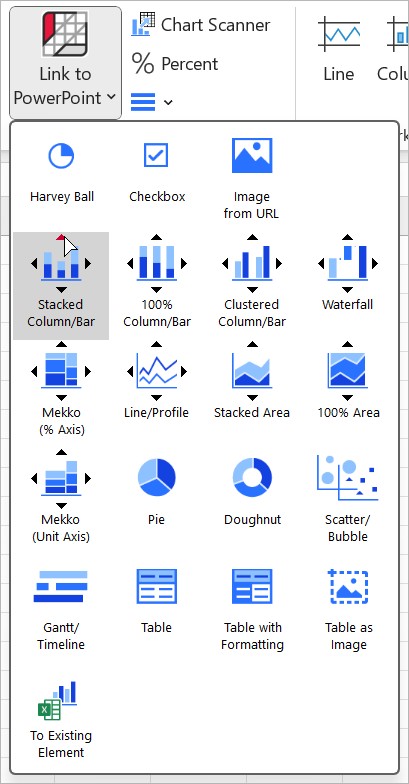
Ahora seleccione el tipo de gráfico deseado, en nuestro caso una tabla de columnas acumuladas, en el menú Link To PowerPoint de la barra de herramientas de think-cell en Excel:
Al hacer clic en este elemento del menú en Excel, se activa la ventana de PowerPoint. Si PowerPoint aún no está ejecutándose, se inicia automáticamente. En PowerPoint, cuando el puntero del ratón se encuentra sobre una diapositiva, aparece el conocido rectángulo de inserción.
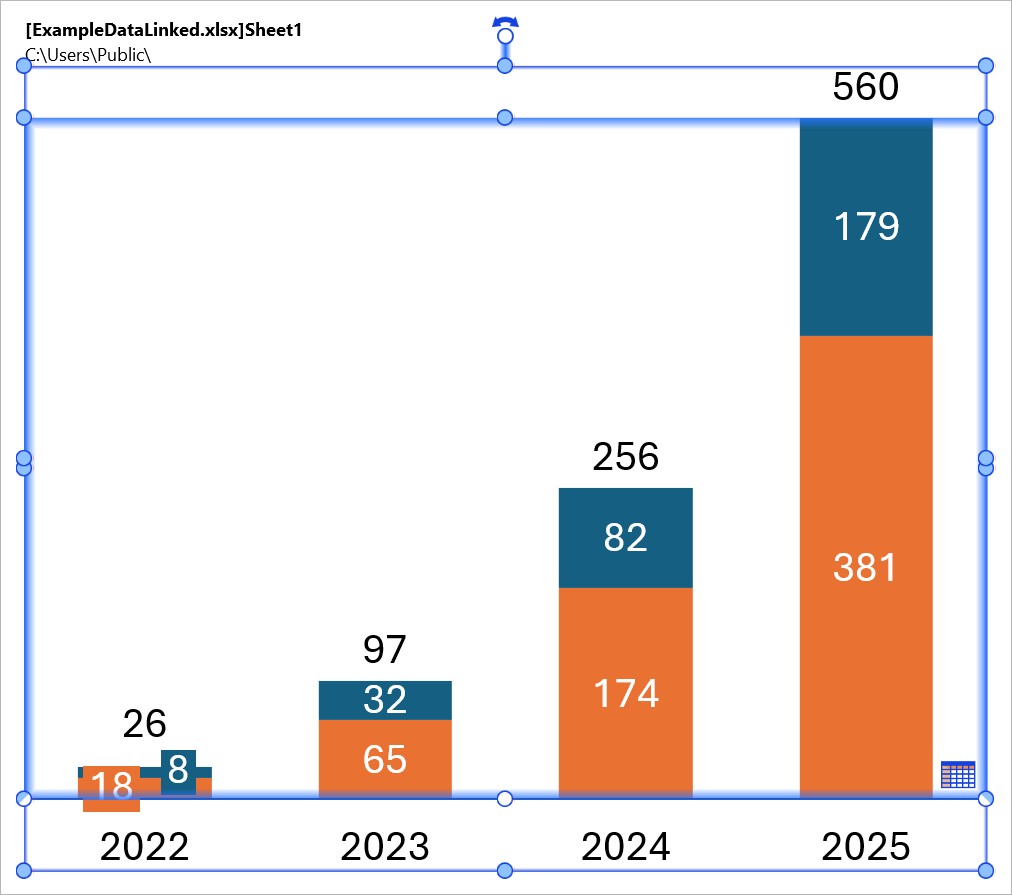
Cambie a la diapositiva en la que quiere insertar el gráfico o inserte una nueva diapositiva y coloque el gráfico como de costumbre: Haga clic una vez para aceptar el tamaño predeterminado, o bien haga clic, mantenga pulsado y arrastre para cambiar el tamaño inicial del gráfico. Para obtener una explicación detallada acerca de cómo colocar, cambiar de tamaño y alinear un nuevo gráfico, consulte Insertar gráficos.
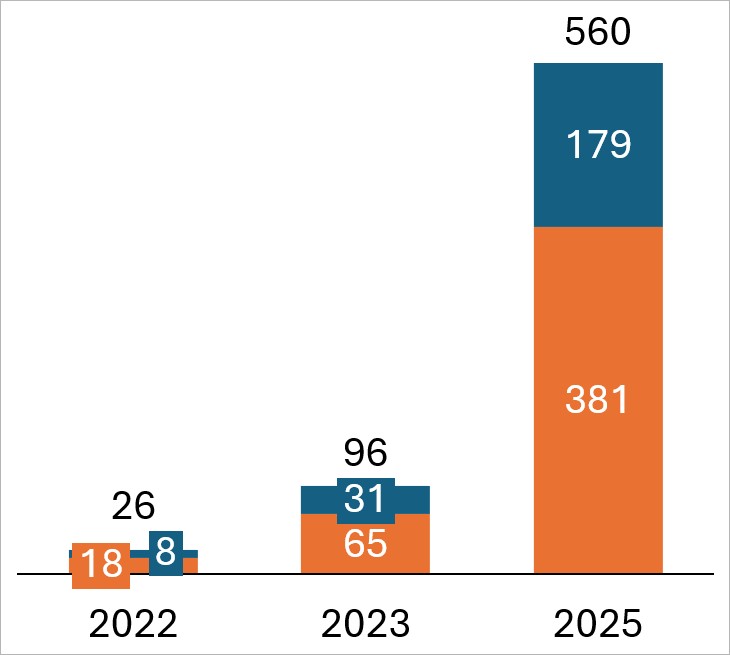
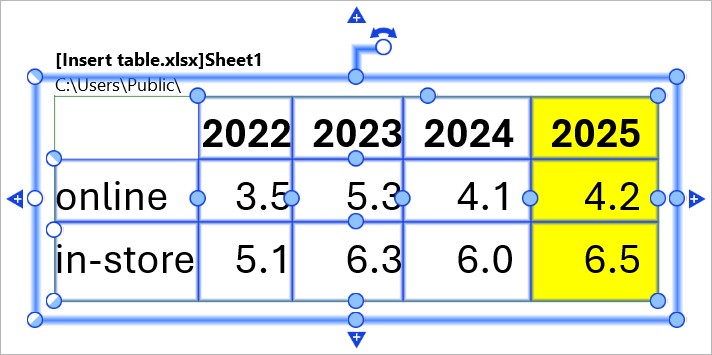
Después de insertarlo, el gráfico tiene el aspecto y se comporta como un gráfico de think-cell normal que se ha creado en PowerPoint. El libro de Excel que contiene los datos vinculados se indicará en la parte superior del gráfico:
Por favor, consulte Añadir y eliminar etiquetas y Gráficos de estilo y formato para aprender a configurar y diseñar el gráfico.
Nota: Si usa fondos de celda en color en Excel, puede configurarlos como color de relleno del segmento en el gráfico vinculado marcando Use Datasheet Fill on Top en el control de la combinación de colores del gráfico (consulte Esquema de relleno de gráficos). Esta función puede ser especialmente potente si la combina con las opciones de formato condicional de Excel.
Además de crear un gráfico nuevo, puede vincular un intervalo de datos seleccionado en su libro de Excel con un gráfico existente en una presentación de PowerPoint. No tiene más que hacer clic en el botón 
Recopilar datos de Excel vinculados
Al crear gráficos directamente a partir de Excel, puede que ya cuente con datos en Excel. No obstante, en algunos casos puede que no desee crear un gráfico utilizando todos los datos que tiene en su hoja de Excel. Otra posibilidad es que los datos puedan estar en un formato fijo no susceptible de ser modificado fácilmente.
Puede modificar la interpretación del rango vinculado para que se adapte mejor a su diseño de datos. (consulte Transponer y editar el diseño de datos de los rangos vinculados). A veces, es posible que necesite más formas de compilar y controlar los datos vinculados. Le presentamos aquí algunas sugerencias que pueden servirle de ayuda en esas situaciones:
- Coloque el marco del vínculo de datos de think-cell en un área vacía en su hoja de cálculo de Excel. A continuación, utilice las referencias de celda de Excel para rellenar el marco de think-cell con datos procedentes de otros puntos de la hoja de cálculo. Por ejemplo, introduzca
=B5en la celda F8 para actualizar F8 siempre que se modifique B5. - Las referencias de celda de Excel también funcionan en las hojas de cálculo. Añadir una hoja de cálculo específica como hoja de interfaz para todos los gráficos puede resultar especialmente útil si tiene que vincular un número elevado de gráficos.
- Utilizar una hoja específica como origen de sus gráficos contribuirá también a facilitar la preparación de los datos especialmente para el fin previsto. Por ejemplo, puede utilizar think-cell round para redondear de forma sistemática los datos antes de presentarlos en un gráfico (consulte Redondeo de datos en Excel).
- Para ocultar filas o columnas de datos completas de modo que no se reflejen en el gráfico, no tiene más que utilizar el comando de Excel Hide. Tenga en cuenta que los datos ocultos aparecerán en el gráfico en cuanto utilice el comando de Excel Unhide y actualice el gráfico.
- De igual modo, puede utilizar la función de Excel Group and Outline para ocultar datos que no desee que se muestren en el gráfico.
Crear tablas desde Excel
Hay tres formas de recrear la tabla de Excel como elemento de think-cell en PowerPoint:
Para actualizar tablas o configurar sus ajustes de actualización, consulte Administrar los datos en elementos vinculados y Administrar datos vinculados con el cuadro de diálogo Data Links. Para aplicar formato a las tablas, consulte Tablas de formato.
Insertar tablas
Para crear una tabla de think-cell desde Excel, siga estos pasos:
- En Excel, seleccione el rango de celdas que desea incluir en la tabla.
- En la ficha Insert, en el grupo think-cell, seleccione Link to PowerPoint > Table.
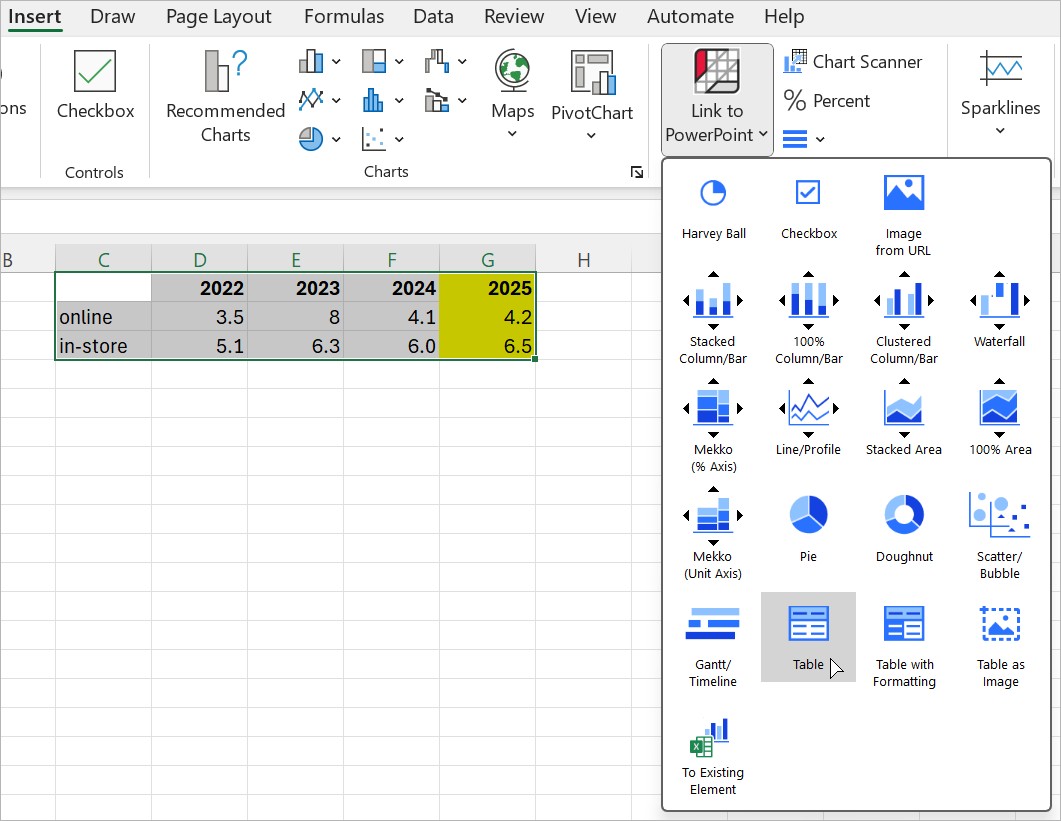
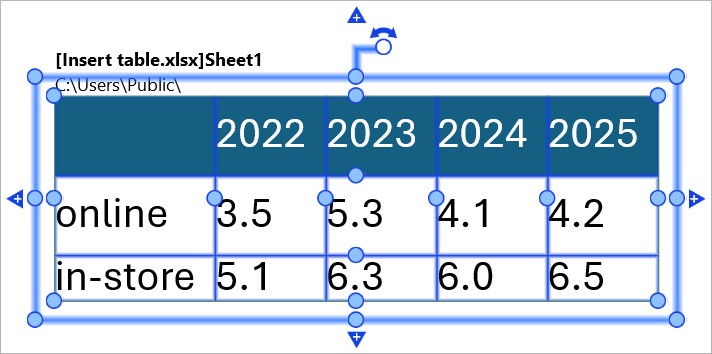
- Se abrirá PowerPoint. Coloque la tabla en una diapositiva.
Insertar tablas con formato Excel
Inserte una tabla en la que la mayoría de las opciones de formato, como el estilo de fuente, el color de relleno y la alineación de texto, coincidan inicialmente con las especificadas en la hoja de Excel. Para obtener más información, consulte Hacer coincidir el formato del elemento con el rango de datos vinculado.
Para insertar una tabla con formato Excel en la presentación, siga estos pasos:
- En Excel, seleccione el rango de celdas que desea incluir en la tabla.
- En la ficha Insert, en el grupo think-cell, seleccione Link to PowerPoint > Table with Formatting.
- Se abrirá PowerPoint. Coloque la tabla en una diapositiva.
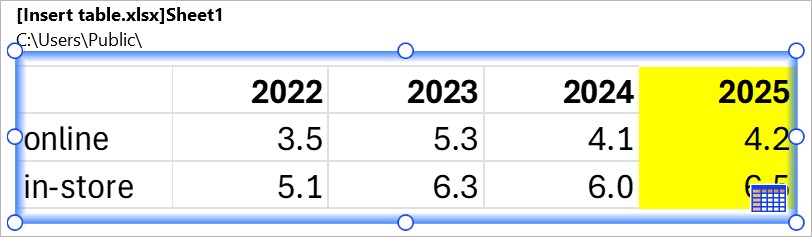
Insertar imágenes de tablas
Inserte una imagen de una tabla que coincida con hoja de Excel píxel por píxel. Actualice la imagen de Excel como cualquier otro elemento vinculado (consulte Administrar los datos en elementos vinculados). Solo puede editar el contenido y el formato de una imagen de una tabla desde su hoja de Excel vinculada.
Para insertar la imagen de una tabla en su presentación, siga estos pasos:
- En Excel, seleccione el rango de celdas que desea incluir en la tabla.
- En la ficha Insert, en el grupo think-cell, seleccione Link to PowerPoint > Table as Image.
- Se abrirá PowerPoint. Coloque la tabla en una diapositiva.
Crear texto vinculado a Excel
Puede agregar contenido vinculado desde Excel a una etiqueta de gráfico, cuadro de texto think-cell o cuadro de texto de PowerPoint. Para ello, siga estos pasos:
- En Excel, seleccione la celda que desea vincular.
- En PowerPoint, coloque el cursor en una etiqueta o cuadro de texto.
- En PowerPoint, en la pestaña de Insert, seleccione Elements > Text Linked to Excel

Para administrar las actualizaciones de los datos de Excel, consulte Administrar los datos en elementos vinculados.
Crear Harvey Balls y casillas de verificación desde Excel
Puede crear y controlar Harvey Balls y casillas de verificación directamente desde un libro de Excel. Para obtener más información sobre las Harvey Balls y las casillas de verificación, consulte Harvey Balls y casillas de verificación.
Crear Harvey Balls desde Excel
Para crear una Harvey Ball desde Excel, siga estos pasos:
- En Excel, en una celda vacía, introduzca una de las siguientes opciones:
- Un número absoluto entre
0y el número total de segmentos de la Harvey Ball - Un porcentaje entre
0%y100% - Una fórmula que da como resultado un número absoluto entre
0y el número total de segmentos de Harvey Ball o un porcentaje entre0%y100%
- Un número absoluto entre
- Seleccione la celda y, a continuación, seleccione Insert > think-cell > Link to PowerPoint > Harvey Ball

- En PowerPoint, inserte la Harvey Ball en su presentación.
Como alternativa, para vincular la celda de Excel a una Harvey Ball existente en su presentación, seleccione Insert > think-cell > Link to PowerPoint > To Existing Element
Para cambiar el estado de finalización de una Harvey Ball desde Excel, en la celda vinculada, introduzca otro valor o fórmula. Para obtener más información sobre la actualización de elementos vinculados, consulte Administrar los datos en elementos vinculados.
Crear casillas de verificación desde Excel
Para crear una casilla de verificación desde Excel, siga estos pasos:
- En una celda vacía, introduzca un acceso directo de símbolo de casilla de verificación o una fórmula que dé como resultado un acceso directo:
- Casilla de verificación vacía (☐):
0o un espacio vacío - Símbolo de comprobación (✓):
1,v, oo - Símbolo de X (✗):
2ox - Símbolo de casilla de verificación personalizada: el acceso directo de símbolo que especificó en su archivo de estilo think-cell (consulte Personalizar los estilos predeterminados de casilla de verificación)
- Casilla de verificación vacía (☐):
- Seleccione la celda y, a continuación, seleccione Insert > think-cell > Link to PowerPoint > Checkbox

- En PowerPoint, inserte la casilla de verificación en su presentación.
Como alternativa, para vincular la celda de Excel a una casilla de verificación existente en su presentación, seleccione Insert > think-cell > Link to PowerPoint > To Existing Element
Para cambiar el símbolo de casilla de verificación de Excel, en la celda vinculada, introduzca otro método abreviado o fórmula de símbolo de casilla de verificación. Para obtener más información sobre la actualización de elementos vinculados, consulte Administrar los datos en elementos vinculados.
Añadir imágenes desde Excel
Puede añadir una imagen a su presentación desde una celda de Excel que contenga la URL de una imagen. Para ello, siga estos pasos:
- En Excel, en una celda vacía, introduzca la URL de la imagen que desee.
- Seleccione la celda que contiene la URL.
- En la cinta de Excel, seleccione Insert > think-cell > Link to PowerPoint > Image from URL. Se abre PowerPoint.
- En PowerPoint, inserte la imagen en la diapositiva (consulte Insertar elementos).
También puede sustituir una imagen de la diapositiva por una imagen que tenga su URL en Excel. Para ello, siga estos pasos:
- En PowerPoint, seleccione la imagen que desea sustituir.
- En Excel, seleccione la celda que contiene la URL de la imagen que desea.
- En PowerPoint, en la pestaña de cinta, seleccione Insert > think-cell Data > New Excel Link.
¿Necesitas ayuda para solucionar problemas?
Consulta nuestra base de conocimientos