Tables with datasheets (TO DO)
- Home
- Resources
- User manual
- think-cell Charts: Data visualization
- Tables with datasheets (TO DO)
[ADD INTRO]
Open a table's datasheet (TO DO)
To insert and place a table on your slide, choose 
To open the datasheet again later, double-click any table cell.
Whenever you change or add data, your think-cell table will reflect this. You do not need to manually add additional columns or rows.
In the same way, you can simply delete cells, rows or columns from the datasheet to remove them from the table.
Create tables from selected elements (TO DO)
Match table formatting to Excel
Match specific formatting options in your think-cell table to your Excel table, or recreate your entire Excel table and its formatting in your presentation.
Match table formatting options to Excel
To match specific formatting options—such as font style, alignment, and fill color—to your Excel sheet, select the cells you want to format, then:
- To control a formatting option from the Excel sheet, select its Use Datasheet option. For example, select Use Datasheet Horizontal Alignment.
- To control a formatting option from PowerPoint, clear its Use Datasheet checkbox or select a different option in its dropdown menu.

Use Datasheet options include:
- Use Datasheet Number/Date Format—available if the selected cells contain numbers or dates from a linked Excel sheet
- Bold/Italic
- Font Color
- Fill
- Horizontal Alignment
- Vertical Alignment
- Border—formats the entire table at once, rather than a selection of cells
Edit table text on the slide (TO DO)
Duplicate chart data as a table
With an Excel sheet or a slide datasheet, use the same data to create both a chart and a table below the chart. The chart's series labels are also the table's column headers. To create a table with data that you can move between the chart and the table, see Data tables.
To add a chart's data as a table below the chart, follow these steps:
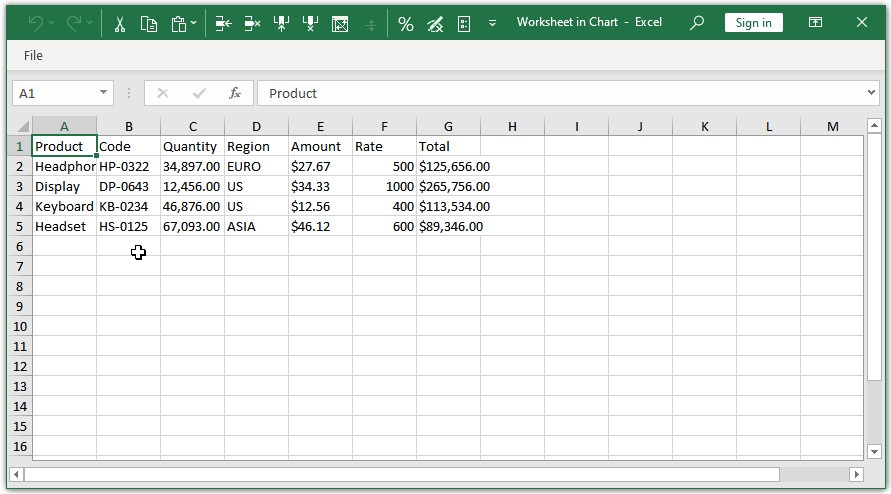
- From Excel or the slide datasheet, create your chart (see Create charts from Excel or Slide datasheets (WIP)).
- In the sheet, select the chart data, leaving out the category labels.
- On the ribbon, on the Insert tab, select Link to PowerPoint > Table with Formatting.

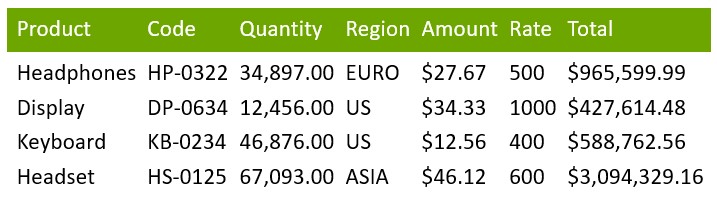
- In PowerPoint, insert your table below the chart.
- Align the table columns with the chart's category labels (see Snap text boxes at a distance).

- Format the cell contents as needed (see Format tables).

Add Harvey balls, checkboxes, and images to tables
Instead of text, table cells can also contain Harvey balls, checkboxes, and images. You can control these elements' states dynamically in the table's datasheet or linked range in Excel.
To display a Harvey ball, checkbox, or image in a table cell, select the cell to open its mini toolbar, then choose one of the following:
- Harvey Ball

- Checkbox

- Picture from Online Service

In the datasheet or Excel range, the cell that is linked to the element must contain the following:
- Harvey ball: A number between 0 and the maximum number of segments (by default, 4), indicating how many segments should be filled.
- Checkbox
- To display a check:
v,o, or1 - To display an X mark:
xor2 - To display an unchecked box: Space or
0
- To display a check:
- Image: The image's URL. To obtain the URL, in your browser, right-click the image and select Copy Image Link or Copy Image Address.
If the linked cell doesn't contain the required content—for example, if the cell is linked to a Harvey ball and contains text—a red exclamation mark 
Additional resources
- Get started (WIP)
- think-cell Core: Presentation basics (TO DO)
- think-cell Charts: Data visualization
- think-cell Library: Presentation resources
- Deployment guide
- The think-cell API (WIP)