Chart scanner
- Home
- Resources
- User manual
- think-cell Charts: Data visualization
- Chart scanner

Scan an image of a bar or column chart on your screen and use the scanned data in a think-cell chart or an Excel sheet. You can scan images from any source on your screen, such as websites, PDF documents, or applications.
Use the chart scanner in PowerPoint
To scan an image and use the scanned data in a think-cell chart, follow these steps:
- In PowerPoint, create any chart except a scatter chart, a bubble chart, a Mekko chart with unit axis, and a Gantt chart.
- Open the chart’s datasheet: double-click the chart, or select the chart and select Open Datasheet

- In the datasheet's toolbar, select Extract and Paste Numerical Data

- Move and resize the chart scanner window so that the capture area contains the image you want to scan. Include only the chart area, axes, and labels. Keep headers, references, and explanations outside the capture window.
- Wait for the chart scanner window to finish scanning. When the chart scanner finishes scanning, it outlines the chart segments in red and the chart baseline in green, and enables the Fill Datasheet button.
- To rescan the image, move or resize the chart scanner. If the chart scanner can't scan your image accurately, inform think-cell support by selecting Report Bad Scan.
- To insert the scanned data into your datasheet, select Fill Datasheet. The chart updates to reflect the new data. Close the chart scanner.
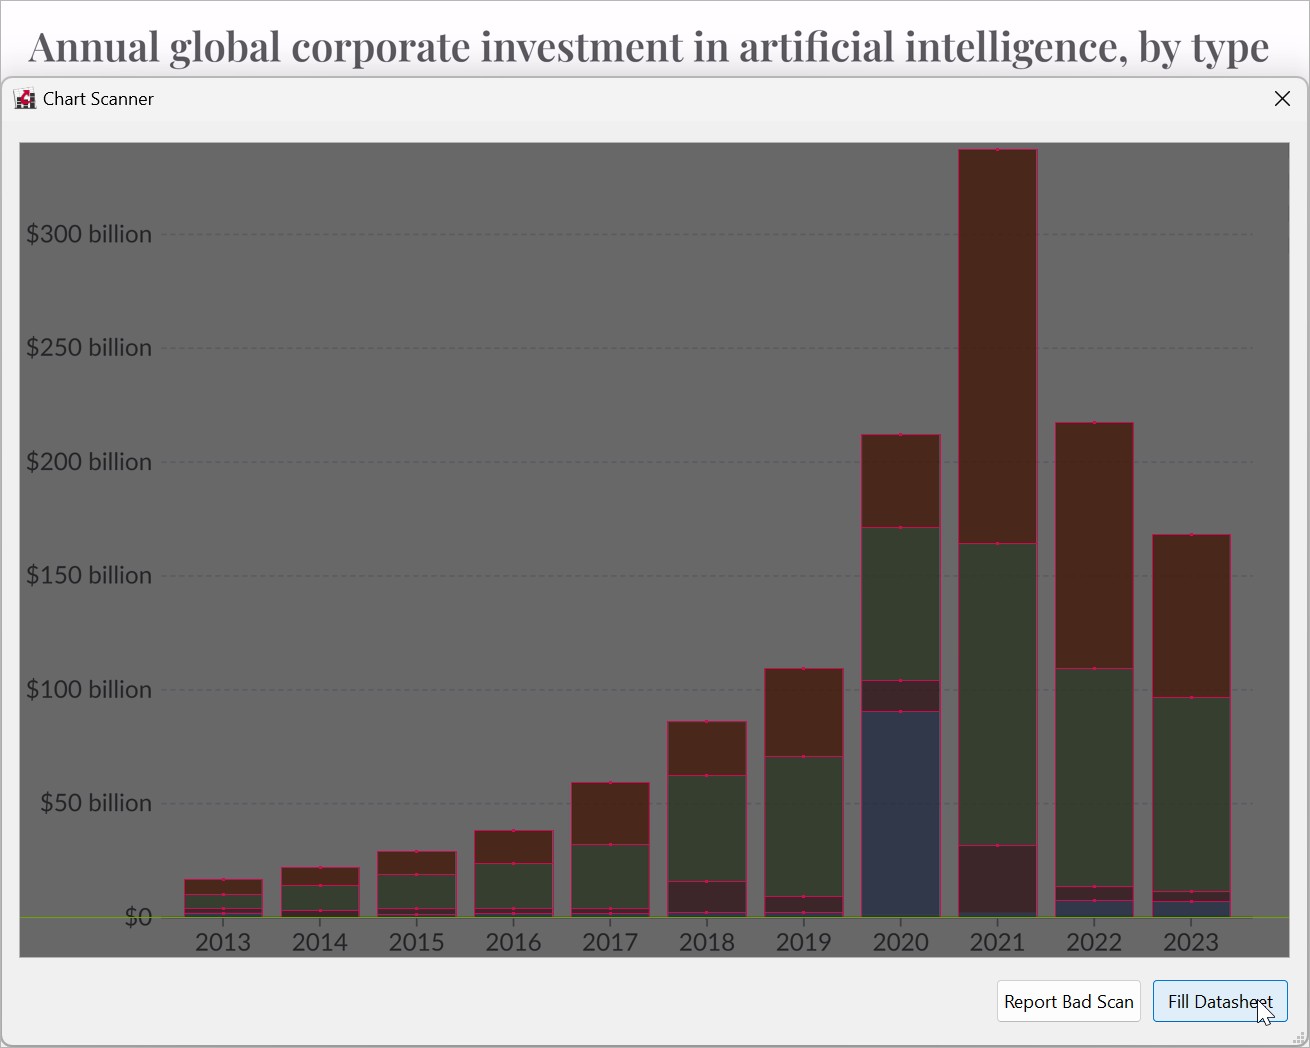
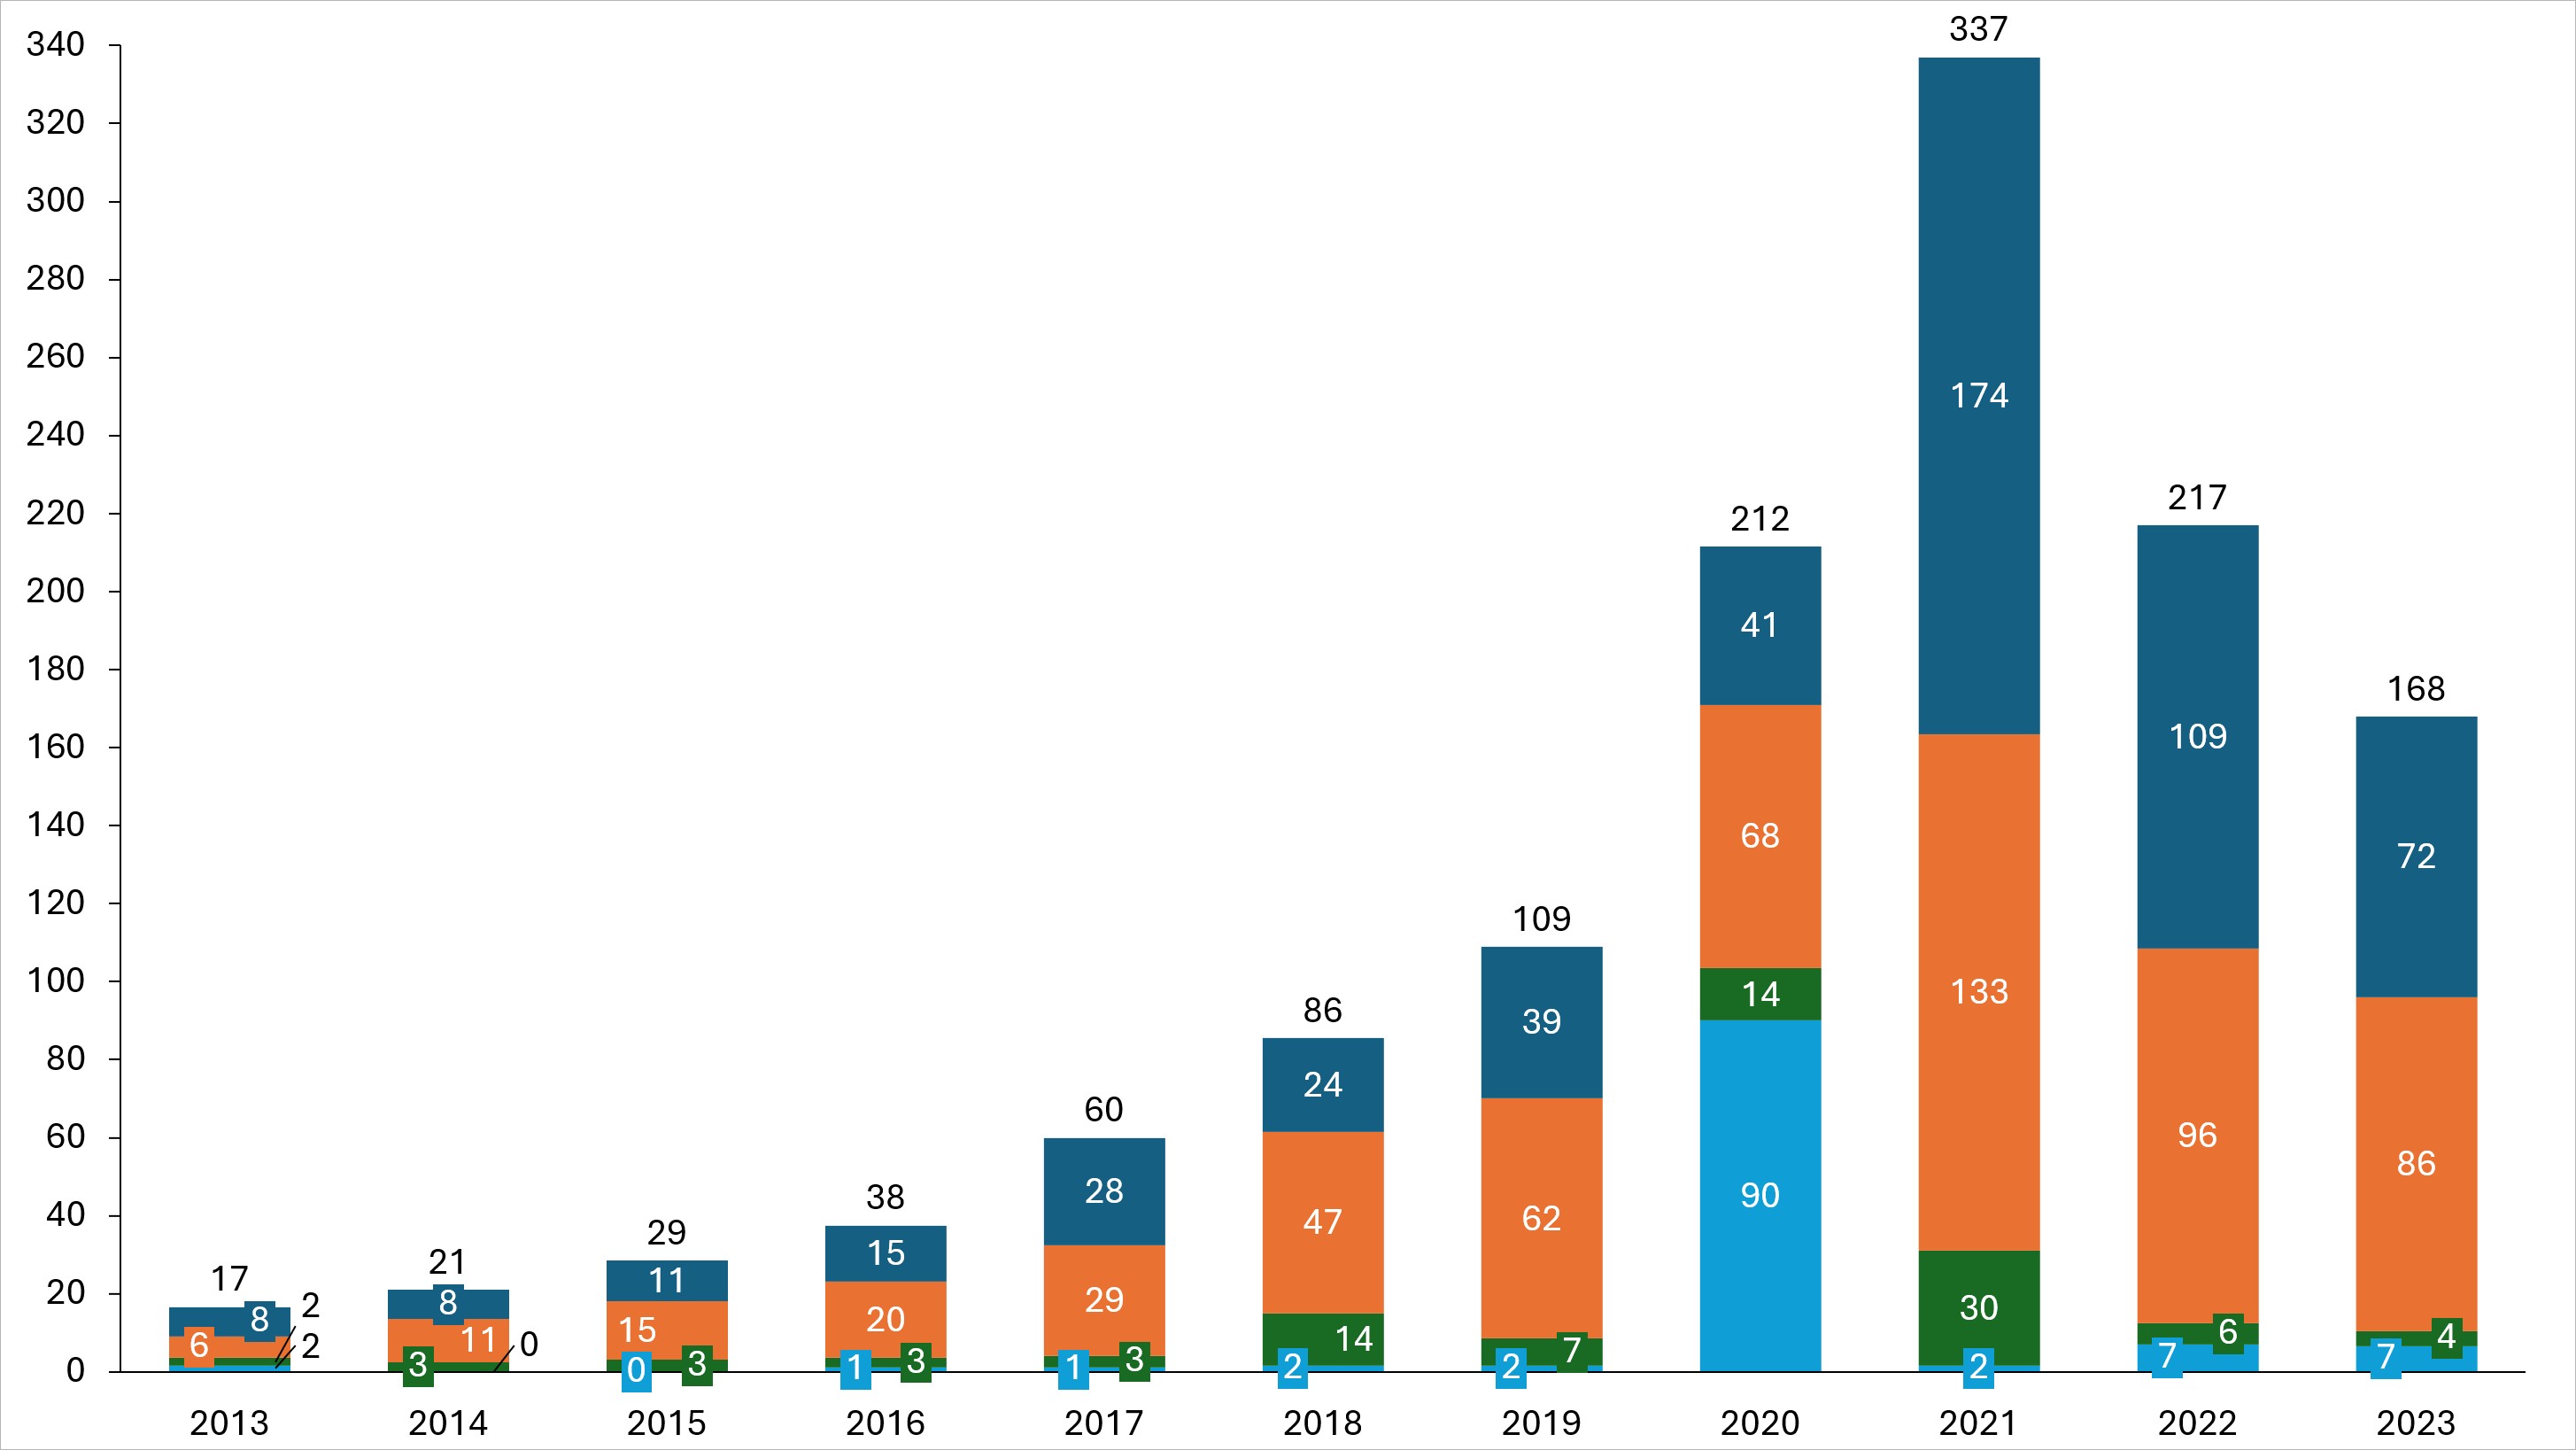
Source: Giattino et al. 2024. "Annual global corporate investment in artificial intelligence, by type." Our World in Data.
You can format and edit the updated chart just like any other think-cell chart.
Use the chart scanner in Excel
To scan an image and use the scanned data in an Excel sheet, follow these steps:
- In Excel, select the cell range where you want to insert the scanned data.
- Select think-cell > Data > Chart Scanner
- Move and resize the chart scanner window so that the capture area contains the image you want to scan. Include only the chart area, axes, and labels. Keep headers, references, and explanations outside the capture window.
- Wait for the chart scanner to finish scanning. When the chart scanner finishes scanning, it outlines the chart segments in red and the chart baseline in green, and enables the Paste Into Excel button.
- To rescan the image, move or resize the chart scanner window. If the chart scanner can't scan your image accurately, inform think-cell support by selecting Report Bad Scan.
- To insert the scanned data into your Excel sheet, select Paste Into Excel. The Excel sheet updates to reflect the new data. Close the chart scanner.
You can analyze the data in Excel or link it to a think-cell element in PowerPoint. To learn more, see Excel data links.
- Get started (WIP)
- think-cell Core: Presentation basics (TO DO)
- think-cell Charts: Data visualization
- think-cell Library: Presentation resources
- Deployment guide
- The think-cell API (WIP)