Create elements from Excel
- Home
- Resources
- User manual
- think-cell Charts: Data visualization
- External data links
- Create elements from Excel
When the source data for your data-driven charts is available in Excel, you can create charts, tables, images, Harvey balls, and checkboxes directly from Excel. When data in Excel changes, you can either update the charts on command or have think-cell do the update automatically (see Manage the data in linked elements).
Create charts from Excel
Let's say you want to recreate the example chart from Introduction to charts, but instead of entering the data into the internal datasheet in PowerPoint, you want to use it directly from an Excel sheet. This is how the data looks in Excel:

To create the chart from Excel, select the desired data range in your Excel workbook, including series (in our example empty) and category labels:

The range we selected in our example perfectly fits the default datasheet of a Stacked Column chart, with rows representing series, columns representing categories, category labels in the first row, and series labels in the first column. This is the easiest case, as a link will initially be created using the default data layout for the selected chart type. But it is not strictly necessary, as the interpretation of a linked range of cells can be modified as explained in Transpose and edit the data layout of linked ranges.
Now select the desired chart type, in our case a Stacked Column chart, from the Link To PowerPoint menu in Excel’s think-cell toolbar:
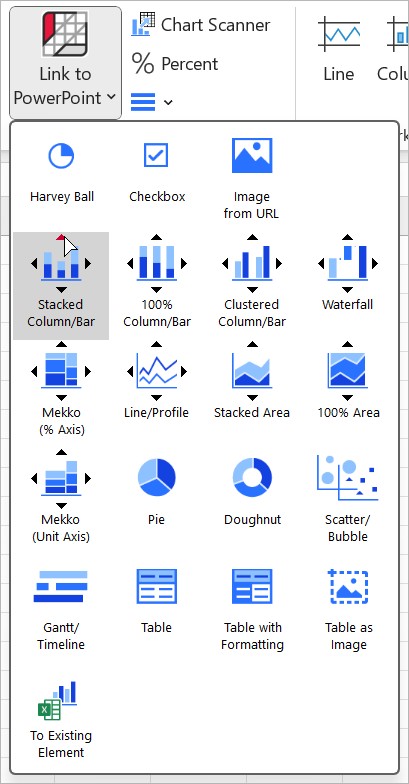
When you click on this menu item in Excel, the PowerPoint window is activated. If PowerPoint is not yet running, it starts automatically. In PowerPoint, when the mouse pointer is on a slide, the familiar insertion rectangle appears.
Switch to the slide where you want to insert the chart, or insert a new slide, and place the chart as usual: Click once to accept the default size or click, hold and drag to change the chart’s initial size. For a detailed description on how to place, resize and align a new chart, please refer to Insert charts.
After insertion, the chart looks and behaves like a regular think-cell chart that has been created in PowerPoint. The Excel workbook containing the linked data will be indicated on top of the chart:
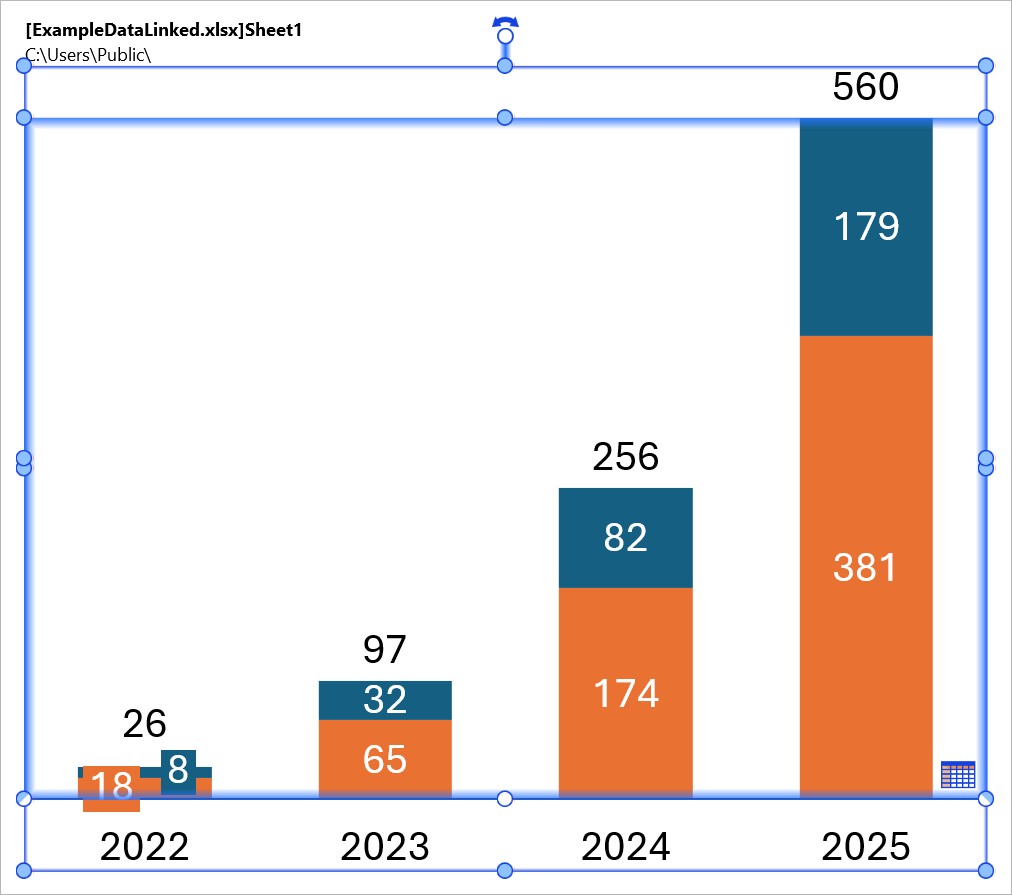
Please refer to Add and remove labels and Style and format charts to learn how to configure and style the chart.
Note: If you use colored cell backgrounds in Excel, you can set those as the segment fill color in the linked chart by enabling Use Datasheet Fill on Top in the chart’s color scheme control (see Chart fill scheme). This can be especially powerful when you combine it with Excel’s conditional formatting.
As well as creating a new chart, you can link a selected data range in your Excel workbook to an existing chart in a PowerPoint presentation. Simply click the 
Compile linked Excel data
When creating charts directly from Excel, you probably already have your data in Excel. In some cases, however, you may not wish to create a chart using all the data you have in your Excel sheet. Alternatively, the data may be in a fixed format that can not be easily altered.
You can modify the interpretation of the linked range to better fit your data layout (see Transpose and edit the data layout of linked ranges). Sometimes, you may need more ways to compile and control the linked data. Here are a few suggestions that may help you in such situations:
- Place the think-cell data link frame in an empty area on your Excel worksheet. Then use Excel’s cell references to populate the think-cell frame with data from elsewhere on the worksheet. E.g., enter
=B5in cell F8 to update F8 whenever B5 changes. - Excel cell references also work across worksheets. Adding a dedicated worksheet as an interface sheet for all charts can be helpful in particular if you have many charts to link.
- Using a dedicated sheet as the source for your charts also helps to prepare the data specifically for the intended purpose. For example, you can use think-cell round to consistently round the data before presenting it in a chart (see Excel data rounding).
- You can simply hide entire rows or columns of data from being reflected in the chart by using Excel’s Hide command. Keep in mind that the hidden data will appear in the chart as soon as you use Excel’s Unhide command and update the chart.
- Similarly, you can use Excel’s Group and Outline function to hide data that you do not want to display in the chart.

Create tables from Excel
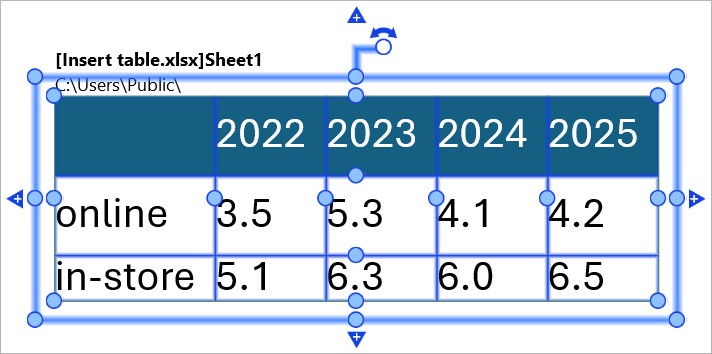
There are three ways to recreate your Excel table as a think-cell element in PowerPoint:
To update tables or adjust their update settings, see Manage the data in linked elements and Manage linked data with the Data Links dialog. To format tables, see Format tables.
Insert tables
To create a think-cell table from Excel, follow these steps:
- In Excel, select the that cell range you want to include in the table.
- On the Insert tab, in the think-cell group, select Link to PowerPoint > Table.
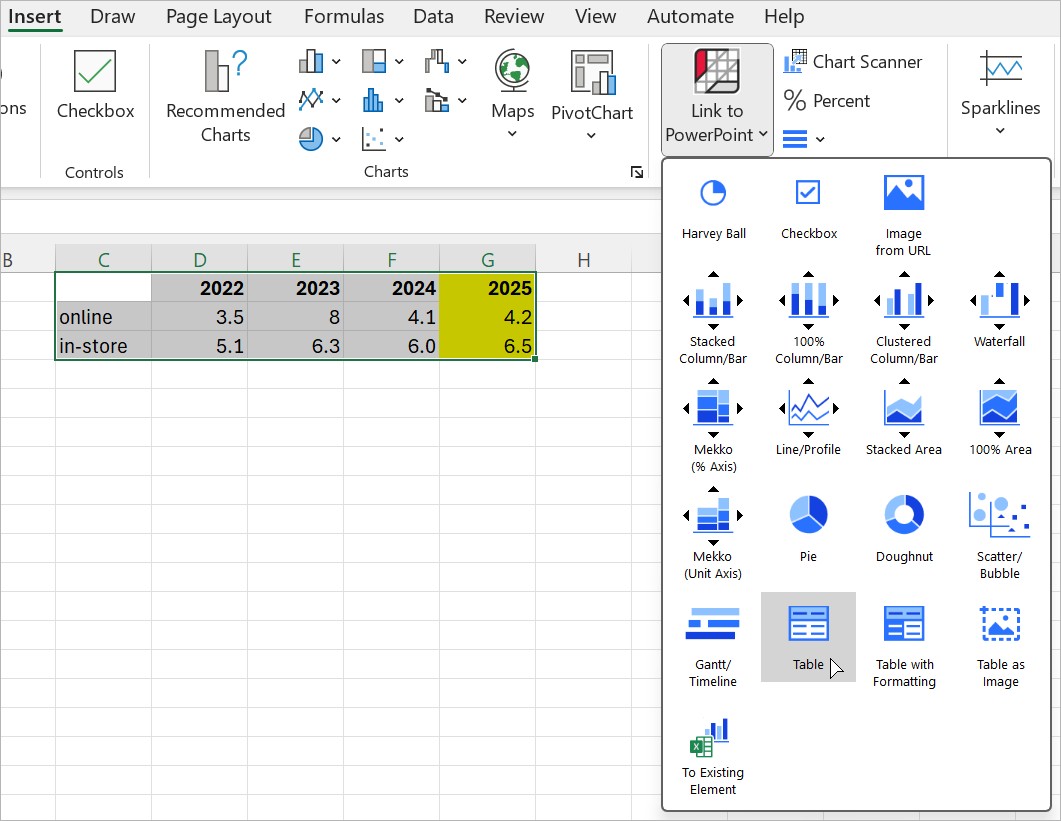
- PowerPoint will open. Place your table on a slide.
Insert tables with Excel formatting
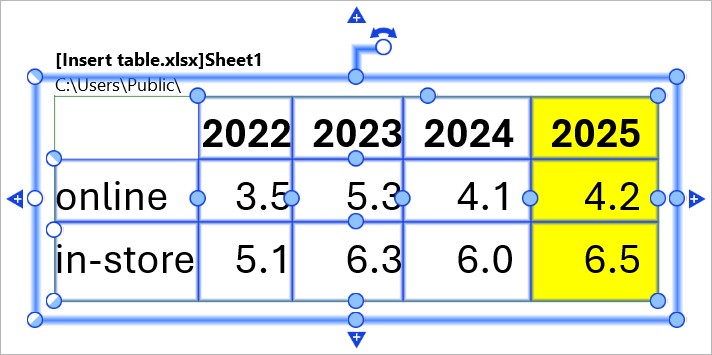
Insert a table in which most formatting options—such as font style, fill color, and text alignment—initially match those specified in your Excel sheet. For more information, see Match element formatting to the linked data range.
To insert a table with Excel formatting into your presentation, follow these steps:
- In Excel, select the cell range that you want to include in the table.
- On the Insert tab, in the think-cell group, select Link to PowerPoint > Table with Formatting.
- PowerPoint will open. Place your table on a slide.
Insert images of tables
Insert an image of a table that matches your Excel sheet pixel for pixel. Update the image from Excel like any other linked element (see Manage the data in linked elements). You can only edit the contents and formatting of an image of a table from its linked Excel sheet.
To insert an image of a table into your presentation, follow these steps:
- In Excel, select the cell range that you want to include in the table.
- On the Insert tab, in the think-cell group, select Link to PowerPoint > Table as Image.
- PowerPoint will open. Place your table on a slide.

Create text linked to Excel
You can add linked content from Excel to a chart label, think-cell text box, or PowerPoint text box. To do so, follow these steps:
- In Excel, select the cell that you want to link to.
- In PowerPoint, place the cursor in a label or text box.
- In PowerPoint, on the Insert tab, select Elements > Text Linked to Excel

To manage updates to the Excel data, see Manage the data in linked elements.
Create Harvey balls and checkboxes from Excel
You can create and control Harvey balls and checkboxes directly from an Excel workbook. To learn more about Harvey balls and checkboxes, see Harvey balls and checkboxes.
Create Harvey balls from Excel
To create a Harvey ball from Excel, follow these steps:
- In Excel, in an empty cell, enter one of the following:
- An absolute number between
0and the total number of Harvey ball segments - A percentage between
0%and100% - A formula that results in either an absolute number between
0and the total number of Harvey ball segments or a percentage between0%and100%
- An absolute number between
- Select the cell, then select Insert > think-cell > Link to PowerPoint > Harvey Ball

- In PowerPoint, insert the Harvey ball into your presentation.
Alternatively, to link the Excel cell to an existing Harvey ball in your presentation, select Insert > think-cell > Link to PowerPoint > To Existing Element 
To change the completion state of a Harvey ball from Excel, in the linked cell, enter another value or formula. To learn more about updating linked elements, see Manage the data in linked elements.
Create checkboxes from Excel
To create a checkbox from Excel, follow these steps:
- In an empty cell, enter a checkbox symbol shortcut or a formula that results in a shortcut:
- Empty checkbox (☐):
0or an empty space - Check symbol (✓):
1,v, oro - X symbol (✗):
2orx - Custom checkbox symbol: the symbol shortcut that you specified in your think-cell style file (see Customize the default checkbox styles)
- Empty checkbox (☐):
- Select the cell, then select Insert > think-cell > Link to PowerPoint > Checkbox

- In PowerPoint, insert the checkbox into your presentation.
Alternatively, to link the Excel cell to an existing checkbox in your presentation, select Insert > think-cell > Link to PowerPoint > To Existing Element 
To change the checkbox symbol from Excel, in the linked cell, enter another checkbox symbol shortcut or formula. To learn more about updating linked elements, see Manage the data in linked elements.
Add images from Excel
You can add images to your presentation from Excel by linking cells that contain image URLs to PowerPoint. To add an image from Excel to your presentation, follow these steps:
- In Excel, in an empty cell, enter the URL of the image that you want.
- Select the cell that contains the URL.
- On the Excel ribbon, select Insert > think-cell > Link to PowerPoint > Image from URL. PowerPoint opens.
- In PowerPoint, insert the image on your slide (see Insert elements).
You can also replace an image on your slide with an image in Excel. To do so, follow these steps:
- In PowerPoint, select the image that you want to replace.
- In Excel, select the cell that contains the URL of the image that you want.
- In PowerPoint, on the ribbon, select Insert > think-cell Data > New Excel Link.
The image in the Excel cell replaces the image that you selected on your slide.
