Content hub
Welcome to the think-cell blog!
At the think-cell blog, we're obsessed with PowerPoint and helping people not only make better presentations, but enjoy themselves doing it. We explore grand topics like data visualization best practices and the principles of effective storytelling, but we also provide hands-on advice and practical tips that will make your life easier and give your business presentations real impact.
If you're looking for C++ insights and conference reports, head over to our developer blog.
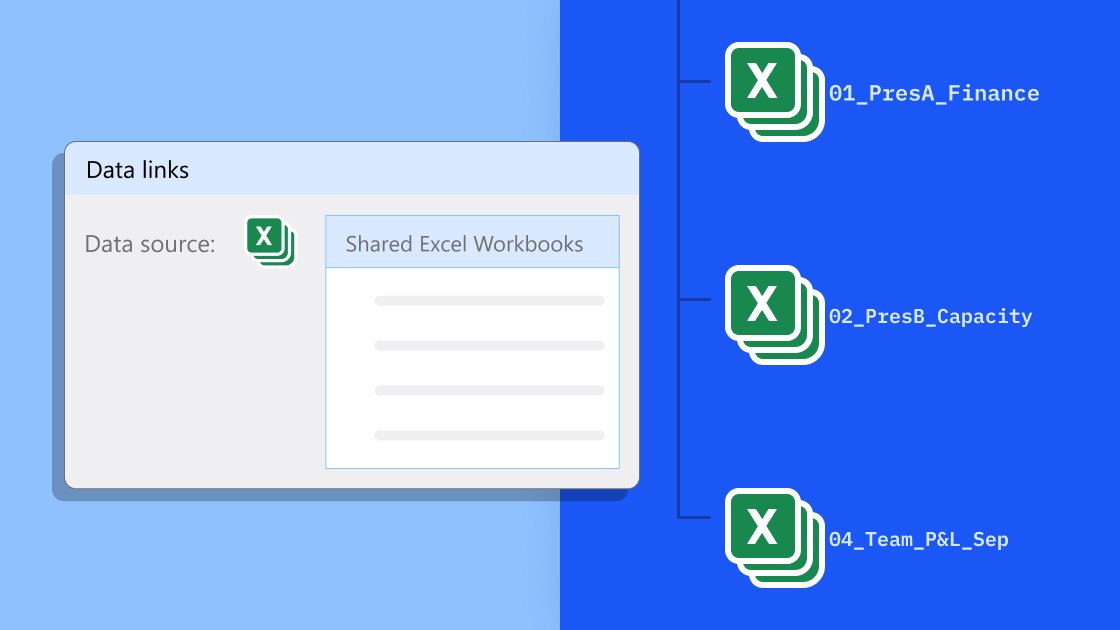
Learn how our switch from passive link management to active link management gives you complete control over how you display and update Excel data in PowerPoint.
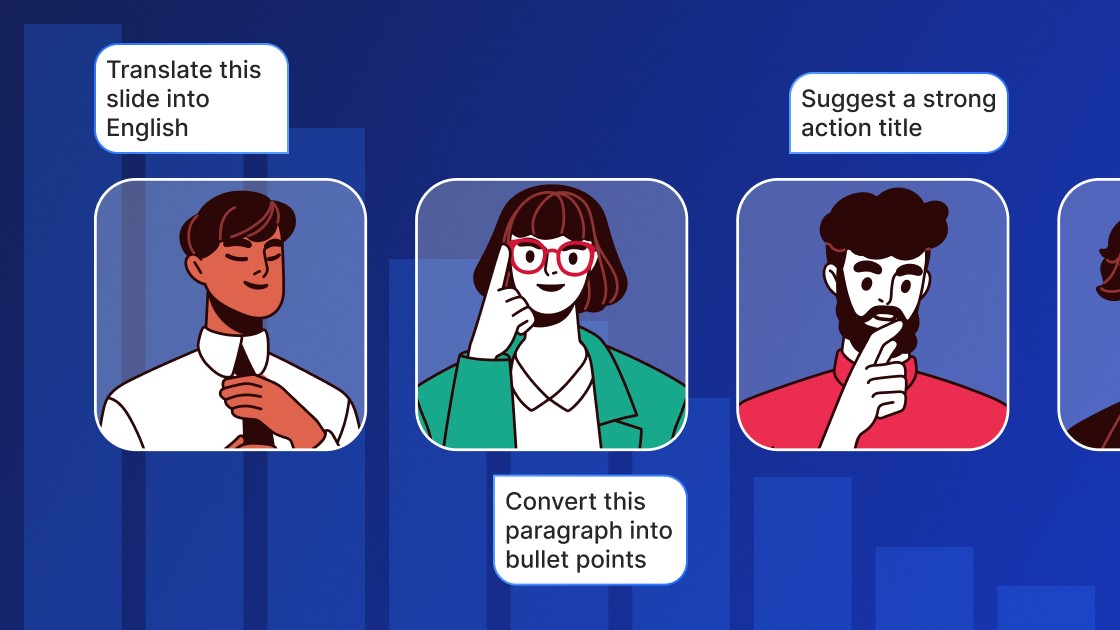
How think-cell employees use AI when building presentations, from stress-testing a narrative before the first slide to writing action titles at the end.

Learn about the most important trendlines and discover how to create them in Excel and in PowerPoint with think-cell.
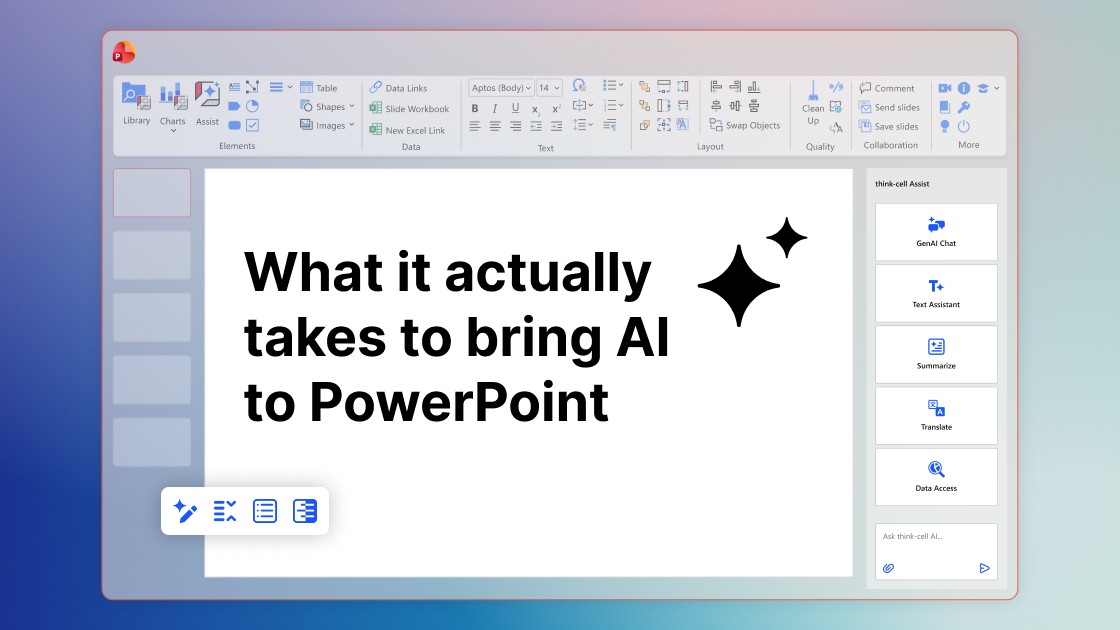
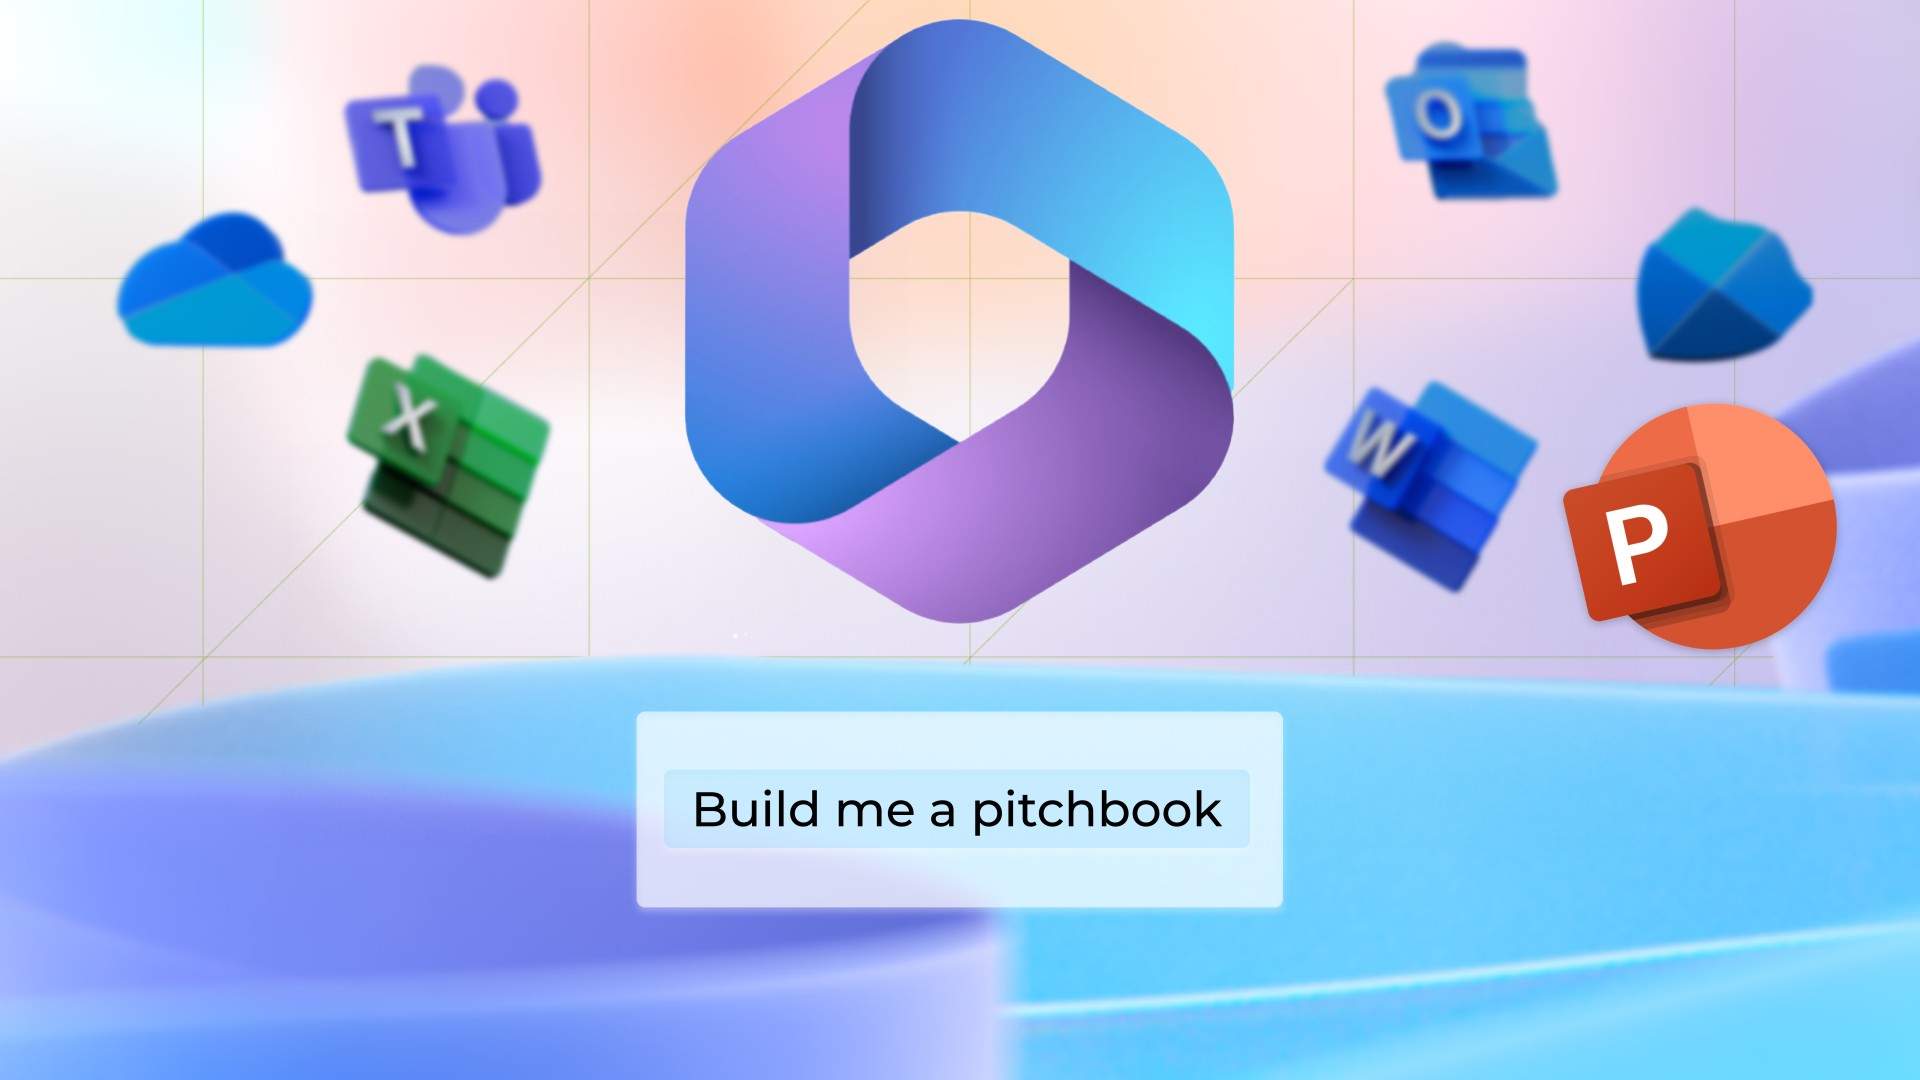
Why do AI-generated PowerPoint slides fall short for professional users? think-cell's CEO breaks down the technical hurdles and the opportunity ahead.
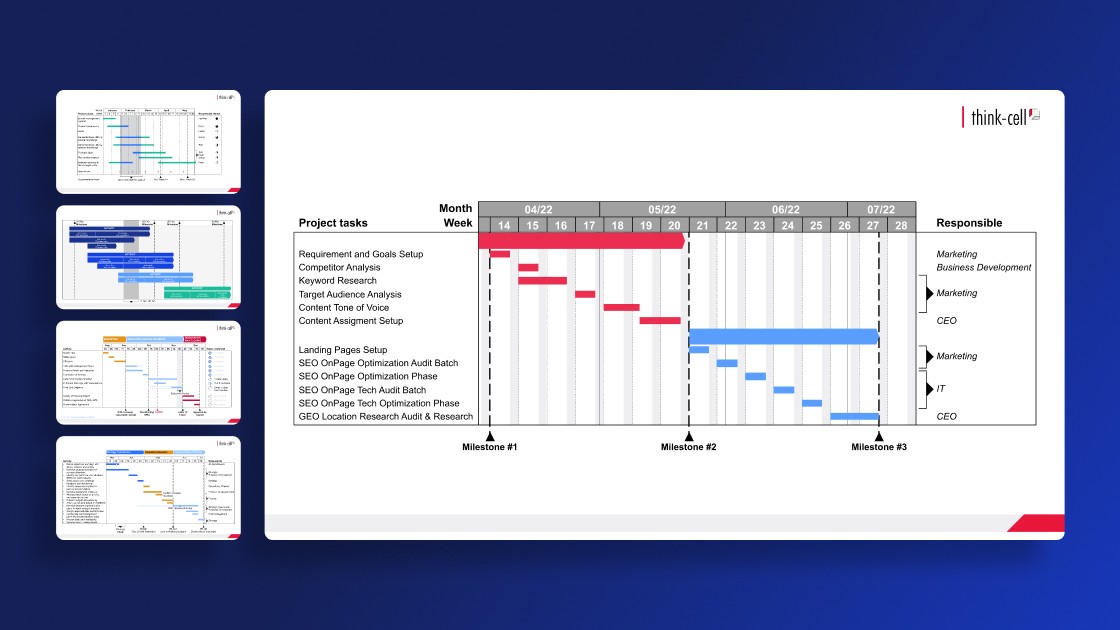
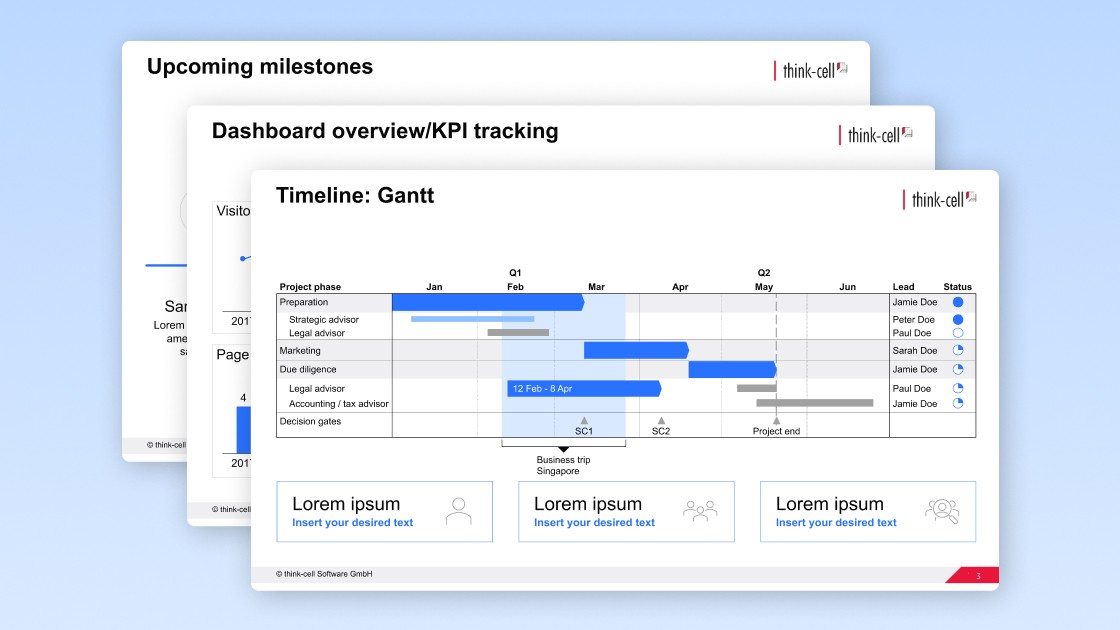
Complex projects are often best visualized with a Gantt chart. To help you build better project timelines, we’ve answered the biggest questions about Gantt chants.
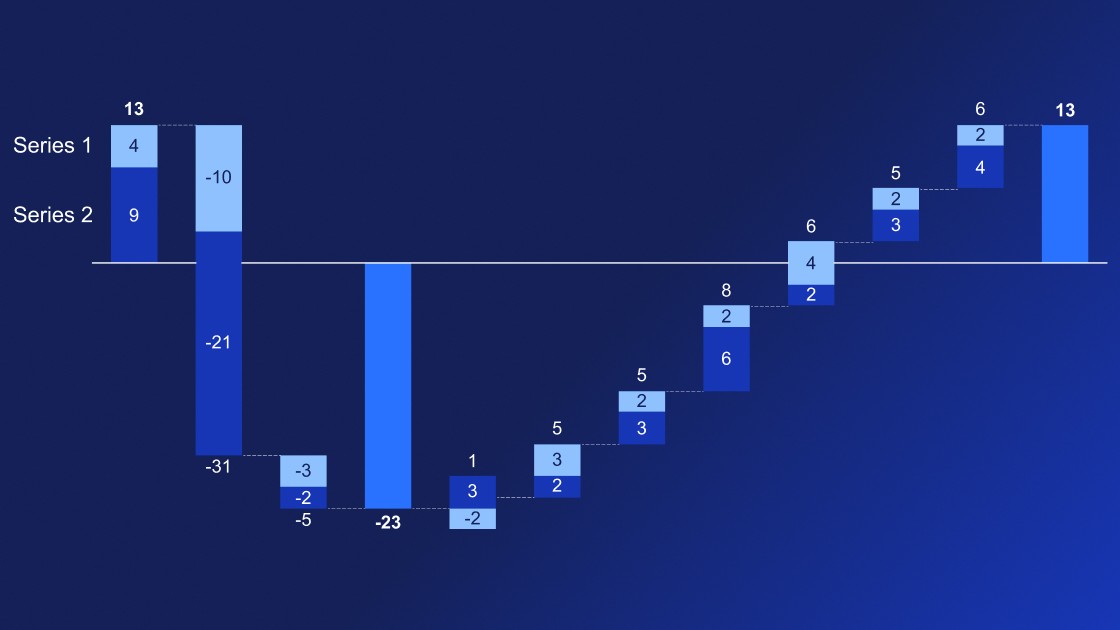
Learn how to use multiple series waterfall charts to tell a powerful, multi-layered story of how different factors contribute to an overall total.
Get your free PowerPoint project planning template giving you a complete outline you can easily edit for your business presentations.
Five practical ways to turn cluttered data slides into clear, story-driven visuals that land with your audience.

Learn the step-by-step process of building a box and whisker chart, from which chart type to use and how to adapt it to make a professional data visualization.

Read this article about the 2nd edition of the 2025 think-cell Global Case Competition to learn about the winners and their winning presentations.
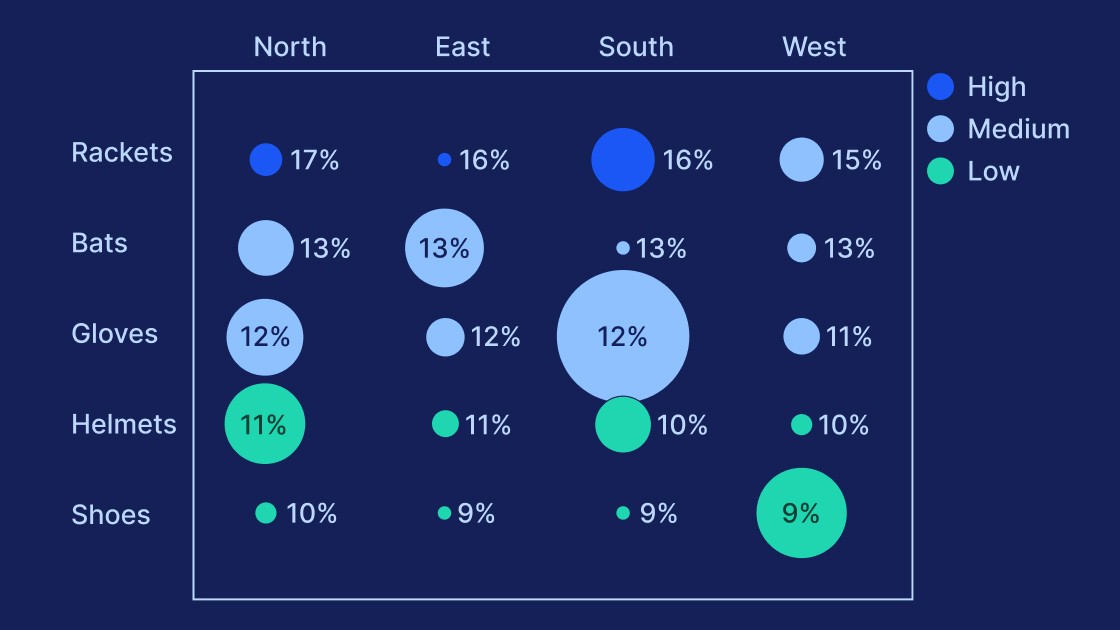
Learn the process of building a bubble chart matrix step by step, from setting up the matrix and entering your data to formatting a professional visualization.
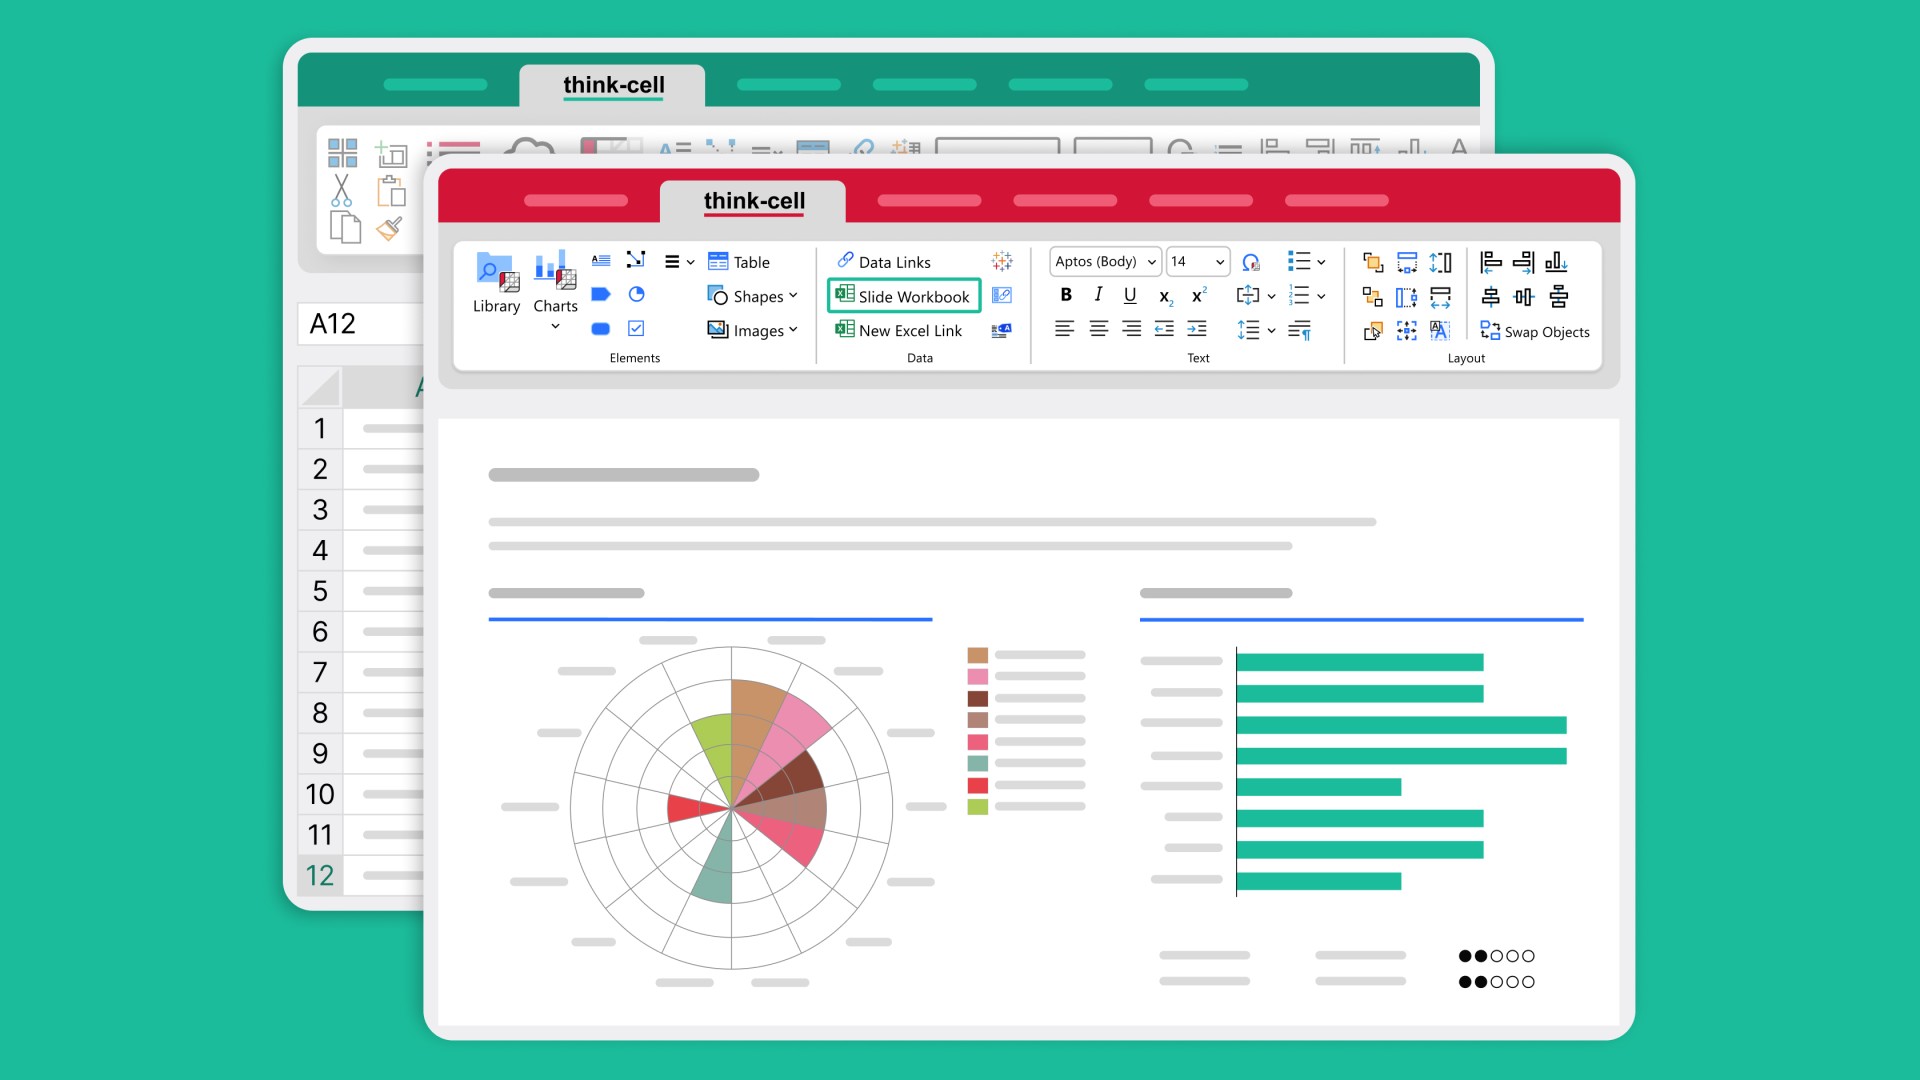
Learn how slide workbooks can change the way you build data-heavy presentations by combining the flexibility of ad-hoc datasheets with full Excel functionality.

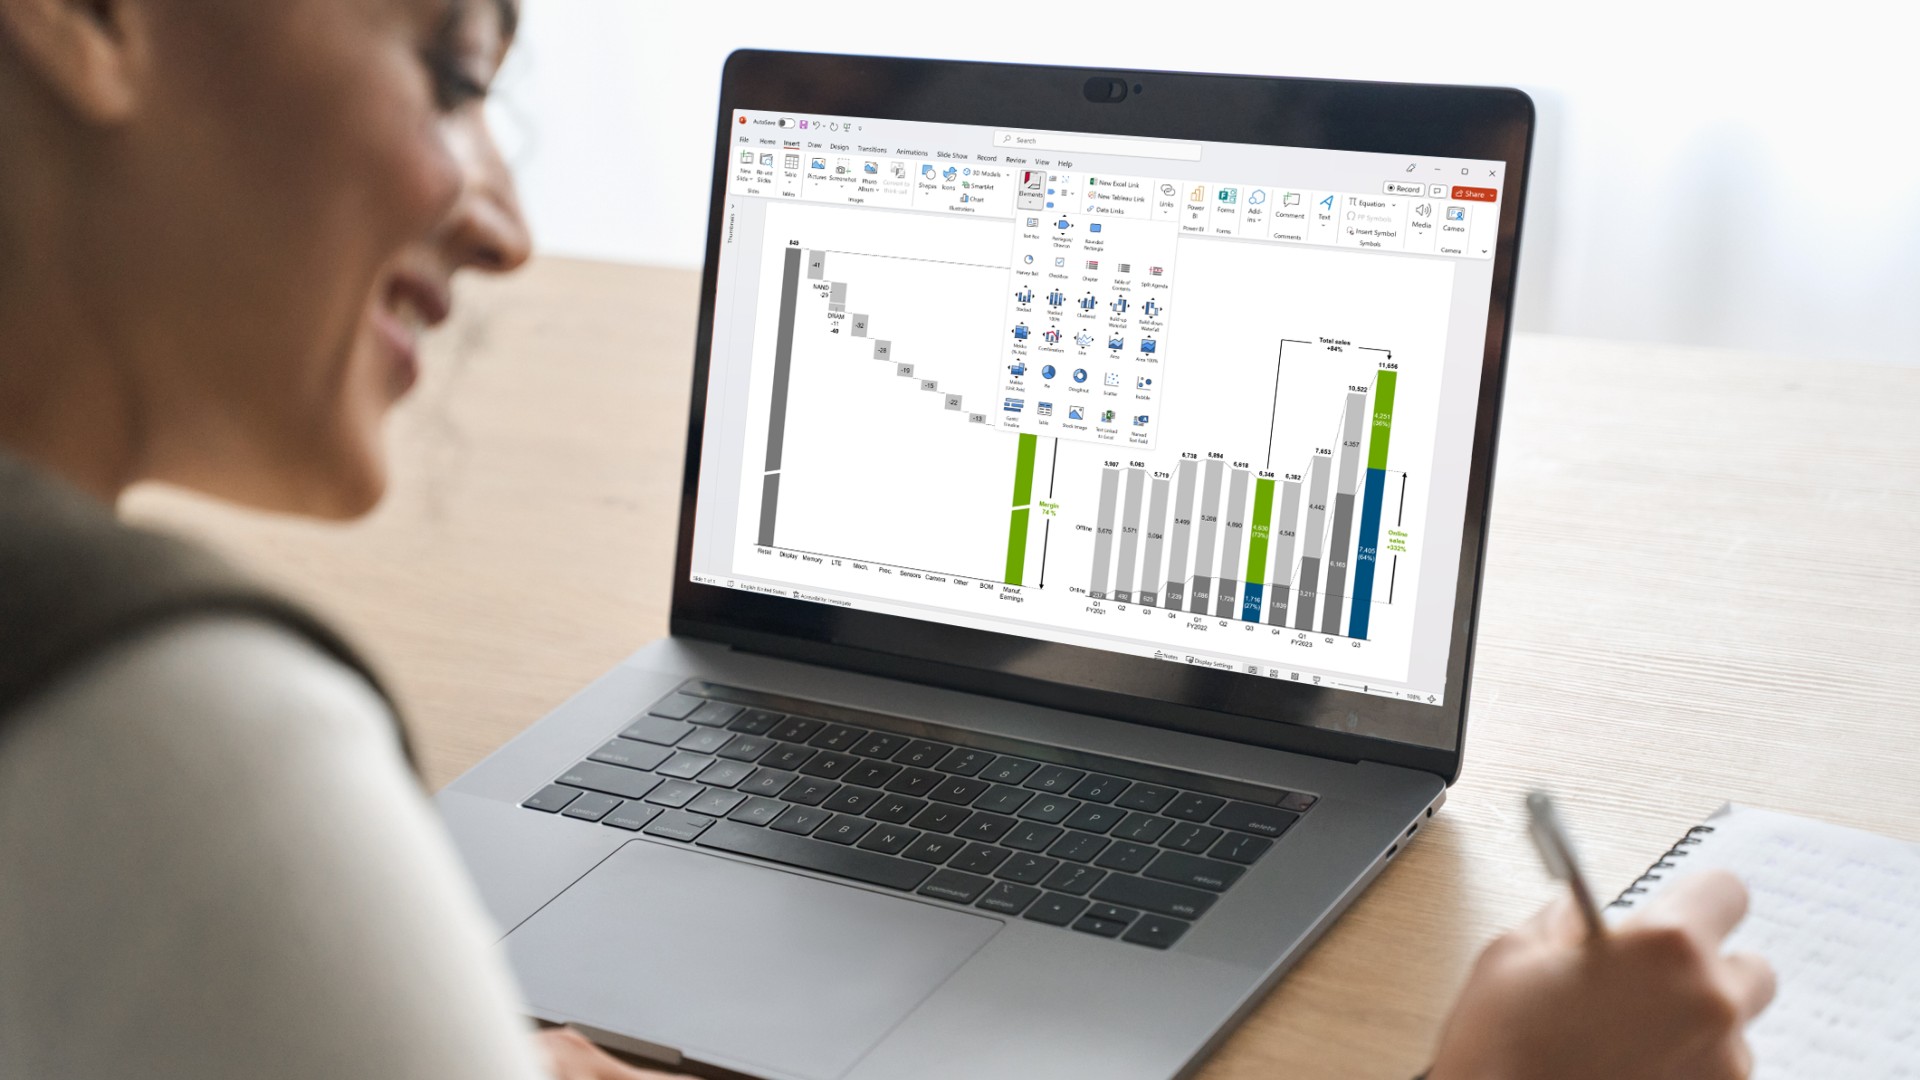
See five new think-cell 14 features that cut down time on formatting, layouts, and data prep so you can focus on your presentation's message.
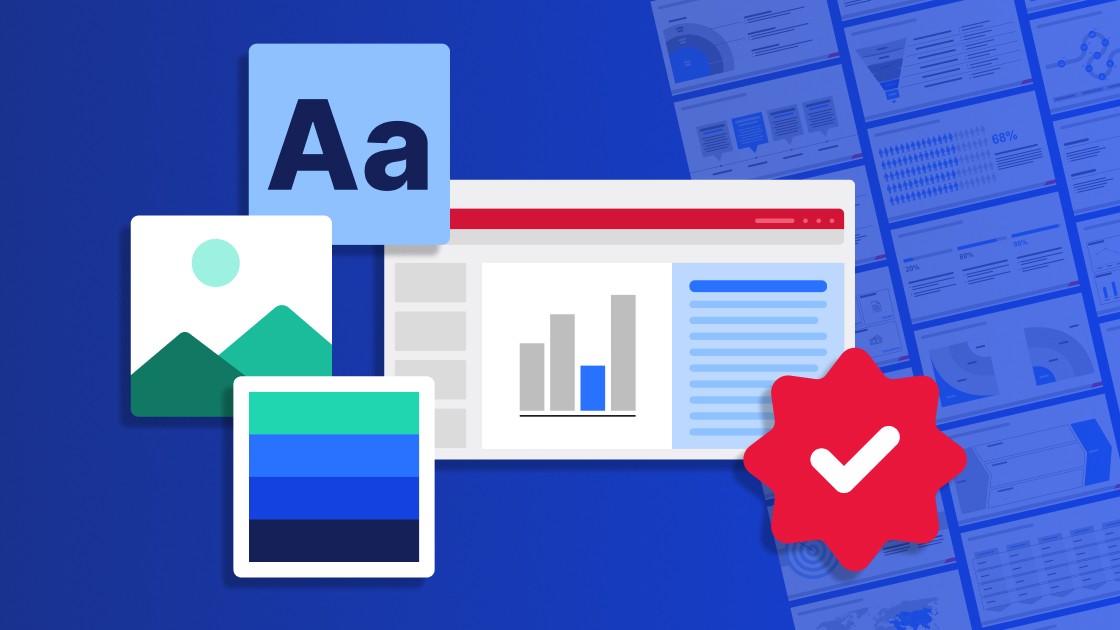
Learn the value of corporate identity and brand compliance in PowerPoint presentations and discover how think-cell helps teams effortlessly stay 100% on-brand.
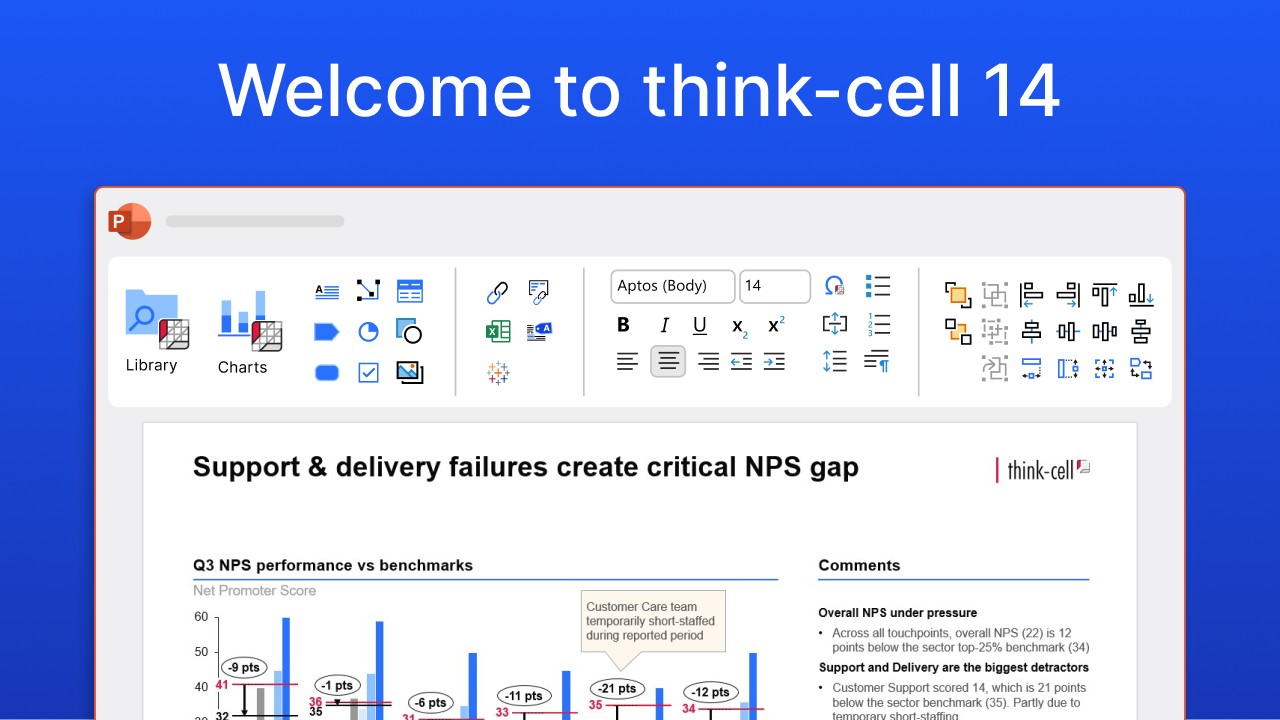
Read about the launch of think-cell 14, a new version of our flagship PowerPoint productivity software, think-cell Suite, which introduces a set of powerful innovations to save users time and give them more versatility in their PowerPoint worfklows.
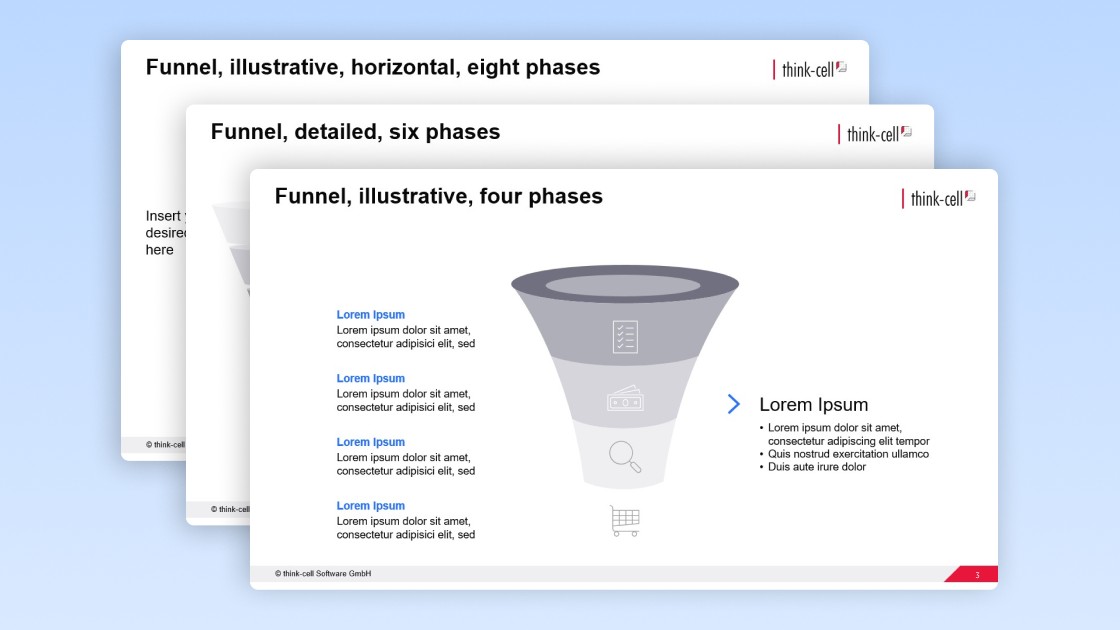
Get your free PowerPoint funnel chart template you can easily edit for your business presentations.
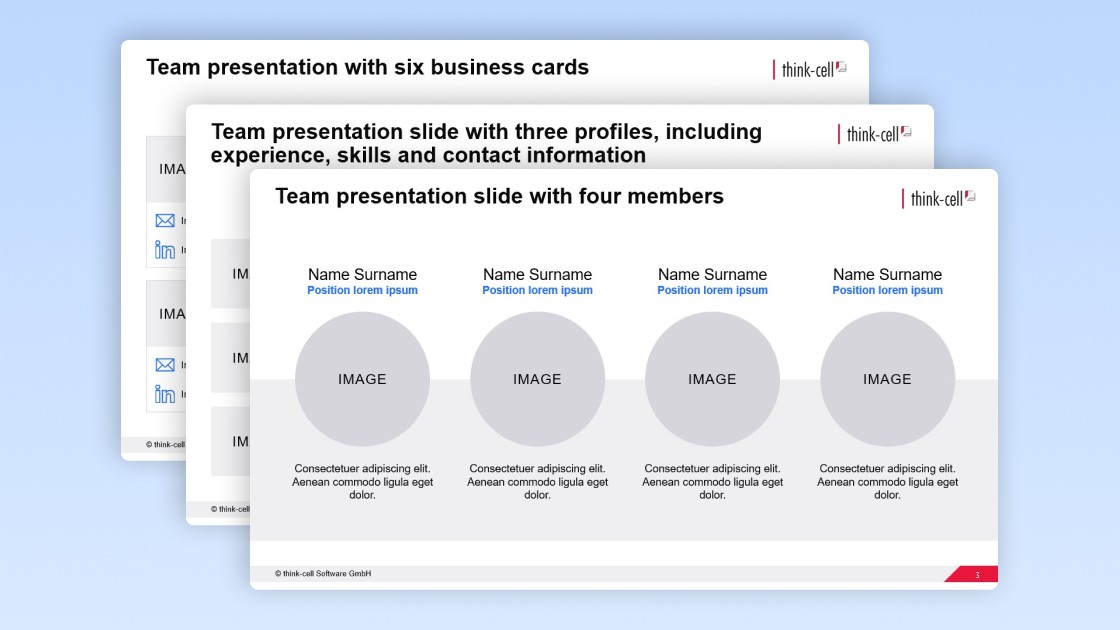
Get your free PowerPoint team presentation template you can easily edit for your business presentations.
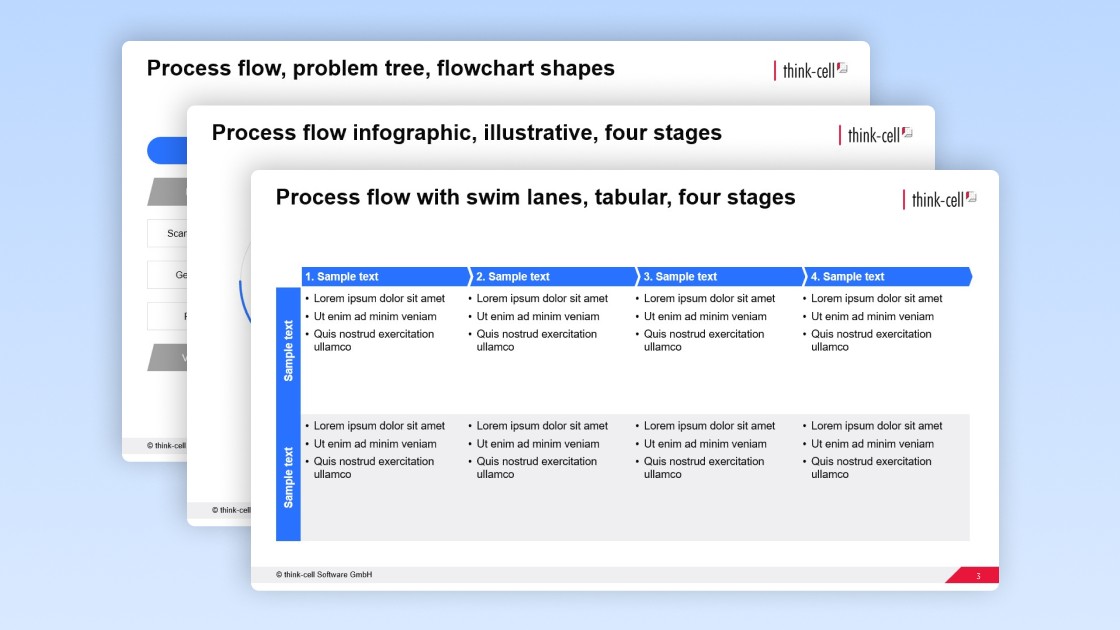
Get your free PowerPoint process flow template you can easily edit for your business presentations.
Use our PowerPoint cheat sheet to see the big impact small improvements can make and ensure every slide you build is polished and professional.

We walk you through the process of creating a Pareto chart, from structuring your data through to formatting and fine-tuning a professional data visualization.

Learn why Microsoft is deprecating Reuse Slides from PowerPoint and how you can easily find and reuse slides from existing presentations.
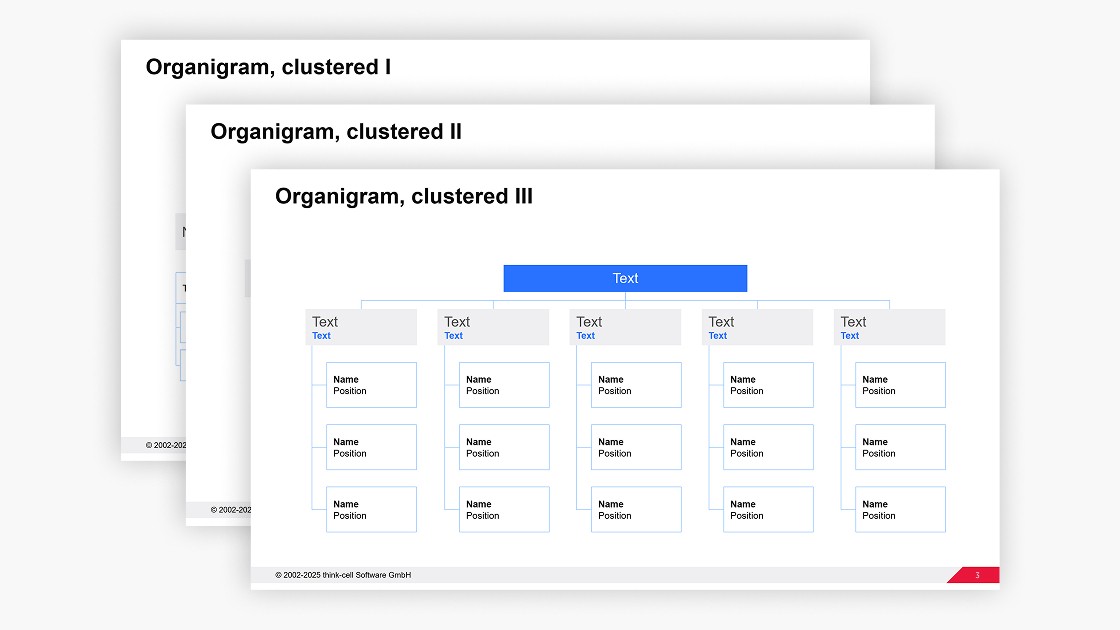
Get your free PowerPoint org chart template you can easily edit for your business presentations.
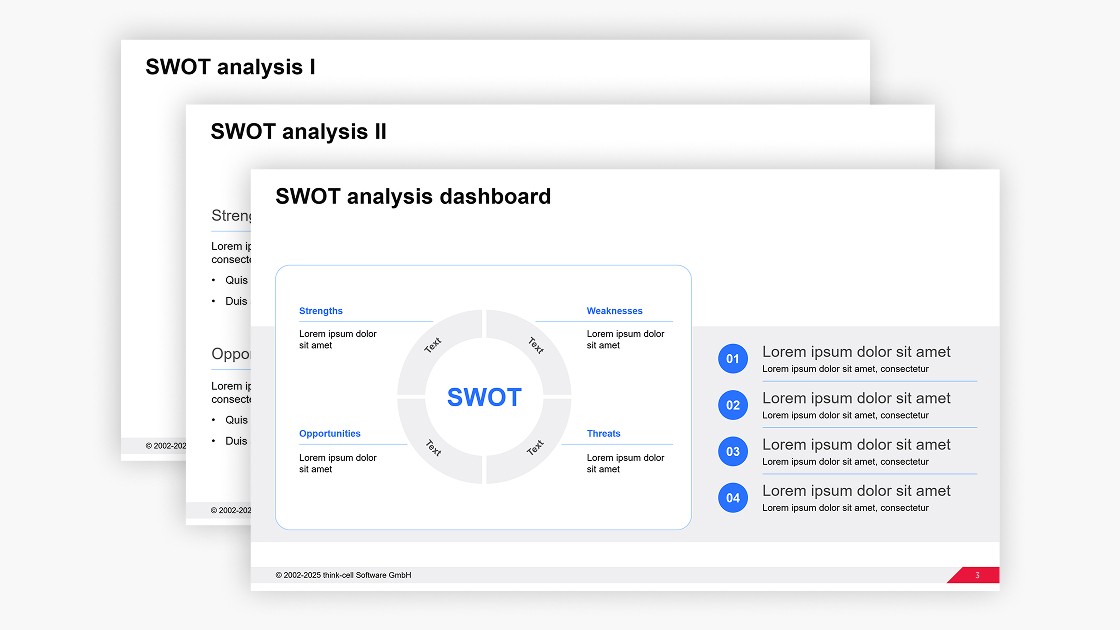
Get your free PowerPoint SWOT analysis template you can easily edit for your business presentations.
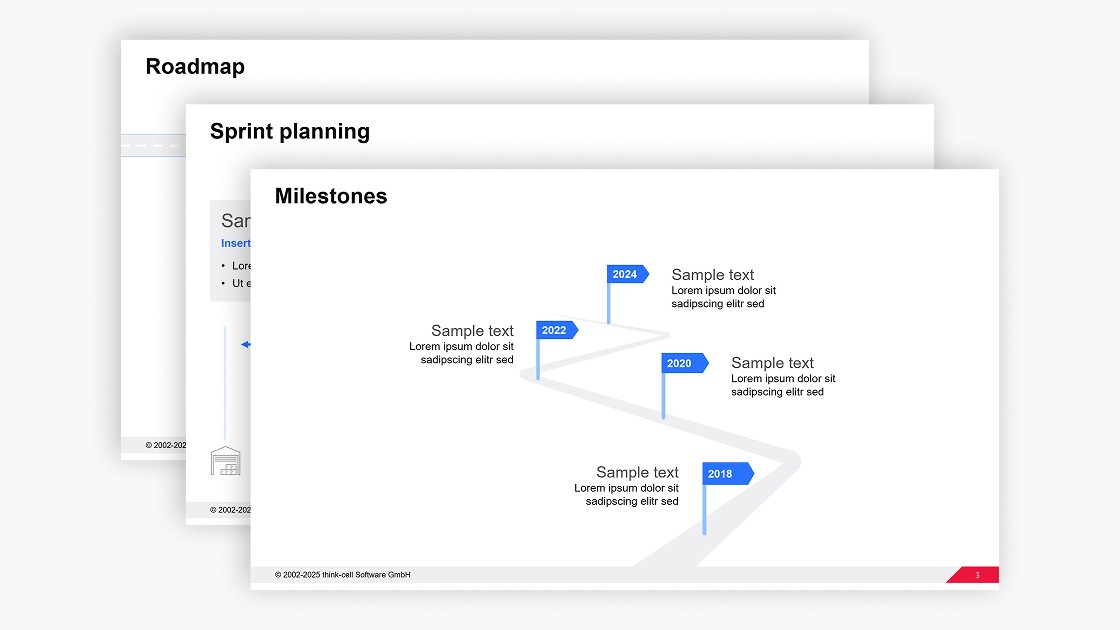
Get your free PowerPoint roadmap template you can easily edit for your business presentations.

Learn when to use pie charts in PowerPoint presentations and when to skip them. Practical guidance on slice limits, labeling, and common mistakes.
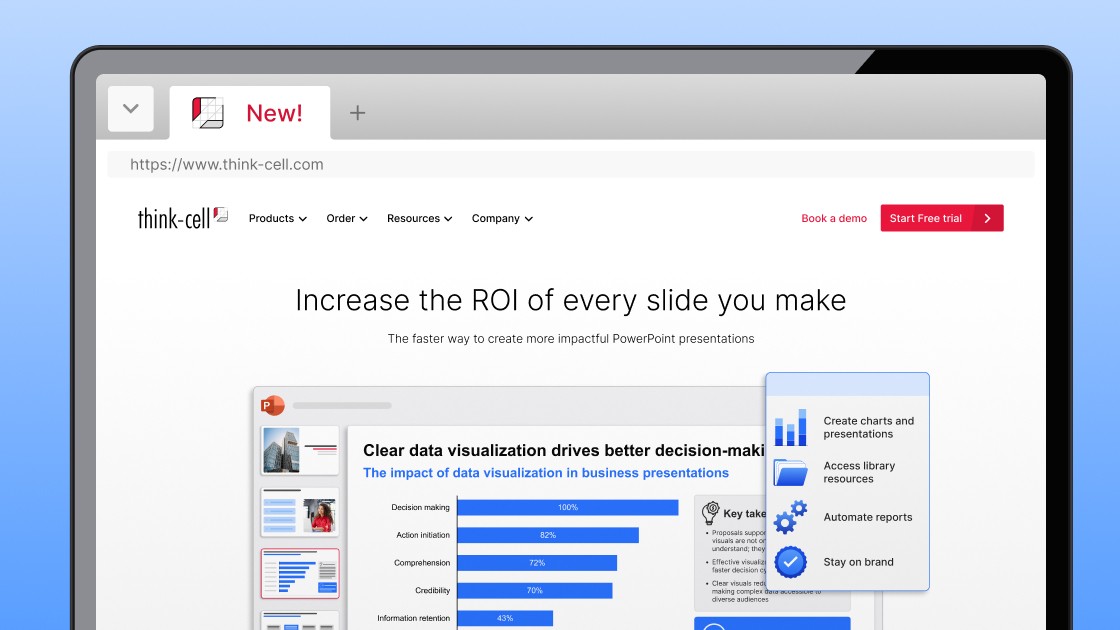
See what’s changed on think-cell.com! think-cell’s website relaunch comes with a new color palette, improved navigation and clearer product communication.
Read this wrap up article about the inaugural edition of think-cell Global Case Competition, where you learn about the winners and their winning presentations.
think-cell has appointed Adam Conlon as Chief Financial Officer and Chief Operating Officer effective July 2025.
Explore concrete examples that demonstrate how to make your business presentations stand out and learn common PowerPoint mistakes you should avoid.
Learn to turn your Excel pivot table analysis into professional charts you can insert into PowerPoint for automated reports and insightful ad-hoc presentations.
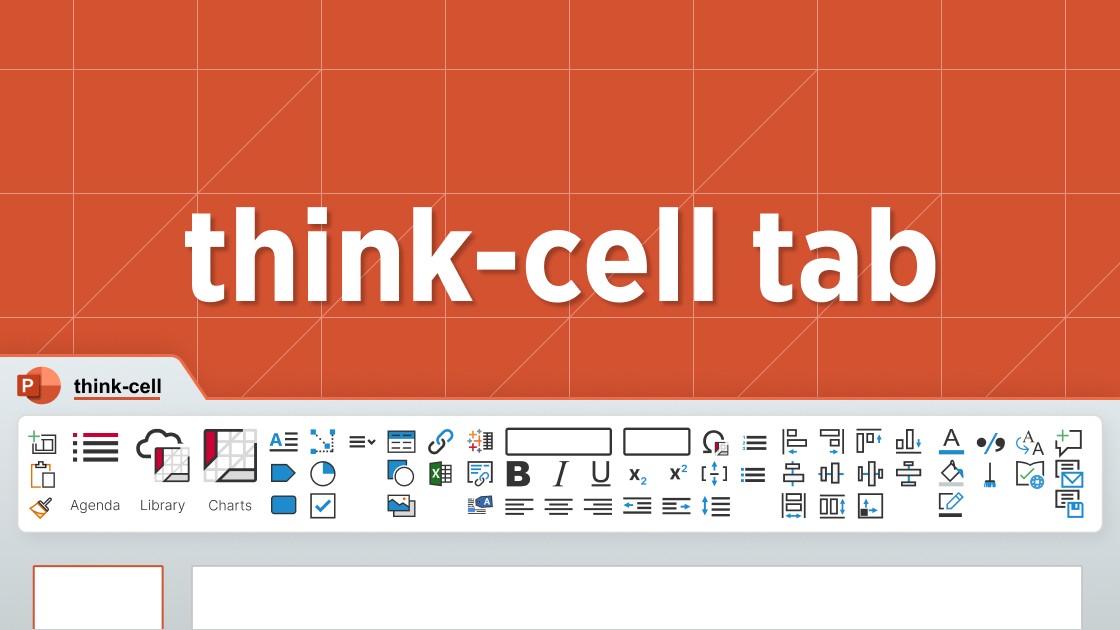
See how the think-cell tab can help you create professional PowerPoint slides more efficiently by making all the most important tools accessible in one place.
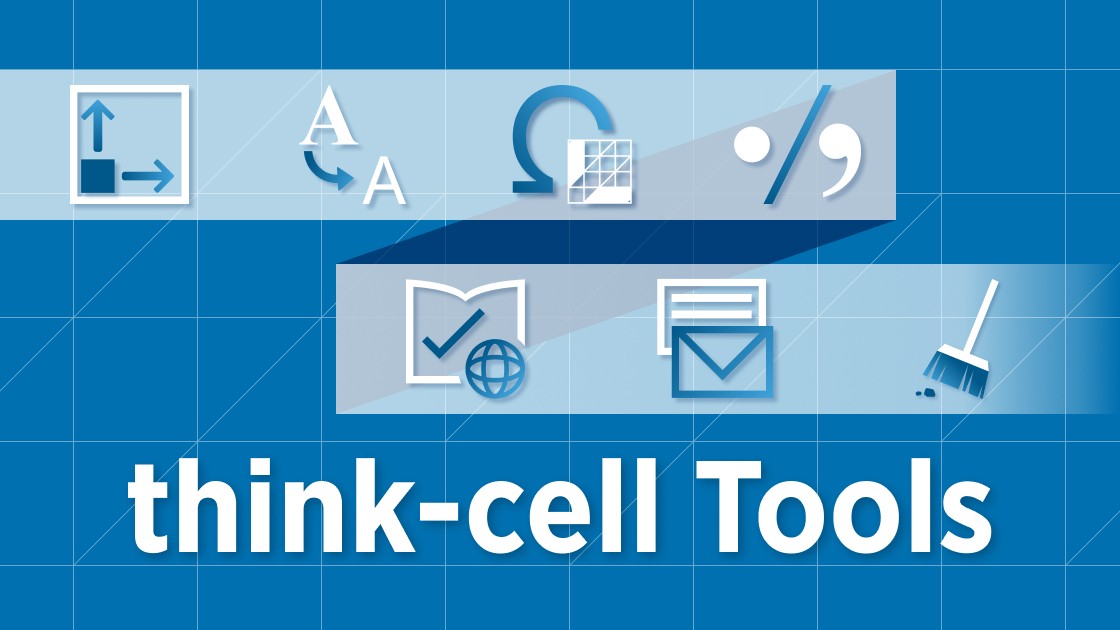
This article runs through 7 tools that will speed up your PowerPoint work and help you build polished slides faster, without compromising on consistency.
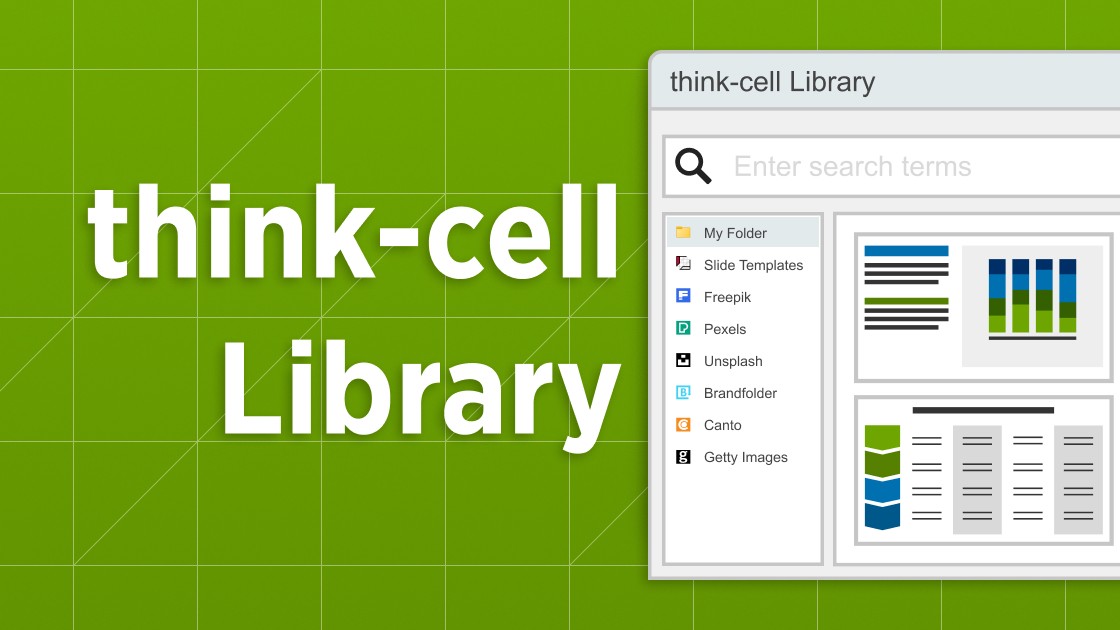
Explore the think-cell Library and see how you can save time, search effectively, and access a wealth of resources to ensure you never have to start your presentation from a blank slide again.
think-cell is proud to announce the launch of think-cell Suite, an expanded offering that goes beyond charts to support the whole presentation creation journey.

Discover the think-cell Suite and its comprehensive range of PowerPoint and Excel tools that support you along every stage of the presentation journey.

Learn what waterfall charts are, why they are effective, and how to create them in Excel or PowerPoint to convince your audience and help your decision-making.

Learn all about creating different types of PowerPoint timeline, including the best tools to use for making simple milestone charts and detailed project plans.
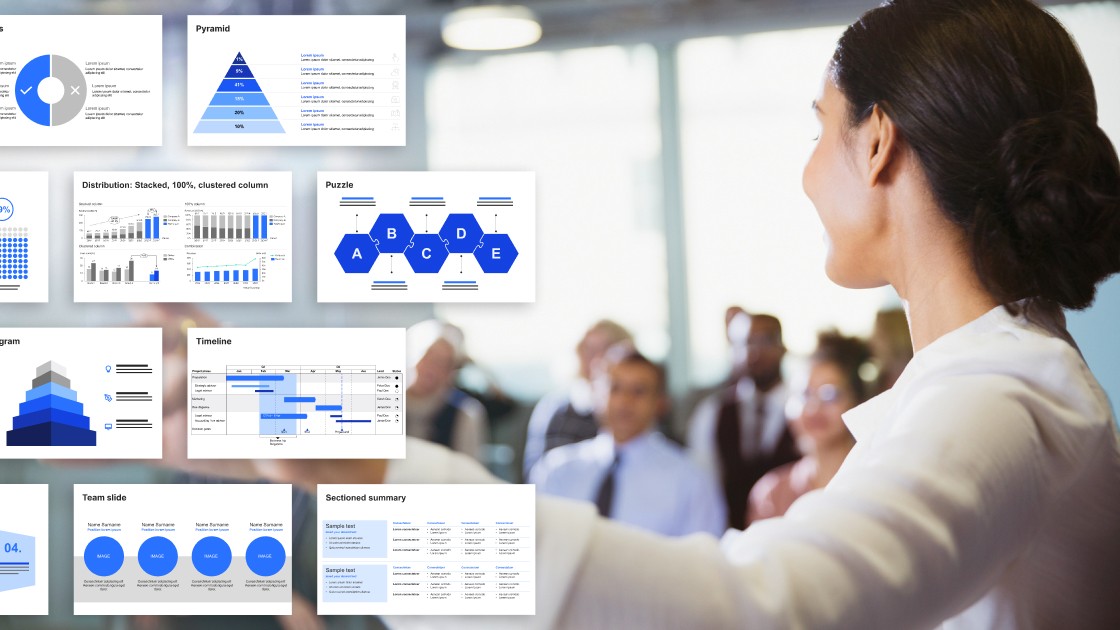
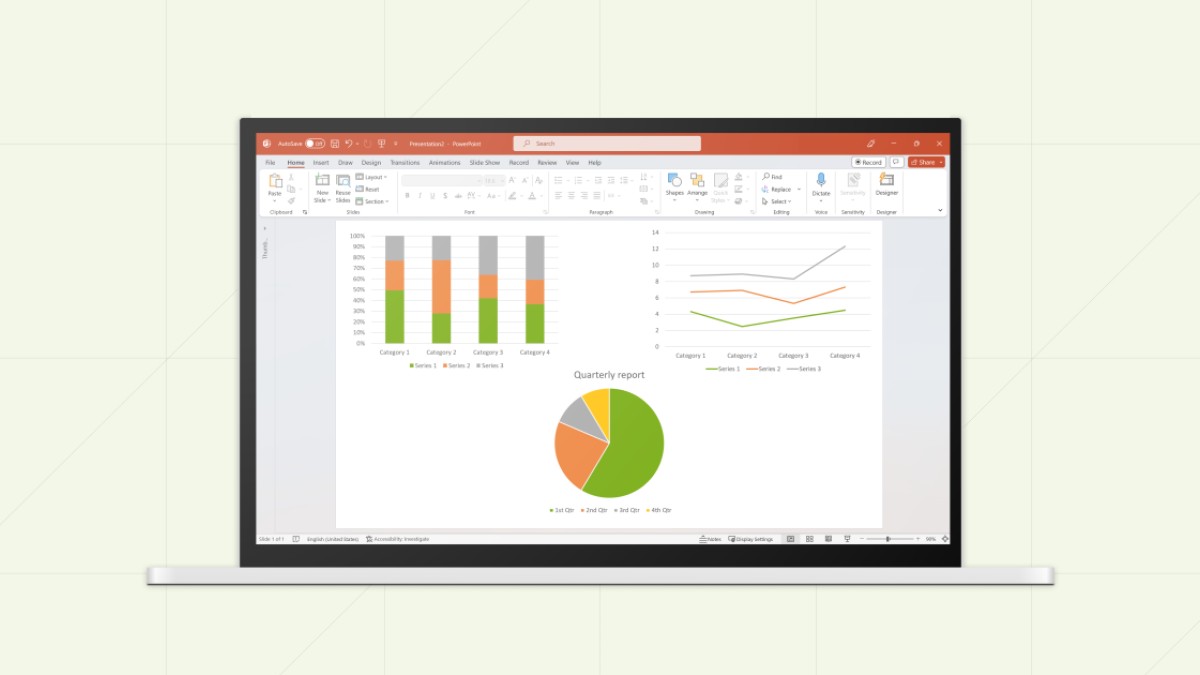
In the world of data analysis and presentation, finding the perfect visualization to convey your message is key. It's not just about presenting numbers; it's about telling a story that resonates with your audience. This blog explores how you can find the right visualization for your presentations.
think-cell, the leading productivity software for creating data-driven presentations in Microsoft PowerPoint, announces the appointment of Alexander von Fritsch as Chief Executive Officer (CEO), effective today.

think-cell successfully acquires AskBrian to boost workspace productivity even further
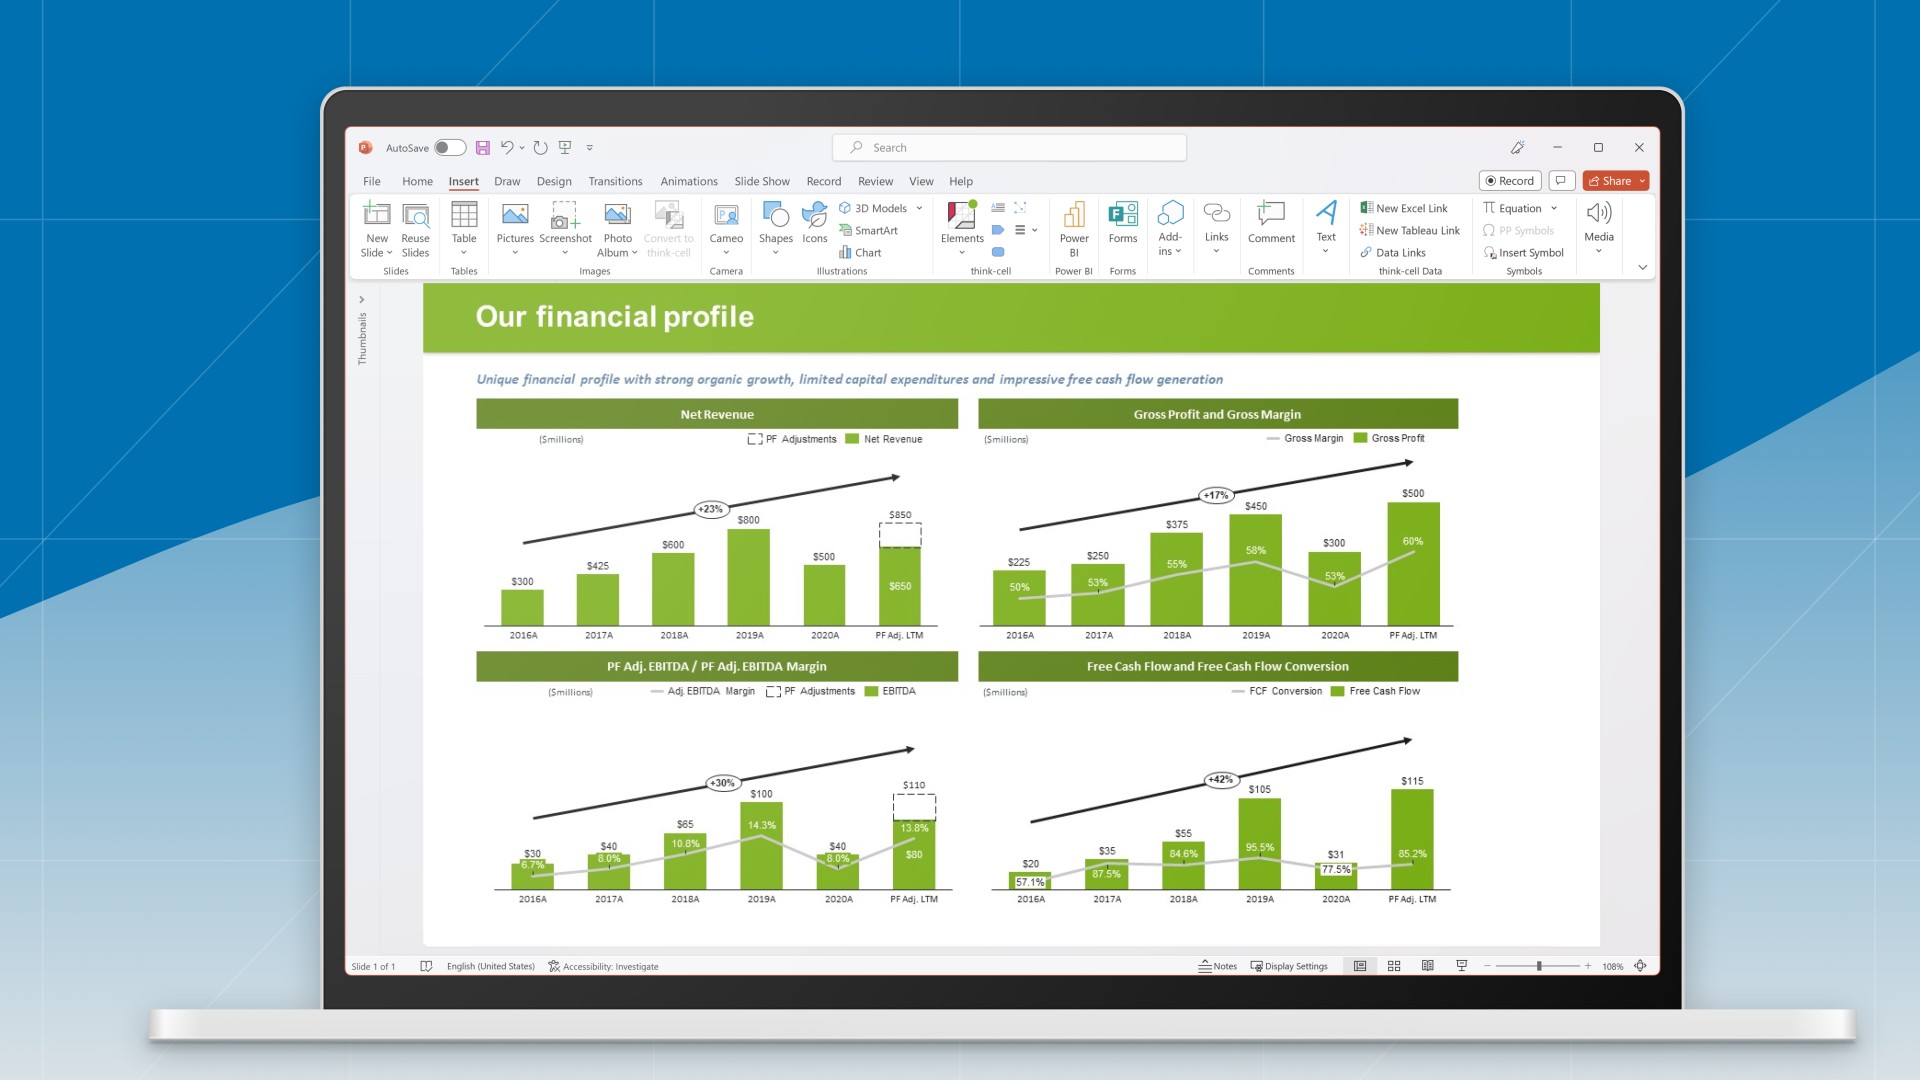
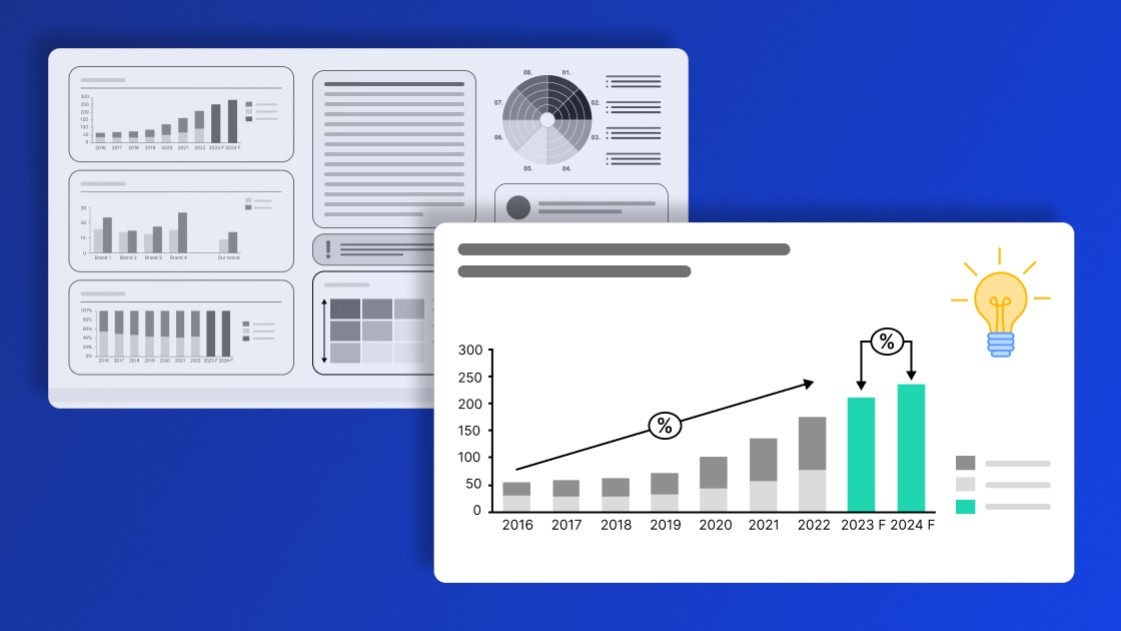
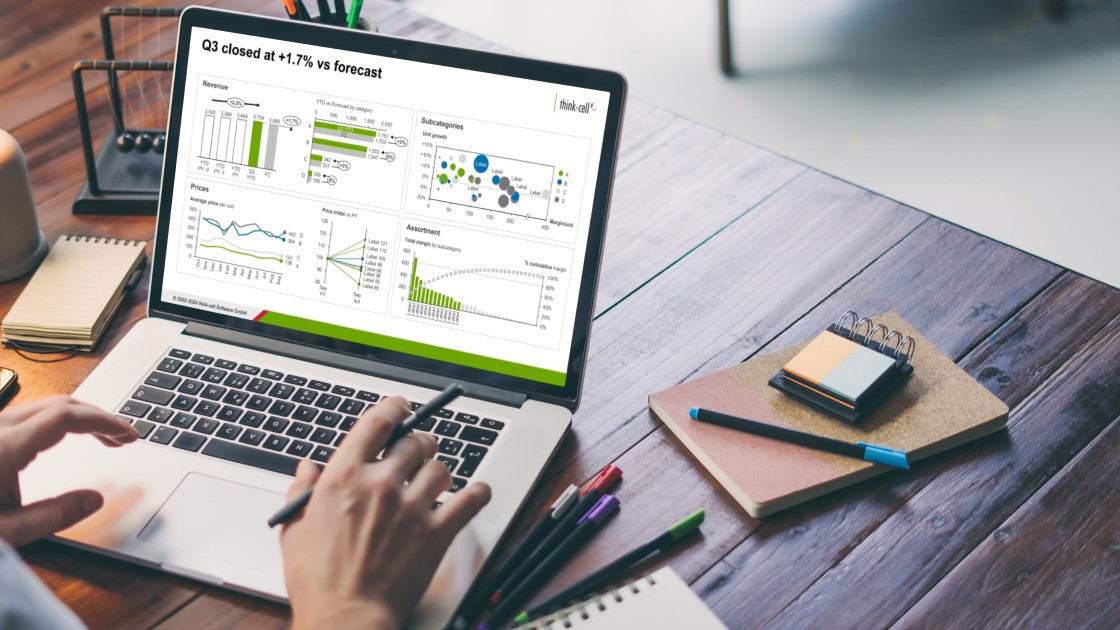
Clear, accurate FP&A dashboards are vital for consistent financial reporting. Read how FP&A professionals can design and automate dashboards to support business objectives.

FP&A scenario management is an essential mindset that modern organizations should adopt to plan and make quick, informed decisions in an uncertain environment. This blog offers guidance on how to move to a more agile and adaptable scenario management.

In this blog, we will explore the essential components, and the practical steps involved in creating compelling data-driven business stories.
Understand the importance of data visualization for business decision-making and learn how to visualize business data to make your presentations more impactful.
Let us explore Copilot, its potential impact on PowerPoint users, the importance of human interaction in the process and where we stand with Copilot.
Learn 7 steps for making an effective PowerPoint presentation, including how to structure your story, lay out your slides and create clearer, more impactful charts.
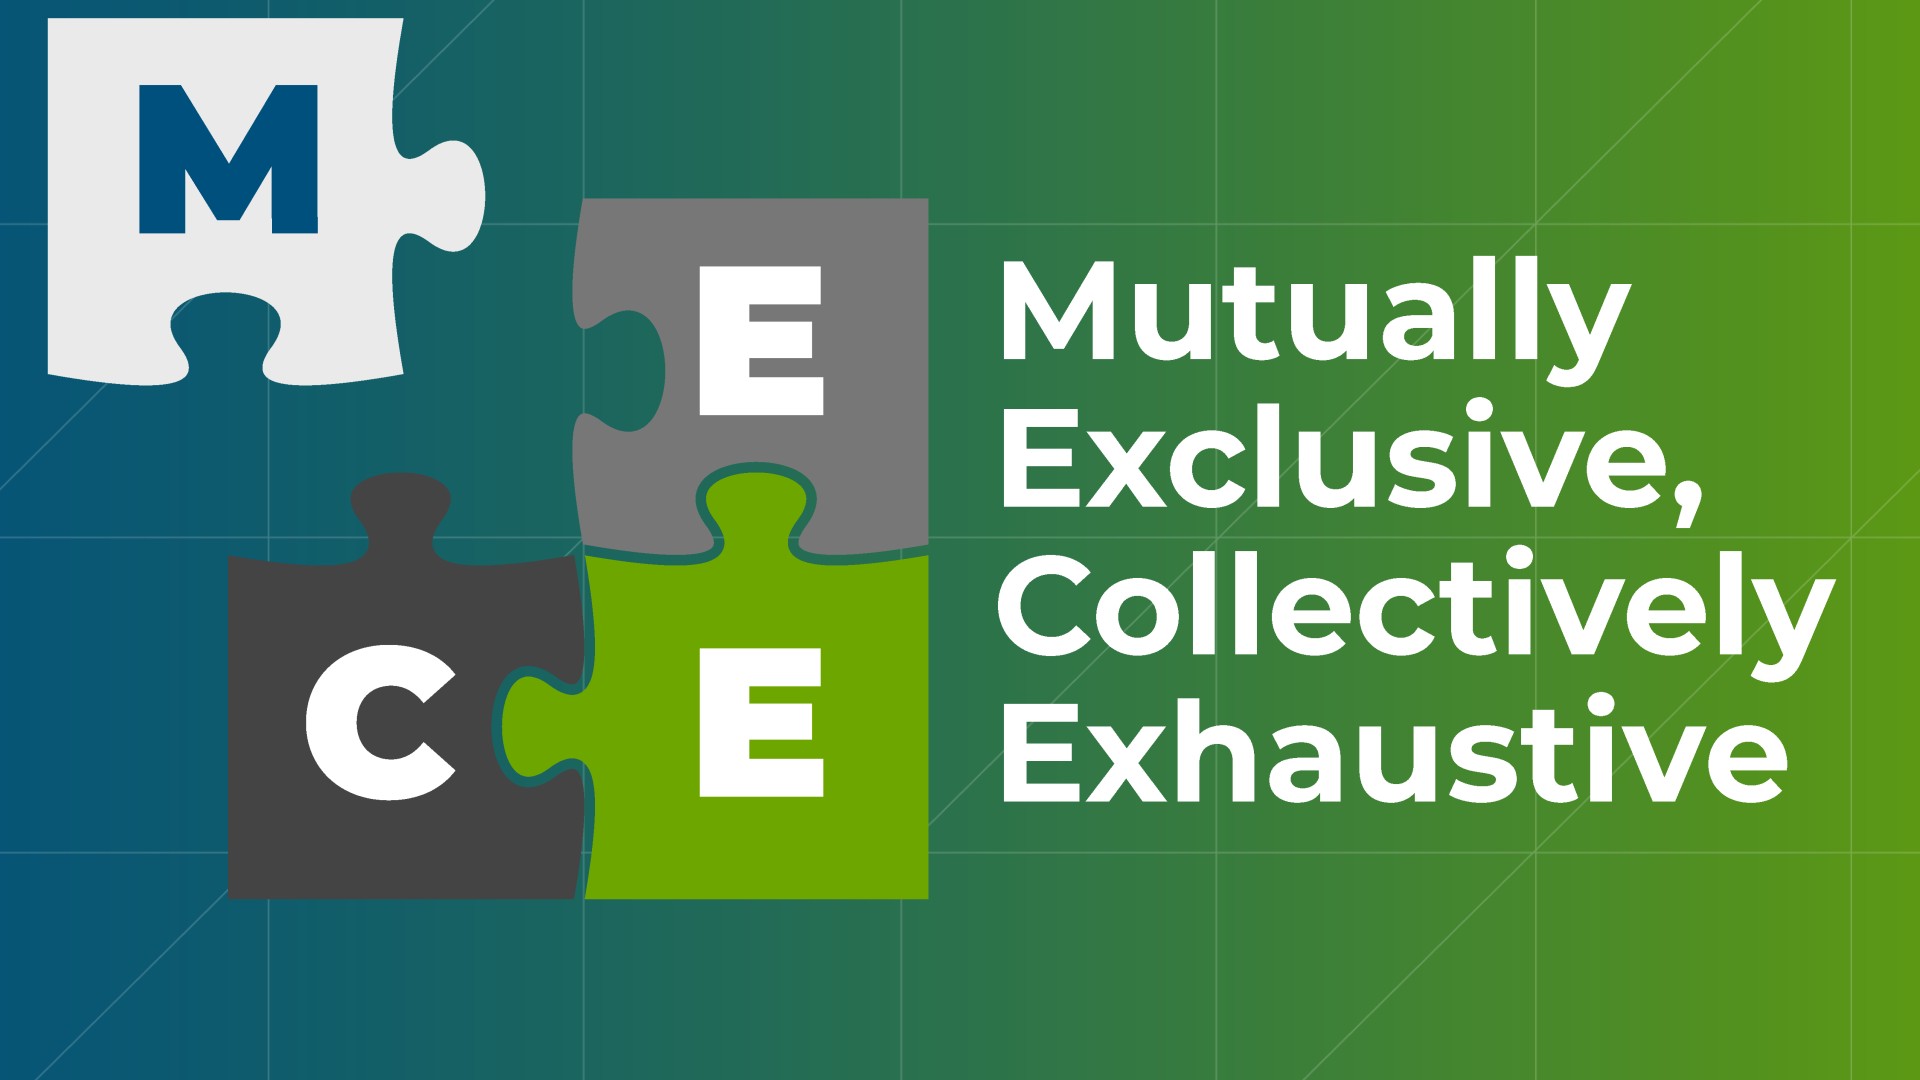
Learn about the MECE principle and examples of how to apply it, plus how to use it to create stronger PowerPoint presentations faster.

Presentations shape the conversations and decisions that move business forward. And by approaching them this way, you can accelerate your growth.

Learn how to use Barbara Minto’s pyramid principle of communication to create better organized PowerPoint presentations that tell your story more effectively.
think-cell brings full PowerPoint charting functionality to macOS for the first time. Same features, same interface, now on Windows and Mac.