think-cell 10 now runs on macOS
- Home
- Resources
- Content hub
- think-cell 10 now runs on macOS

1 min read
Berlin, May 3, 2019
On May 3rd, think-cell, the leading provider of productivity software for Microsoft PowerPoint users, proudly announced that it has launched think-cell 10, the first version of its signature software that empowers macOS users to create PowerPoint presentations with stunning charts and layouts in minutes.
"Today's knowledge workers and presentation professionals are at home both on macOS and Windows, and we now support our users on both of their favorite platforms," said Markus Hannebauer, think-cell co-founder and CEO. "In addition to supporting macOS, think-cell 10 comes in a fresh new look and brings many valuable new features."
"Porting a complex Windows Office add-in to Office for Mac is a really challenging task and required years of development", said Arno Schödl, co-founder and CTO at think-cell. "We are extremely proud to have done just that without sacrificing functionality, allowing users to focus on communicating and implementing recommendations instead of pushing around shapes on macOS as well as on Windows."

Now on macOS
After several years of development, we have achieved what no other company has done before – we have ported a complex Windows Office add-in to Office for Mac without sacrificing functionality! Your license for think-cell on Windows is also valid for macOS. think-cell 10 works with Microsoft Office 2016 for Mac version 16.9 or later, running on OS X Yosemite (10.10) or later.
With think-cell 10, you can now choose your favorite working environment and have the same great user experience. The interface is exactly the same and all features are available.
User Interface
With think-cell now branching across multiple platforms we took the opportunity to refresh the user interface. Icons in the Elements menu and context menu have a fresh new look.
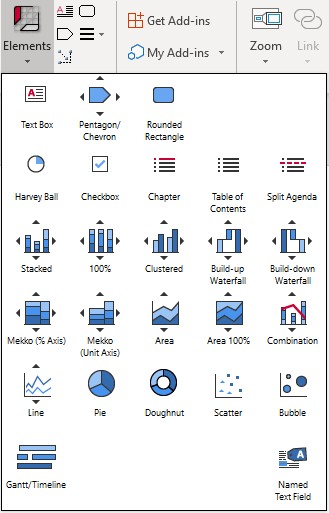
With one click, you can change the chart type from this row of icons.
![]()
In the Data Links dialog you can now also easily select all charts linked to a specific Excel source file, and update them with one click (see Manage linked data with the Data Links dialog).
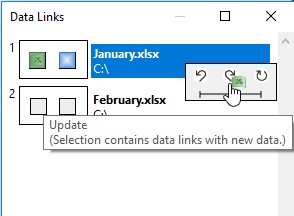
New buttons in the contextual toolbar help you easily update and revert, as well as switch to automatic updates for a chart.
![]()
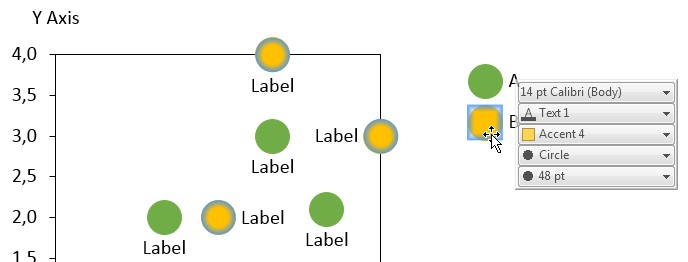
Selecting a series in the legend of a scatter or bubble chart highlights all points or bubbles of the series.
Same scale and axes
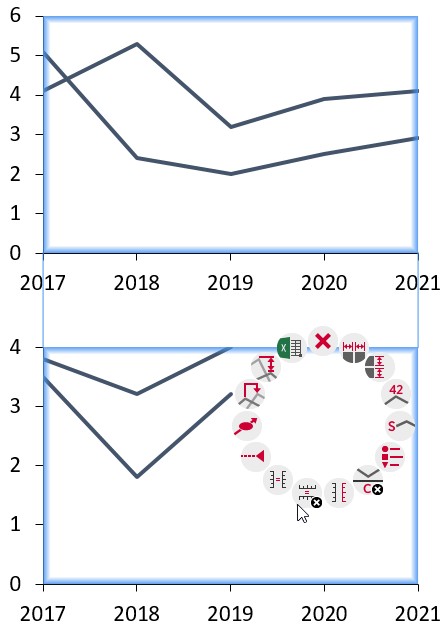
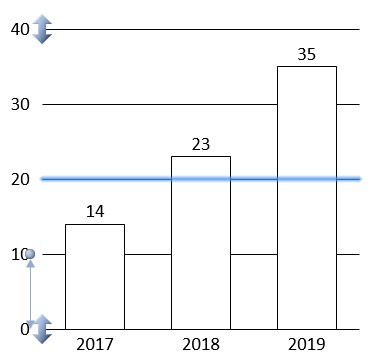
Setting charts to the same scale is now persistent. If the scale changes in one chart, all charts with the same scale will be updated. You can set charts to the same scale even when their axes are not displayed (see Match the scales of different axes).
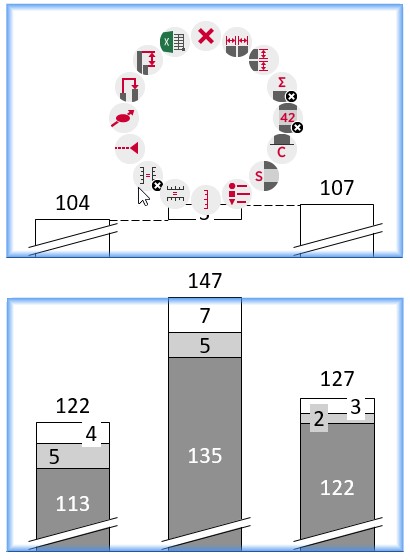
Using the same scale for multiple charts also works with axis breaks. Setting the same scale does not remove existing breaks, and adding an axis break to one chart will automatically add it to other charts using the same scale.
The X axes can also be set to same scale if they are value-based or date-based. For example, you can easily set two line charts to show the same years, even when the date range covered by the data is different (see Match the scales of different axes).
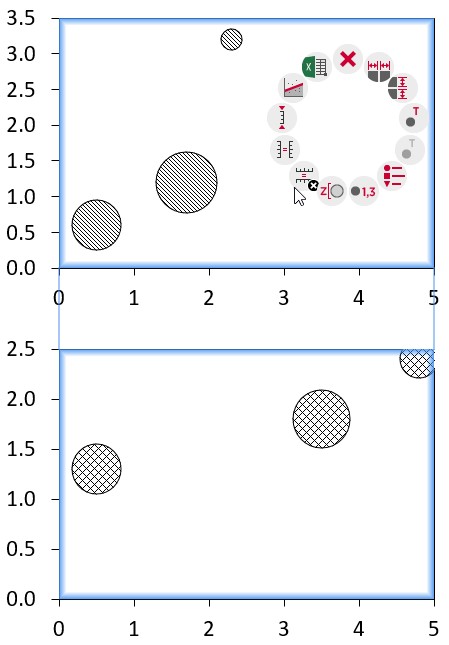
Scatter and bubble charts now support same scale. You independently choose whether the X- or Y-axis should use the same scale.
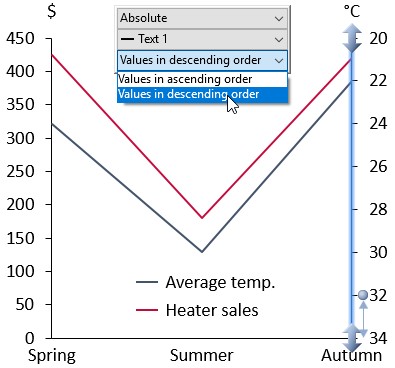
Value axes support a reversed axis. Scatter and bubble charts support a numerically reversed axis. Column, clustered and area charts simply flip the chart. In a line chart with two axes, you can set one to a reversed order to highlight negative correlations (see Reverse the value axis).
Save and send slides
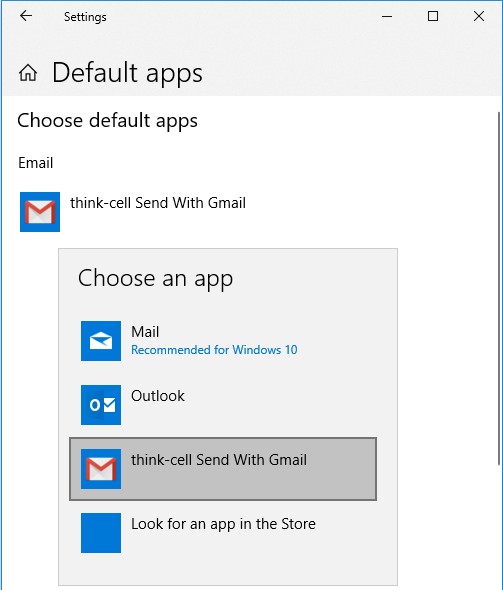
On Windows, you can use Gmail when sending slides instead of Outlook. To enable this, you set "think-cell Send with Gmail" as the default email program (see Send and save slides).
The "Save Slides..." command uses a dialog which includes your Quick Access folders. At the bottom of the dialog, you can choose which slides to include and whether date and time should be added to the filename.
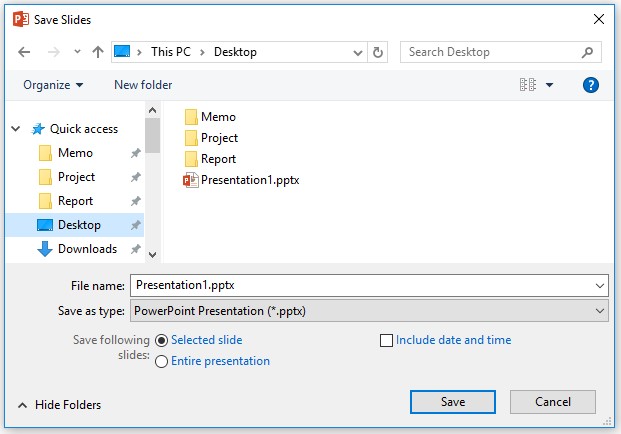
When using "Save Slides..." and "Send Slides...", the filename better represents your choices: If you choose to send the entire presentation, for example, the file name does not contain slides numbers.
Color and style
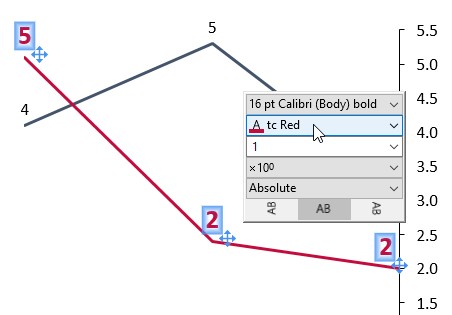
The font color of text in labels can be chosen and is not reset, even if the label background changes (see Font color).
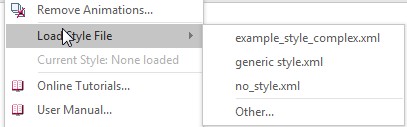
The Load Style File command makes it easy to load previously used and default style files. Initially, it contains all styles included with think-cell for easy selection.
The color scheme for new charts is always taken from the think-cell style. The most recently used color scheme is now irrelevant when inserting a new chart. You can use a style file to set your preferred color scheme as the default (see Brand compliance).
Chart decorations
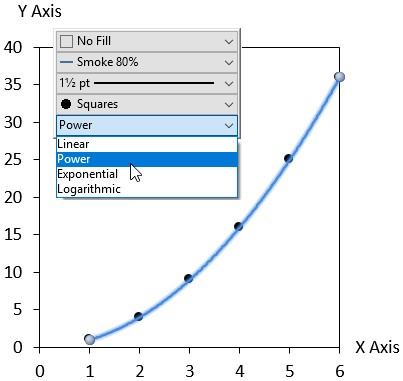
In the scatter chart, trendlines based on a power law, exponential or logarithmic relationship can be fitted to your data (see Trendlines).
You can represent the numerical scale of your chart with only gridlines instead of an axis line, instead of showing both (see Value axes).
JSON
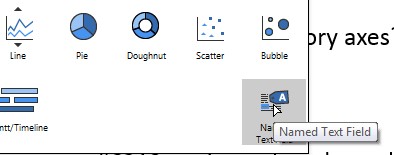
Create slides with text content based on JSON input while using the full power and flexibility of smart text fields. The new named text fields serve as placeholders in your automation templates (see Advanced report automation).
- You can run the JSON automation as a server (see Create presentations remotely).
- You can call the JSON automation process from the command line (see Create presentations with JSON data).
Ready to create charts on your Mac?
- All 40+ chart types available. Waterfalls, Gantt charts, Mekkos, and more.
- Get full think-cell functionality on the platform you prefer.
- Cross-platform file compatibility means seamless collaboration.
About think-cell
Founded in Berlin in 2002, think-cell is the company behind think-cell Suite, the leading productivity software for creating data-driven business presentations in Microsoft PowerPoint. think-cell users can generate sophisticated charts in just a few clicks, with the software automating best-practice design, labeling and annotations. With over 1,300,000 users across 35,000 organizations worldwide, think-cell is used by all of the top 10 global consulting firms, the entire DAX 40, and 88% of the Fortune 100. It is also taught at the top 10 US business schools.