think-cell 9 launched
Berlin, June 11, 2018
On June 11th, think-cell, the leading provider of productivity software for PowerPoint users, announced that it is launching think-cell version 9, the artificial intelligence (AI)-powered update of its signature software, which empowers users to create PowerPoint presentations with stunning charts and layouts in minutes.
"Building visually stunning presentations can be a pain-staking manual process even for the most qualified graphics experts," said Markus Hannebauer, think-cell co-founder and CEO. "However, think-cell is committed to removing these burdensome roadblocks, encouraging PowerPoint users to re-imagine how they communicate data-driven insights and findings. Data is rapidly becoming the most valuable resource for businesses today, and the process of creating dynamic charts to interpret that data should never be more complex than the data itself."
think-cell 9 is blending artificial intelligence, automation technology and unmatched industry perspective to ensure a faster and integrated slide layout process,” said Arno Schödl, co-founder and CTO at think-cell. “With think-cell the race against time is no longer an issue, allowing users to focus on communicating and implementing recommendations instead of pushing around shapes.”
Smart text boxes
think-cell's text boxes have been given a boost of intelligence. You can now use them to create complex slide layouts without manually moving or resizing any elements (learn more). Watch the video to see how it works.
Doughnut charts
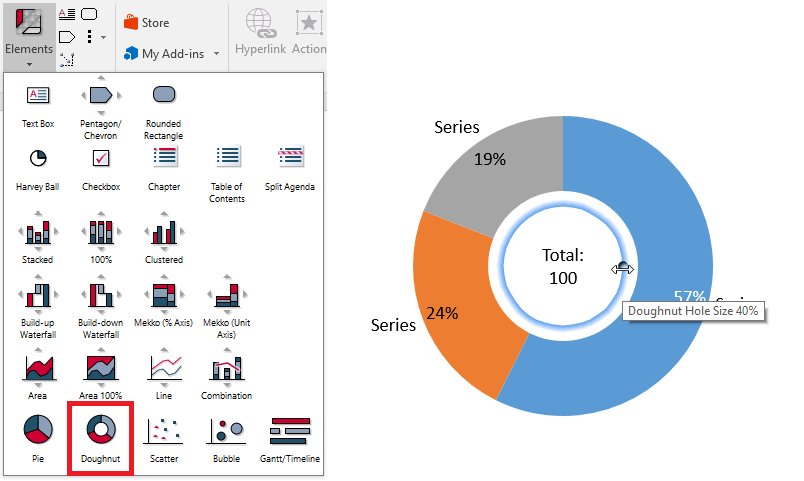
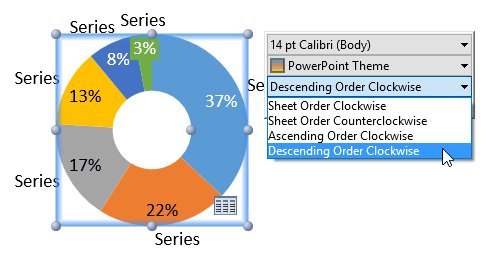
Make your pie charts stand out even more by converting them to our newest chart type, the doughnut chart. And yes, doughnut charts look just like they sound. They’re essentially pie charts with a hole in the middle. This new chart design helps to accentuate the data slices and provides a place to highlight additional information. Learn more.
Enhanced chart rendering
For better visual quality and faster editing, think-cell 9 uses PowerPoint's native chart component to render charts instead of the legacy MS Graph component. This also removes several other limits, e.g., scatter and line charts can now contain more than 4,000 data points. think-cell's user interface itself is not changed at all by the new rendering back-end. You will just notice the improved visual quality and better compatibility.
Automation with JSON
In addition to Excel, you can now use JSON data to automatically create and update periodic reports (learn more). This new enhancement allows you to:
- Create presentations automatically by merging template charts with JSON data.
- Build a web service that creates think-cell charts.
- Export your business intelligence reports as PowerPoint slides.
More new charting features
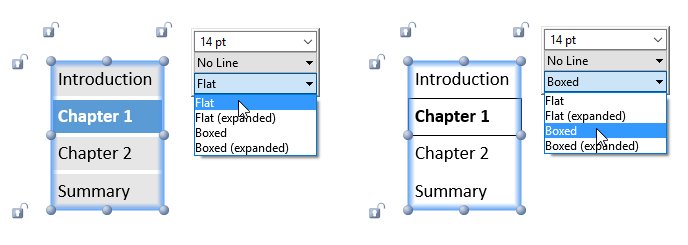
The new "Flat" agenda style uses background fills instead of rectangles. Learn more.
Tooltips now show labels and numeric values for individual datapoints.
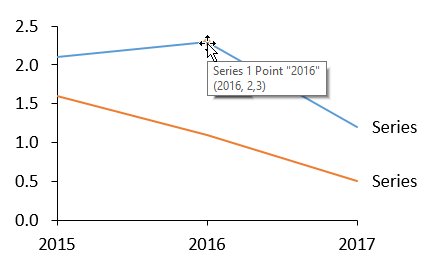
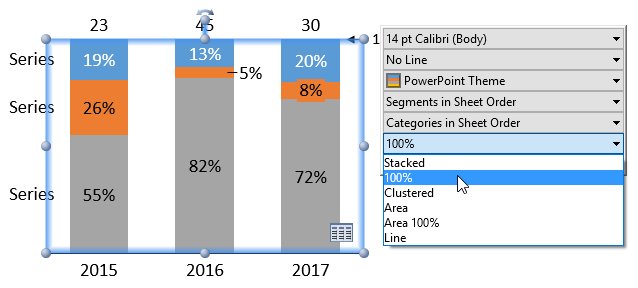
Chart types can now be switched between absolute and percentage, even when there's no axis. Learn more.
The sort order of slices can now be easily changed for pie and doughnut charts.
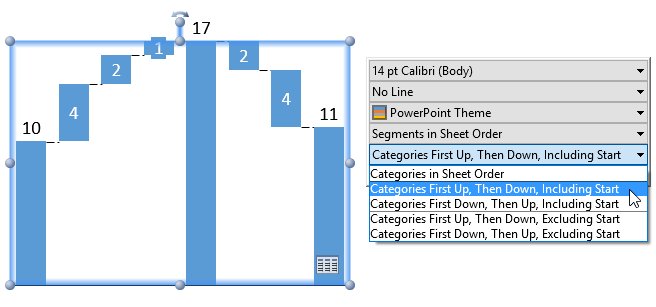
In waterfall charts, category sort options such as "Categories First Up, Then Down, Including Start" ensure that sum columns stay in their position.
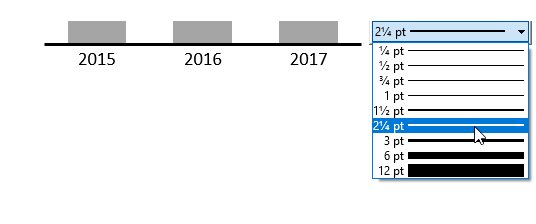
The baseline weight can now be changed.
Changes to existing charting features
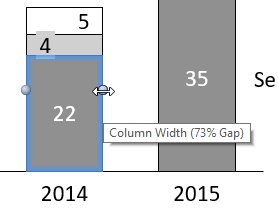
In previous versions you adjusted the column width by changing the gap width between columns. In think-cell 9, you instead adjust the column width directly by using the following handles: Learn more.
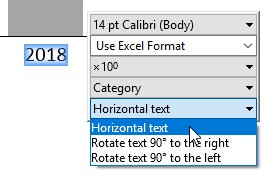
Label rotation was changed by dragging a handle in previous version, while other properties like font size and number format were set using the floating toolbar. In think-cell 9, you also set label rotation in the floating toolbar. Learn more.
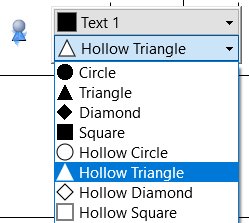
In previous versions, milestones where shaped as a triangle or diamond and you switched between them with a button in the milestone's context menu. In think-cell 9, additional shapes were added. Therefore, you choose the milestone shape with a control in the floating toolbar, which shows a list of choices. Learn more.
New tools to make you more productive
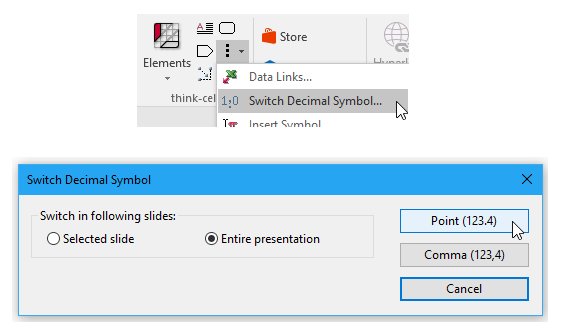
Quickly switch the decimal symbol (e.g., German to US format) for labels on all or selected slides. Learn more.
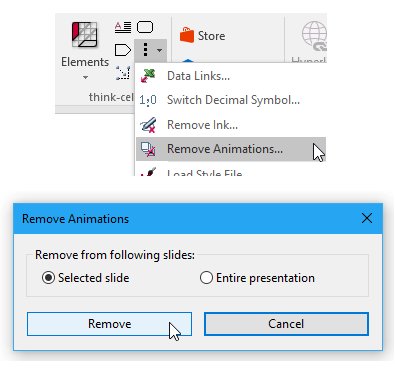
Remove animations from all or selected slides. Learn more.
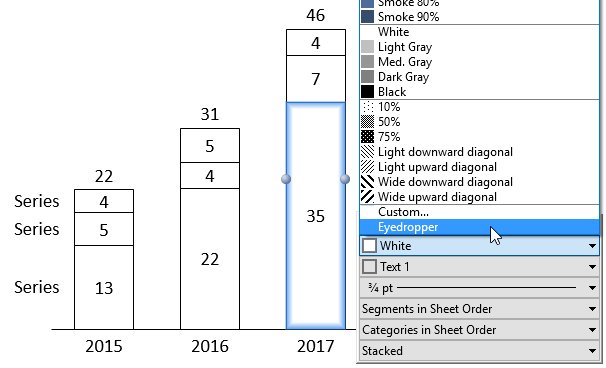
Quickly choose custom colors with the new eyedropper tool. Learn more.
New keyboard shortcuts:
- Multi-select labels with Ctrl+Alt+Shift+← → ↑ ↓.
- Duplicate elements, e.g., in tables and process flows, with Ctrl+Alt+← → ↑ ↓.
Additional customization options
- Control agenda placement through a custom layout that can also contain more shapes for agenda slides. Learn more.
- Define theme color shades as a base color plus brightness. Learn more.
- Specify checkboxes with more options: non-square images, e.g., traffic lights, and all Unicode characters. Learn more.
- For a color scheme, specify that it is not remembered as the default for subsequent charts. Learn more.
Improved Sharepoint support
think-cell fully supports the new user interface for conflict resolution in PowerPoint 2016 that is based on whole slides. Concurrent editing in SharePoint/PowerPoint 2013 is also improved.
About think-cell
Founded in Berlin in 2002, think-cell is the de facto standard for creating professional presentations in PowerPoint. With productivity tools and support for 40+ chart types, all of the top 10 global consulting firms rely on think-cell. It is the software of choice for the DAX 40 and Fortune 500 companies and is taught at 10 of the top 10 US business schools.

