01
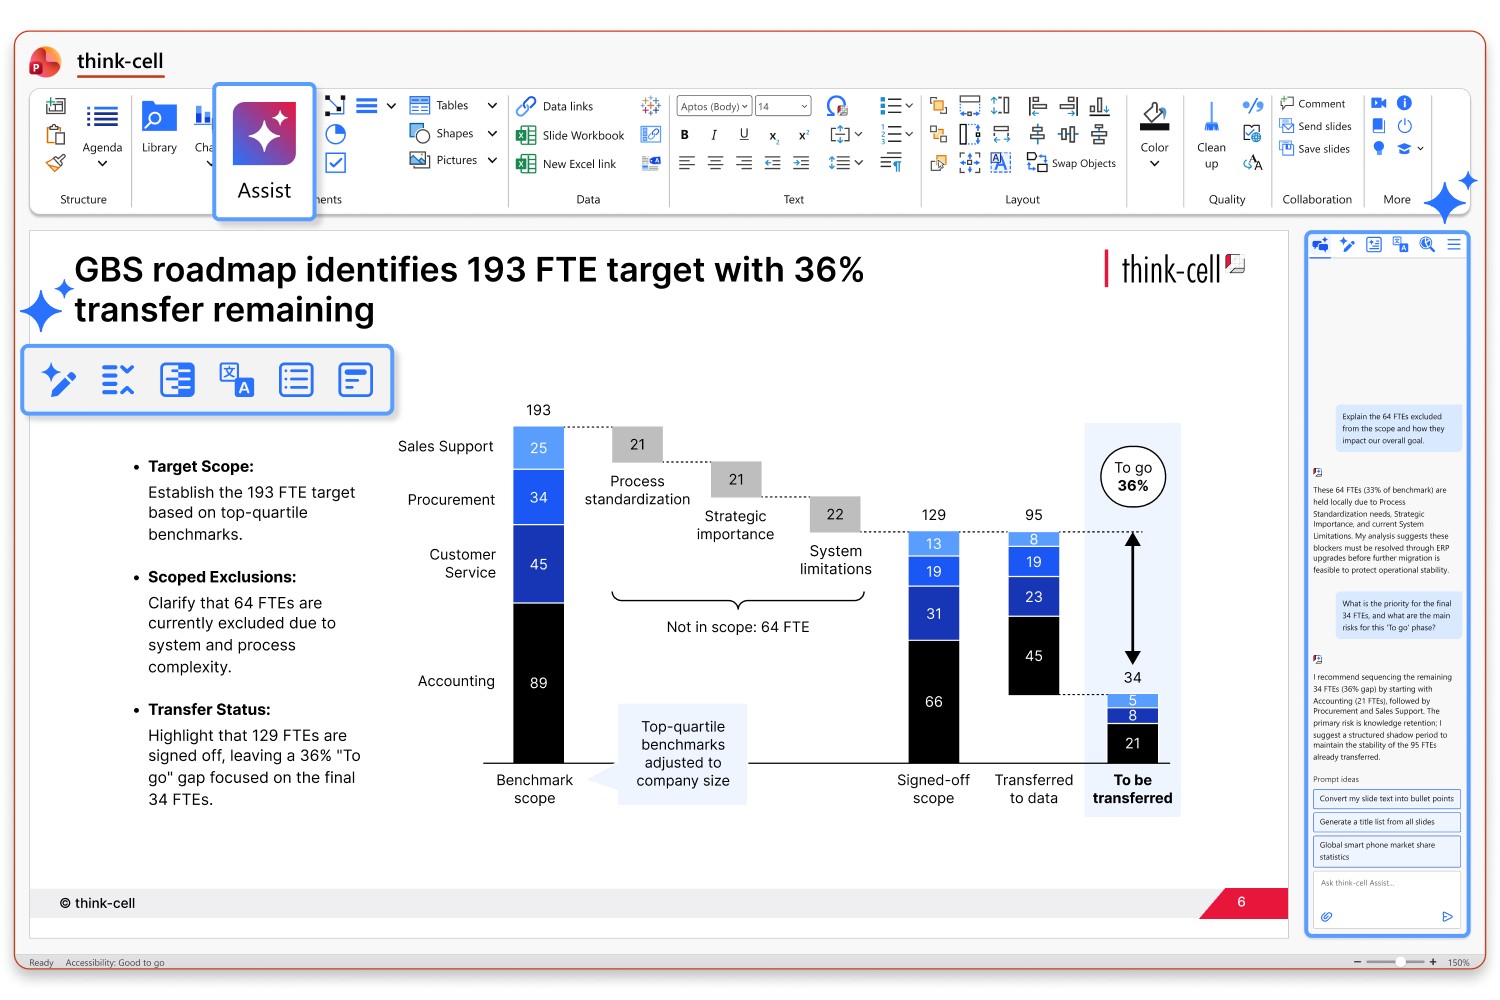
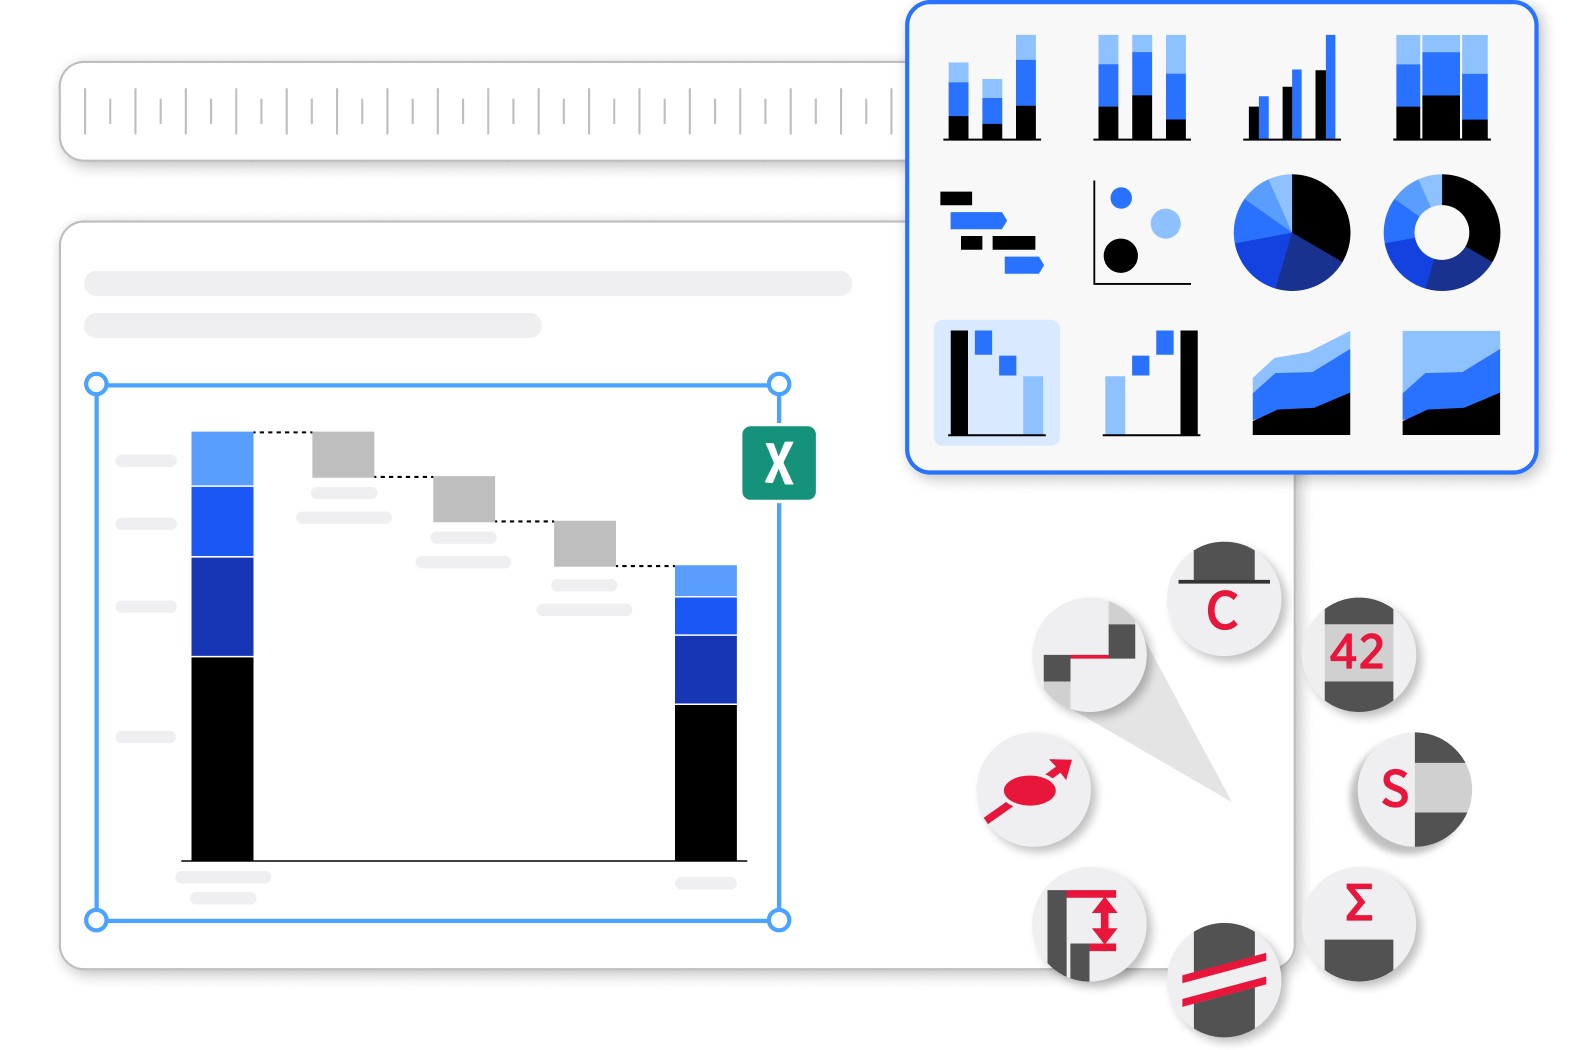
All important features in one place
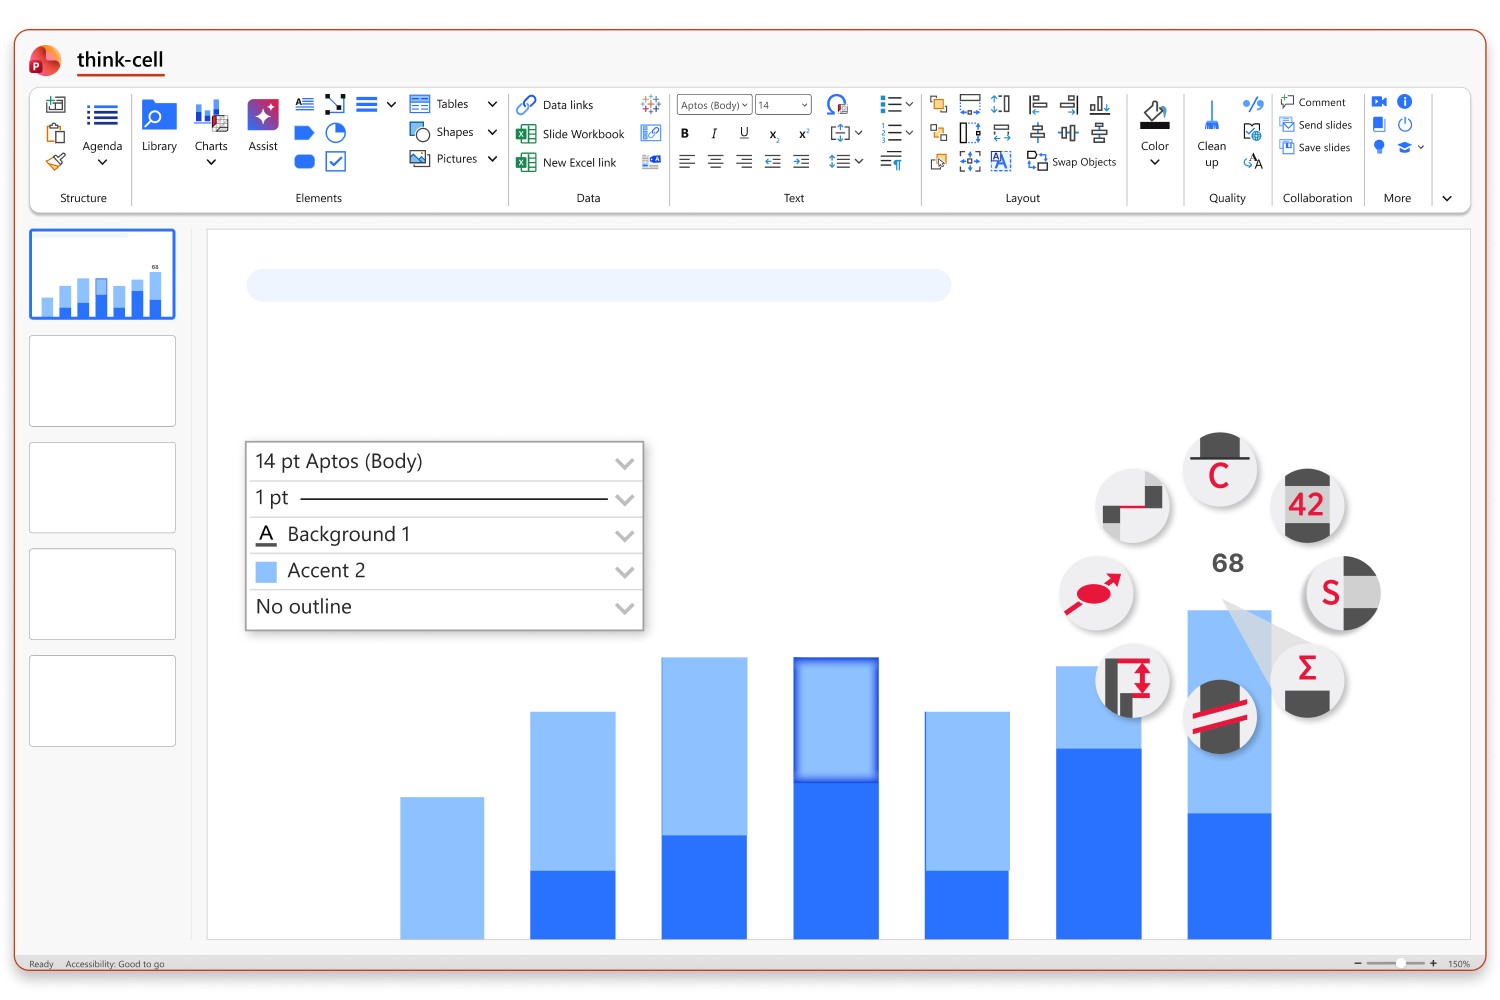
Access templates, image libraries, charts and tools from a single think-cell tab to build any presentation more efficiently.
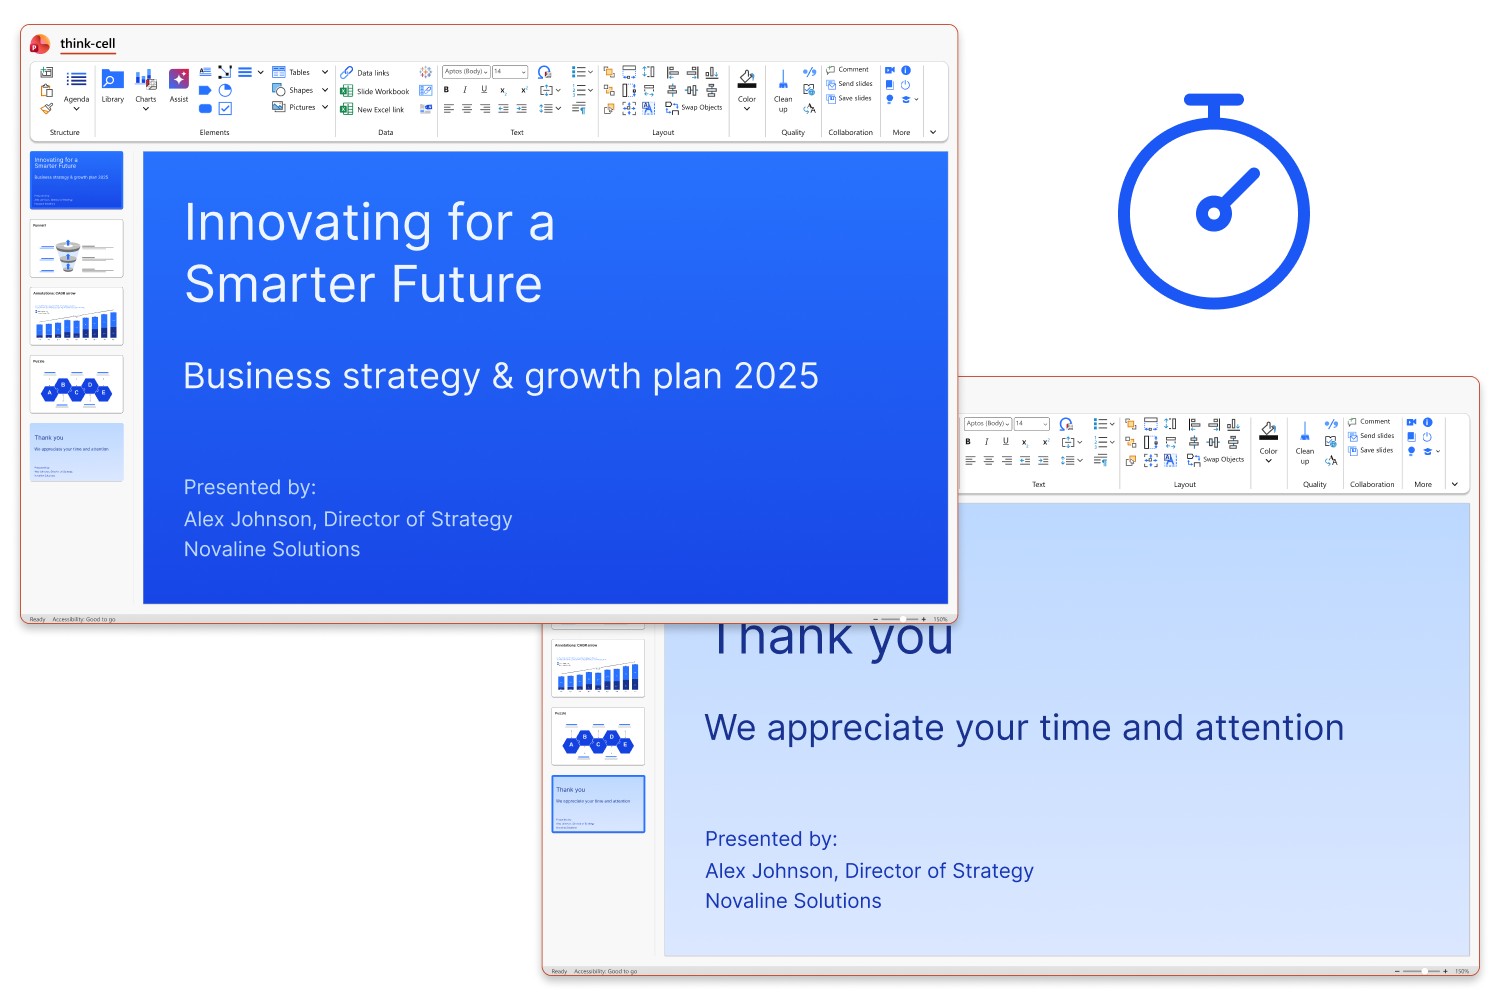
02
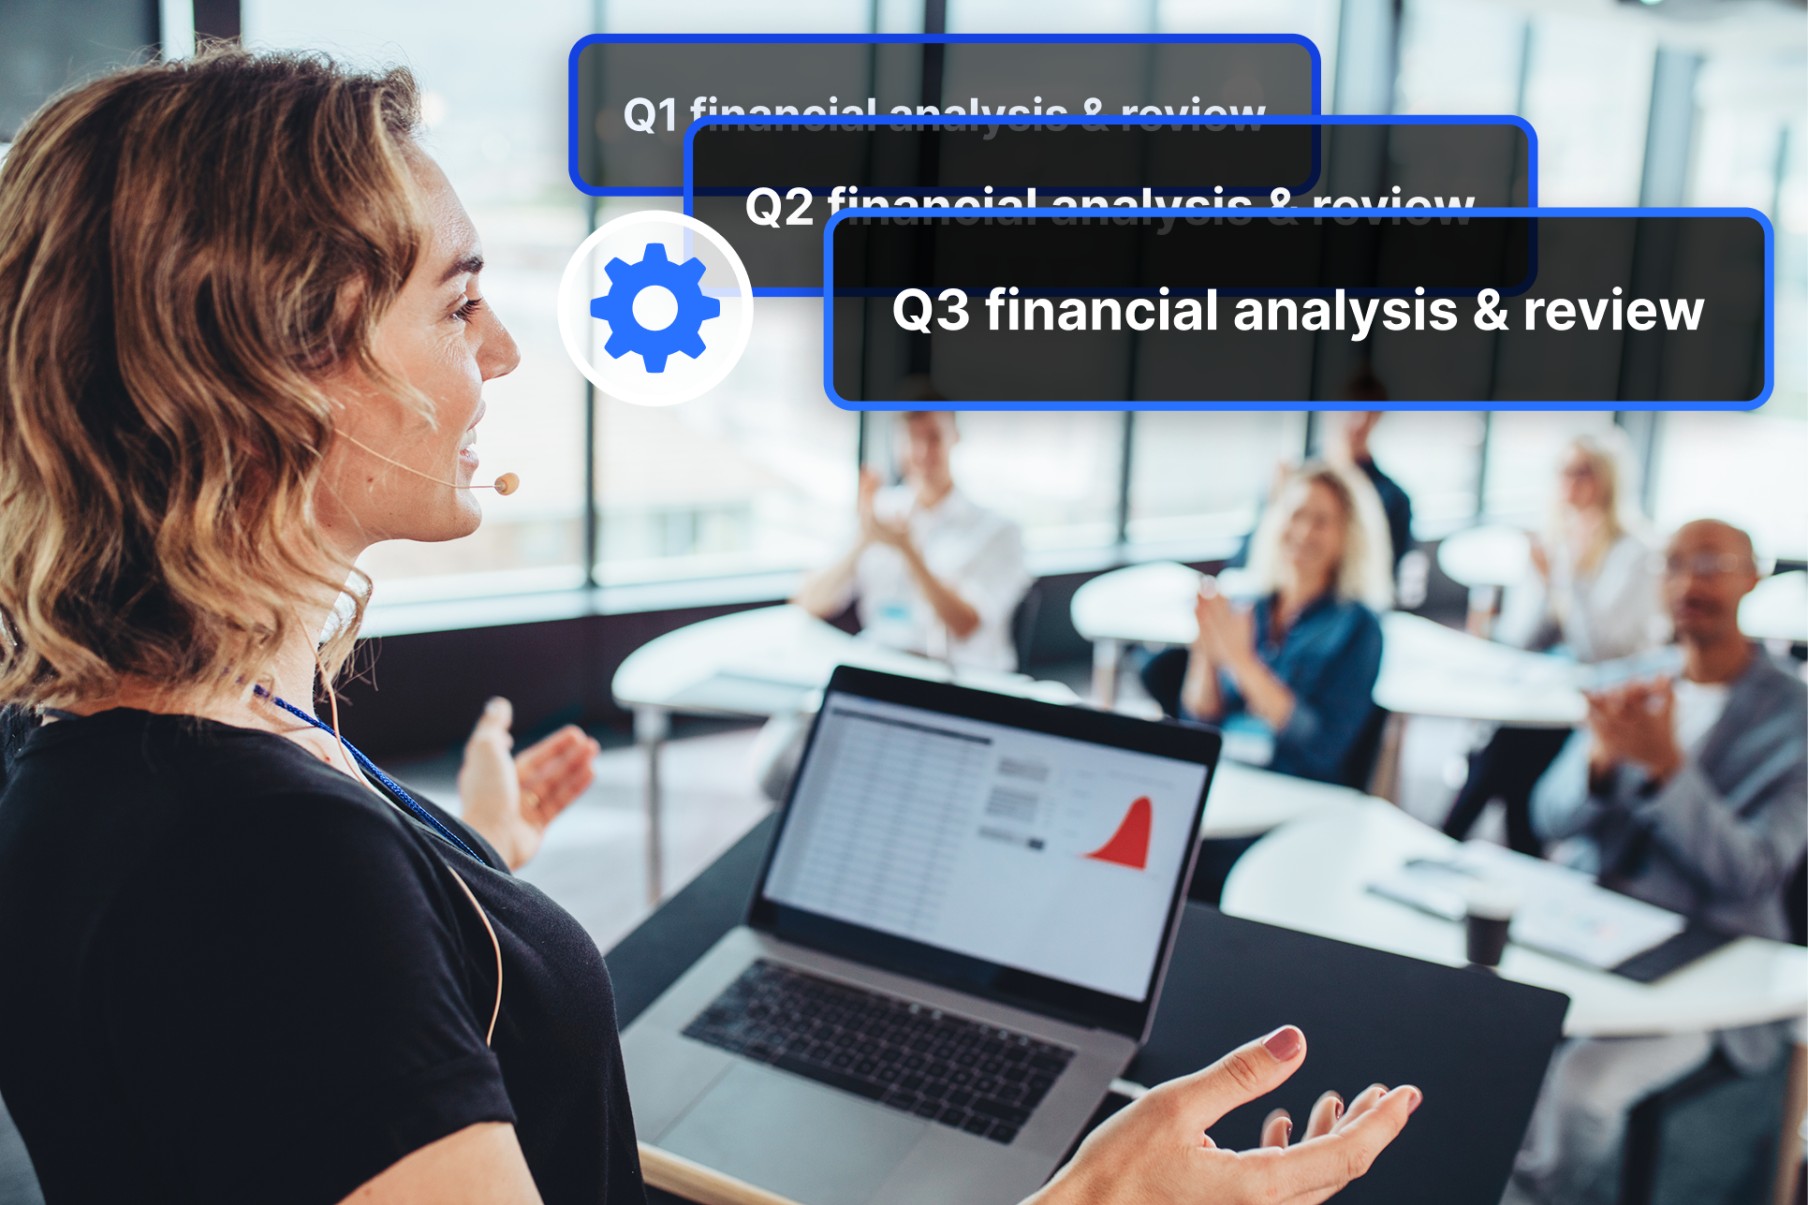
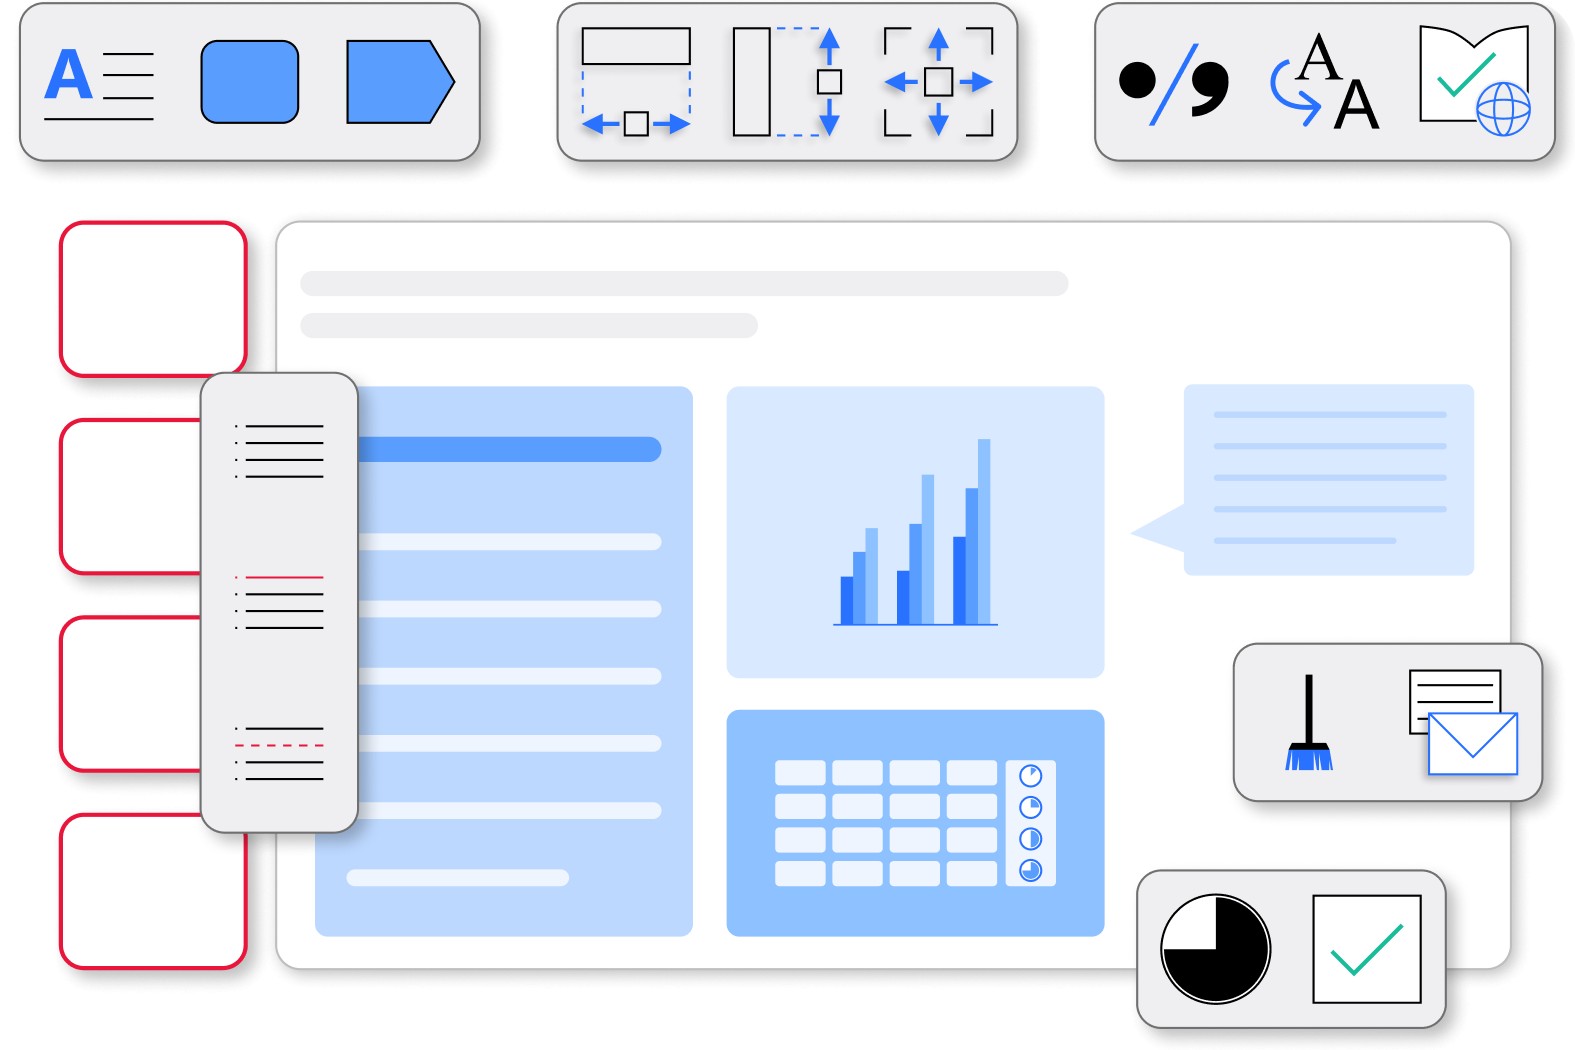
Your guide for the whole presentation journey
Start smoothly and see increased productivity every step of the way. Work faster from first slide to final presentation.
03
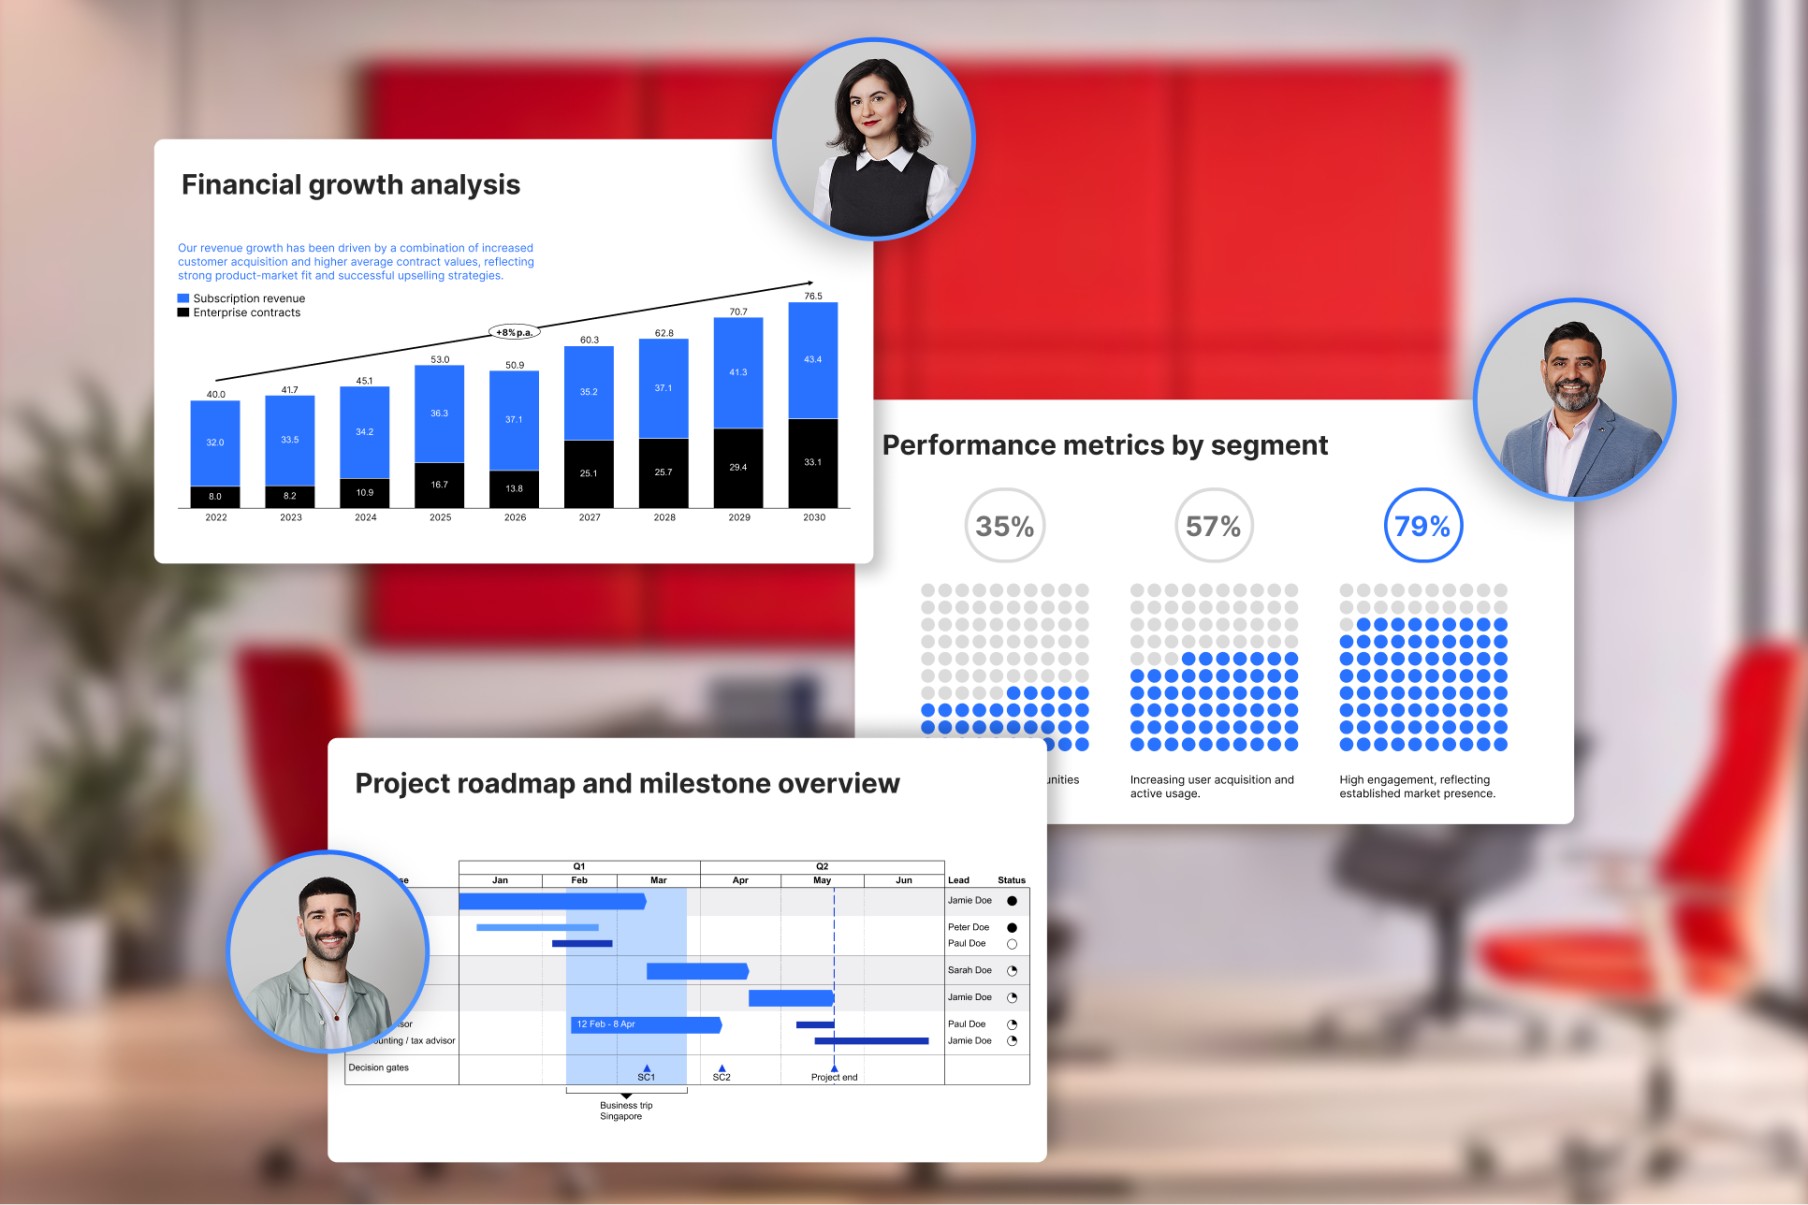
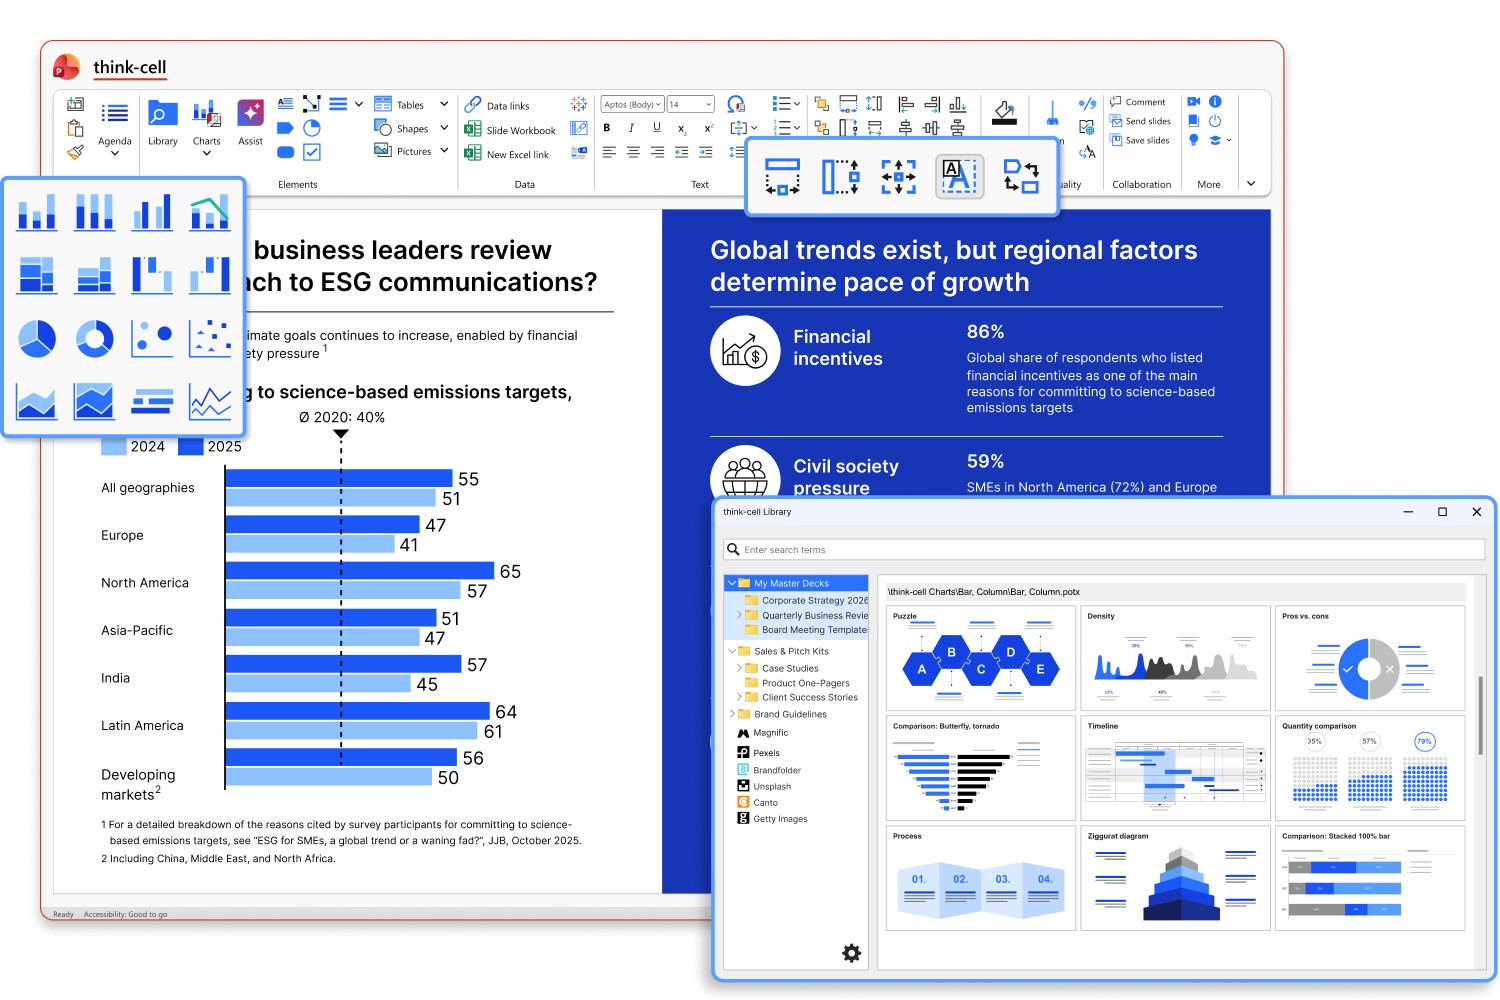
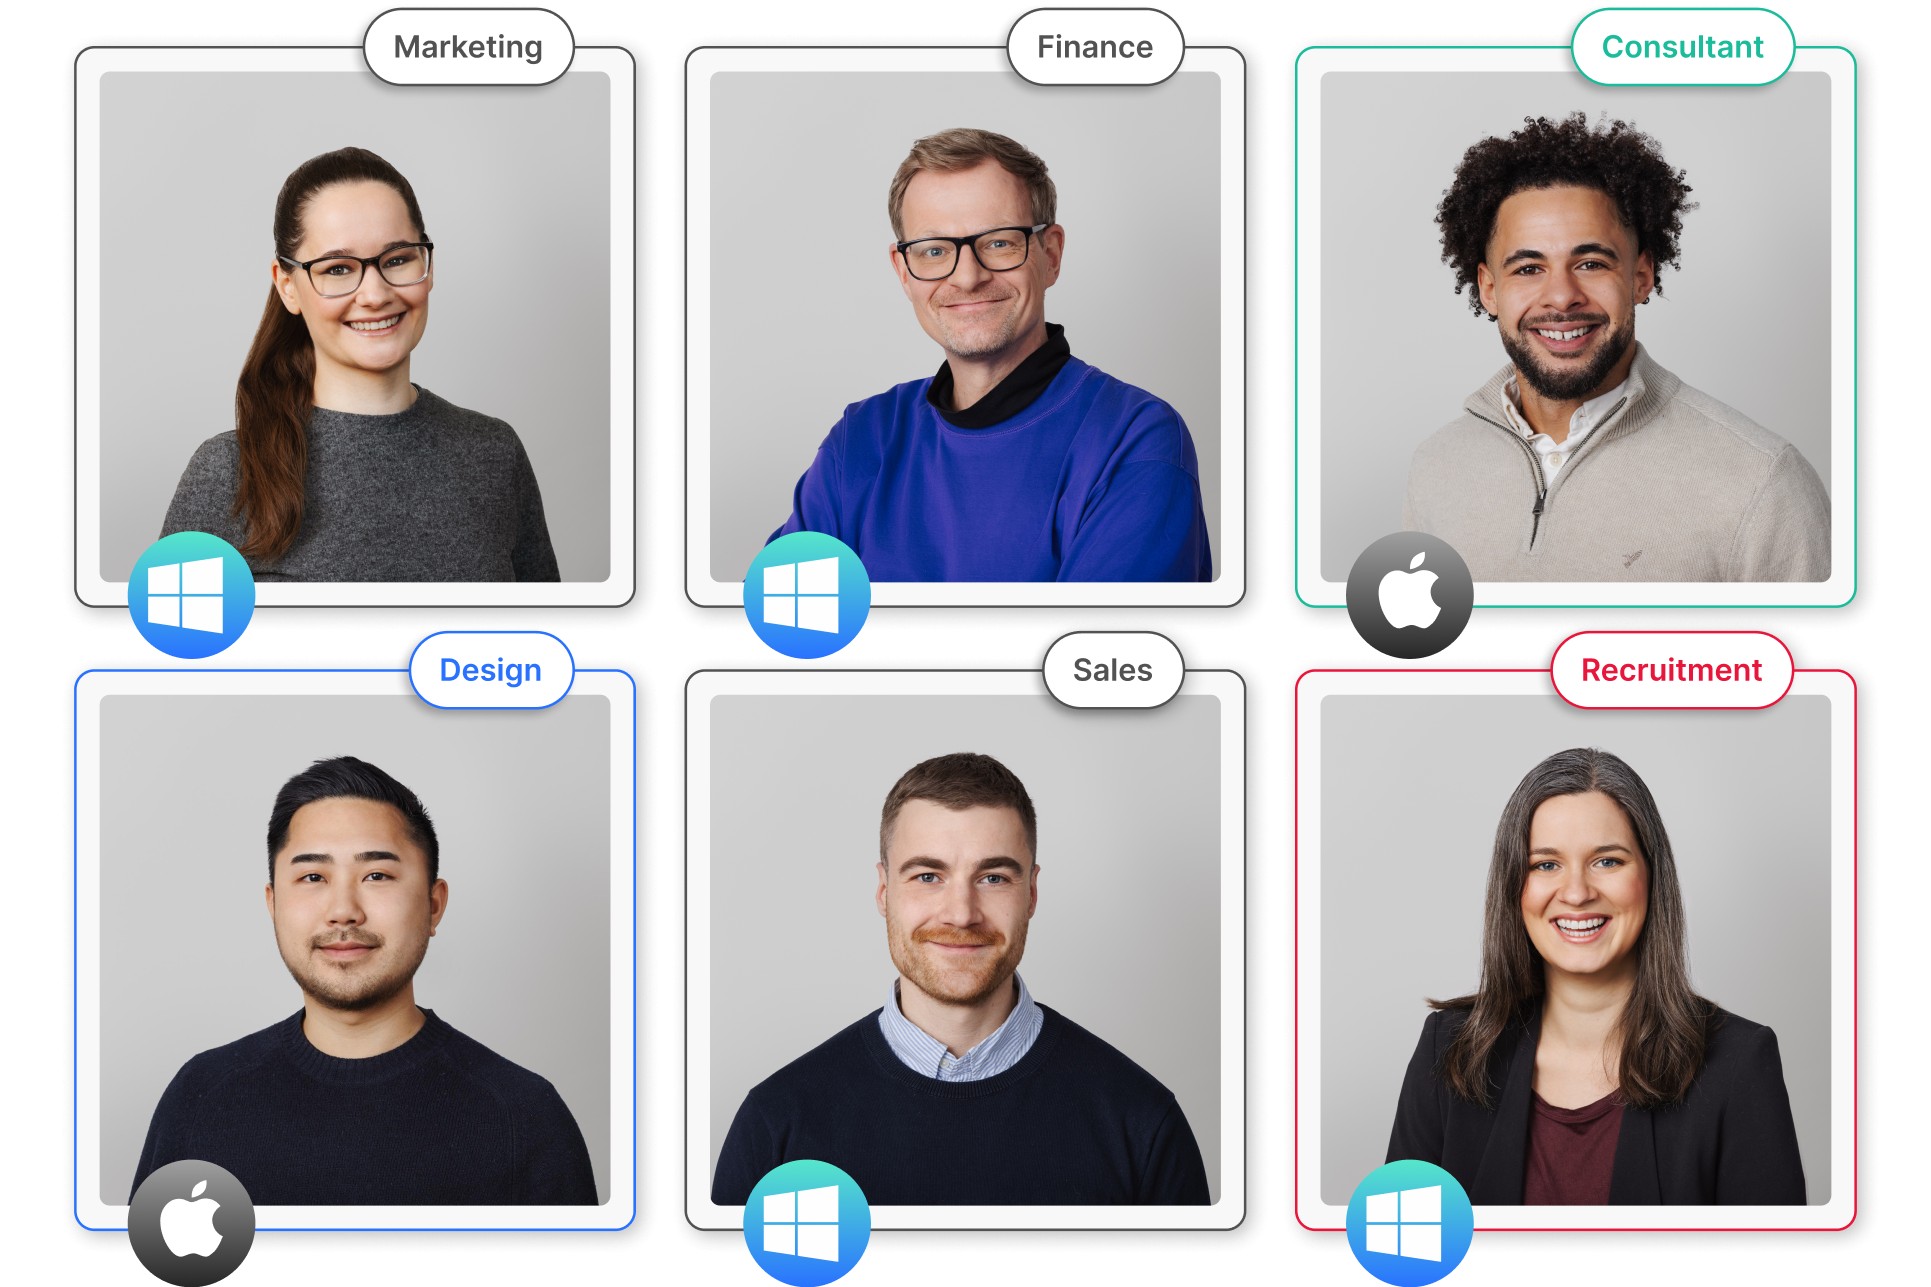
Support for your whole team
Collaborate seamlessly with colleagues and external stakeholders thanks to full compatibility with Windows, Mac, and ARM systems.