Build financial charts in minutes
- Prepare CFO-ready slide decks with charts that update themselves.
- Connect your slides to your Excel sources for 100% accuracy.
- Spend less time formatting slides and more time analyzing.
think-cell in numbers
end users worldwide
customers
Fortune 100 companies
Save 70% working time in PowerPoint and become a strategic partner
Build decks with speed and precision, and go from sweating over slides to sharing analysis and insights.
Build complex financial presentations fast
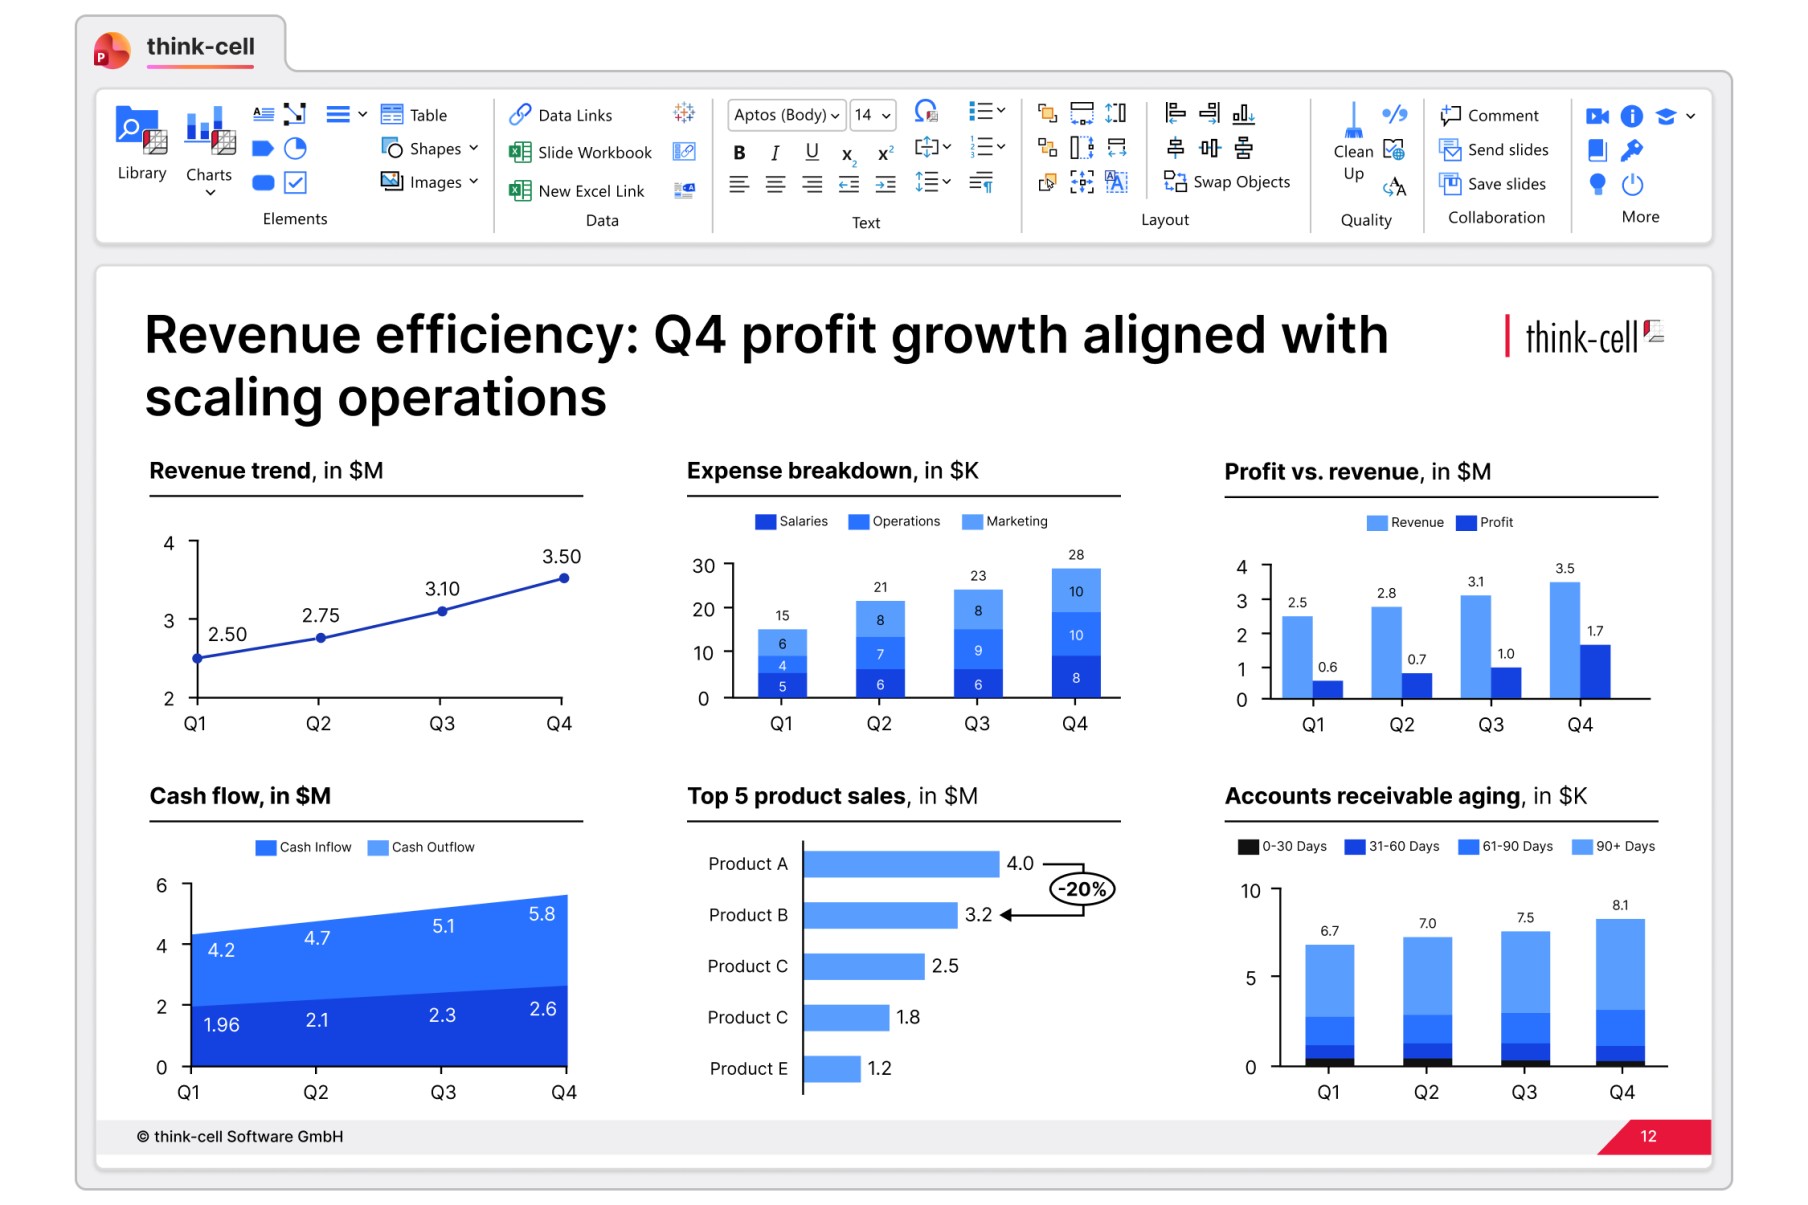
Build 40+ data visualizations and turn around requests fast.
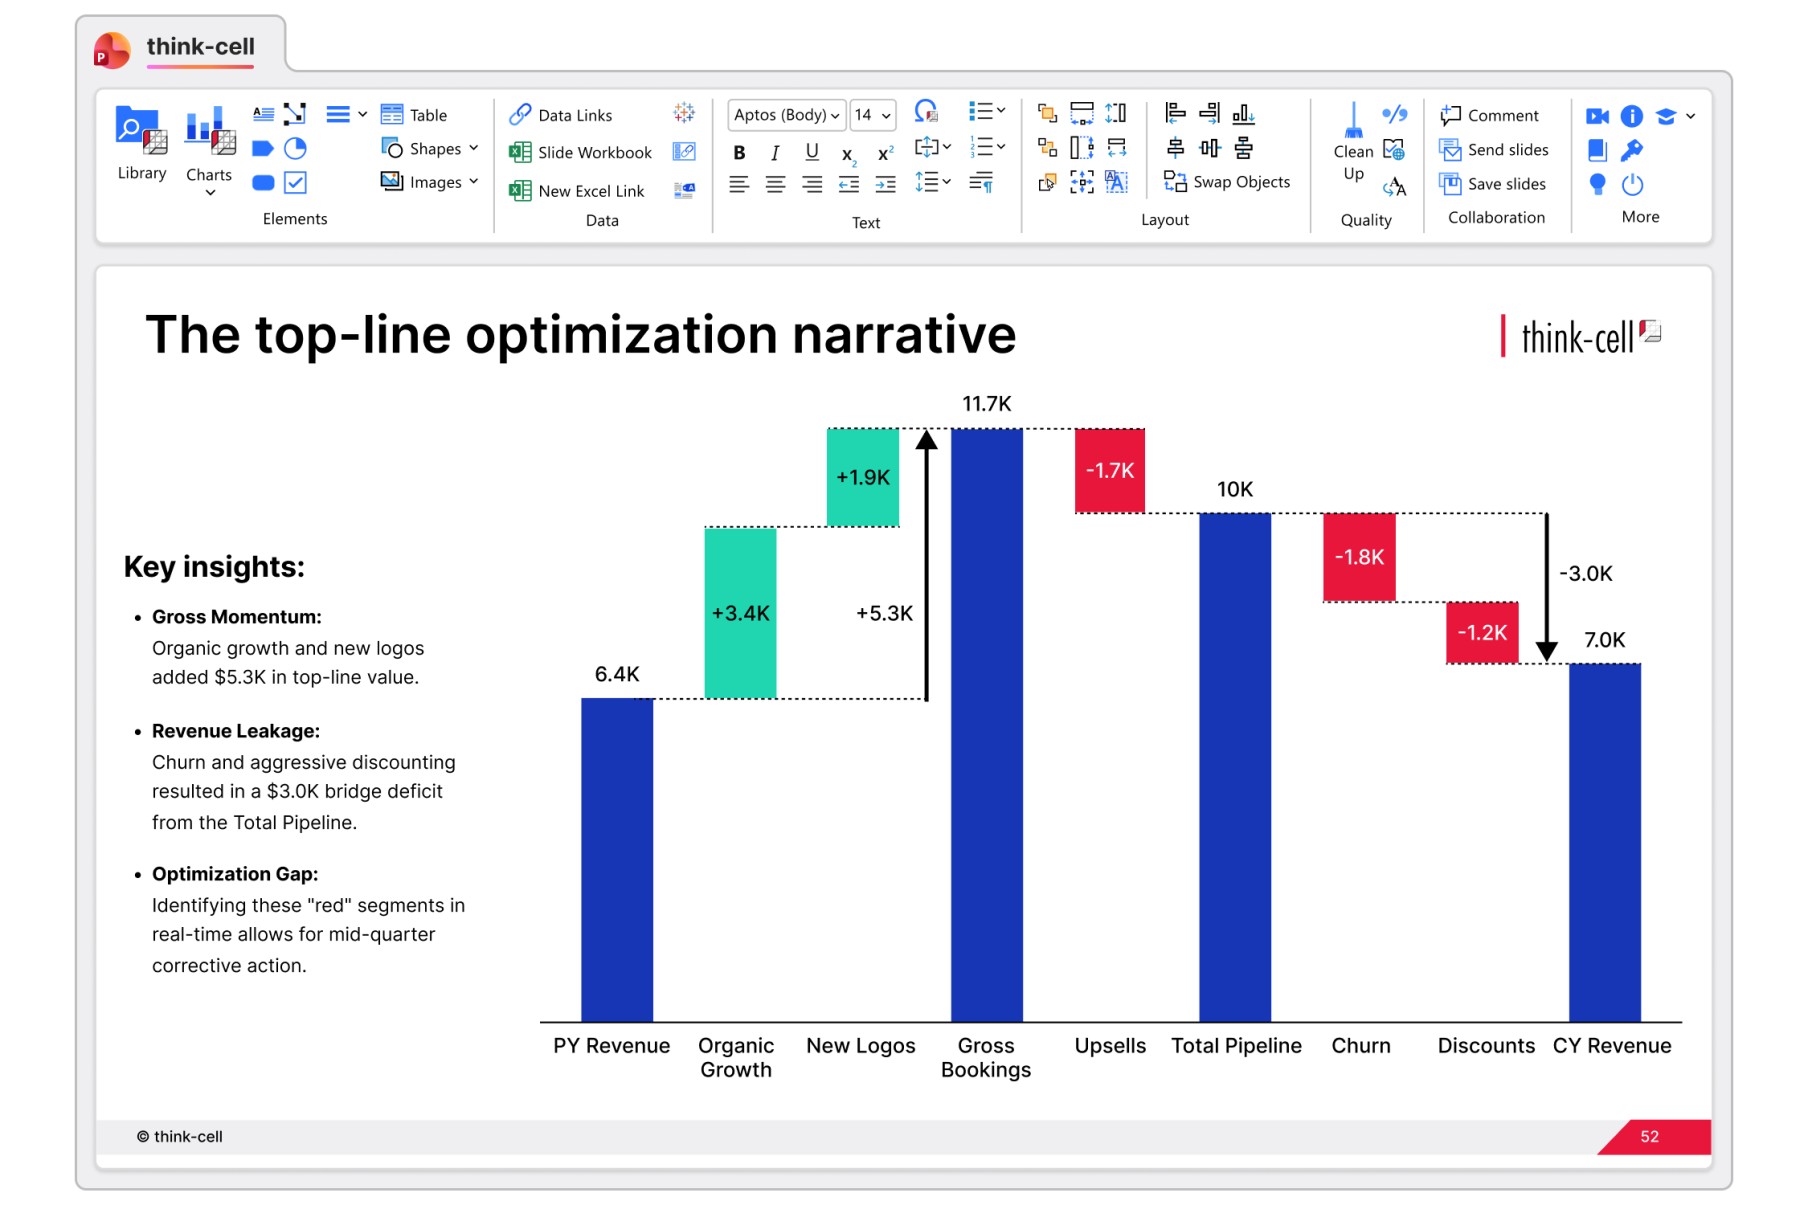
- Create waterfall charts in two minutes without the finicky workarounds.
- Highlight key insights with auto-calculated enhancements that are positioned perfectly.
- Connect your charts to Excel for control and data consistency.
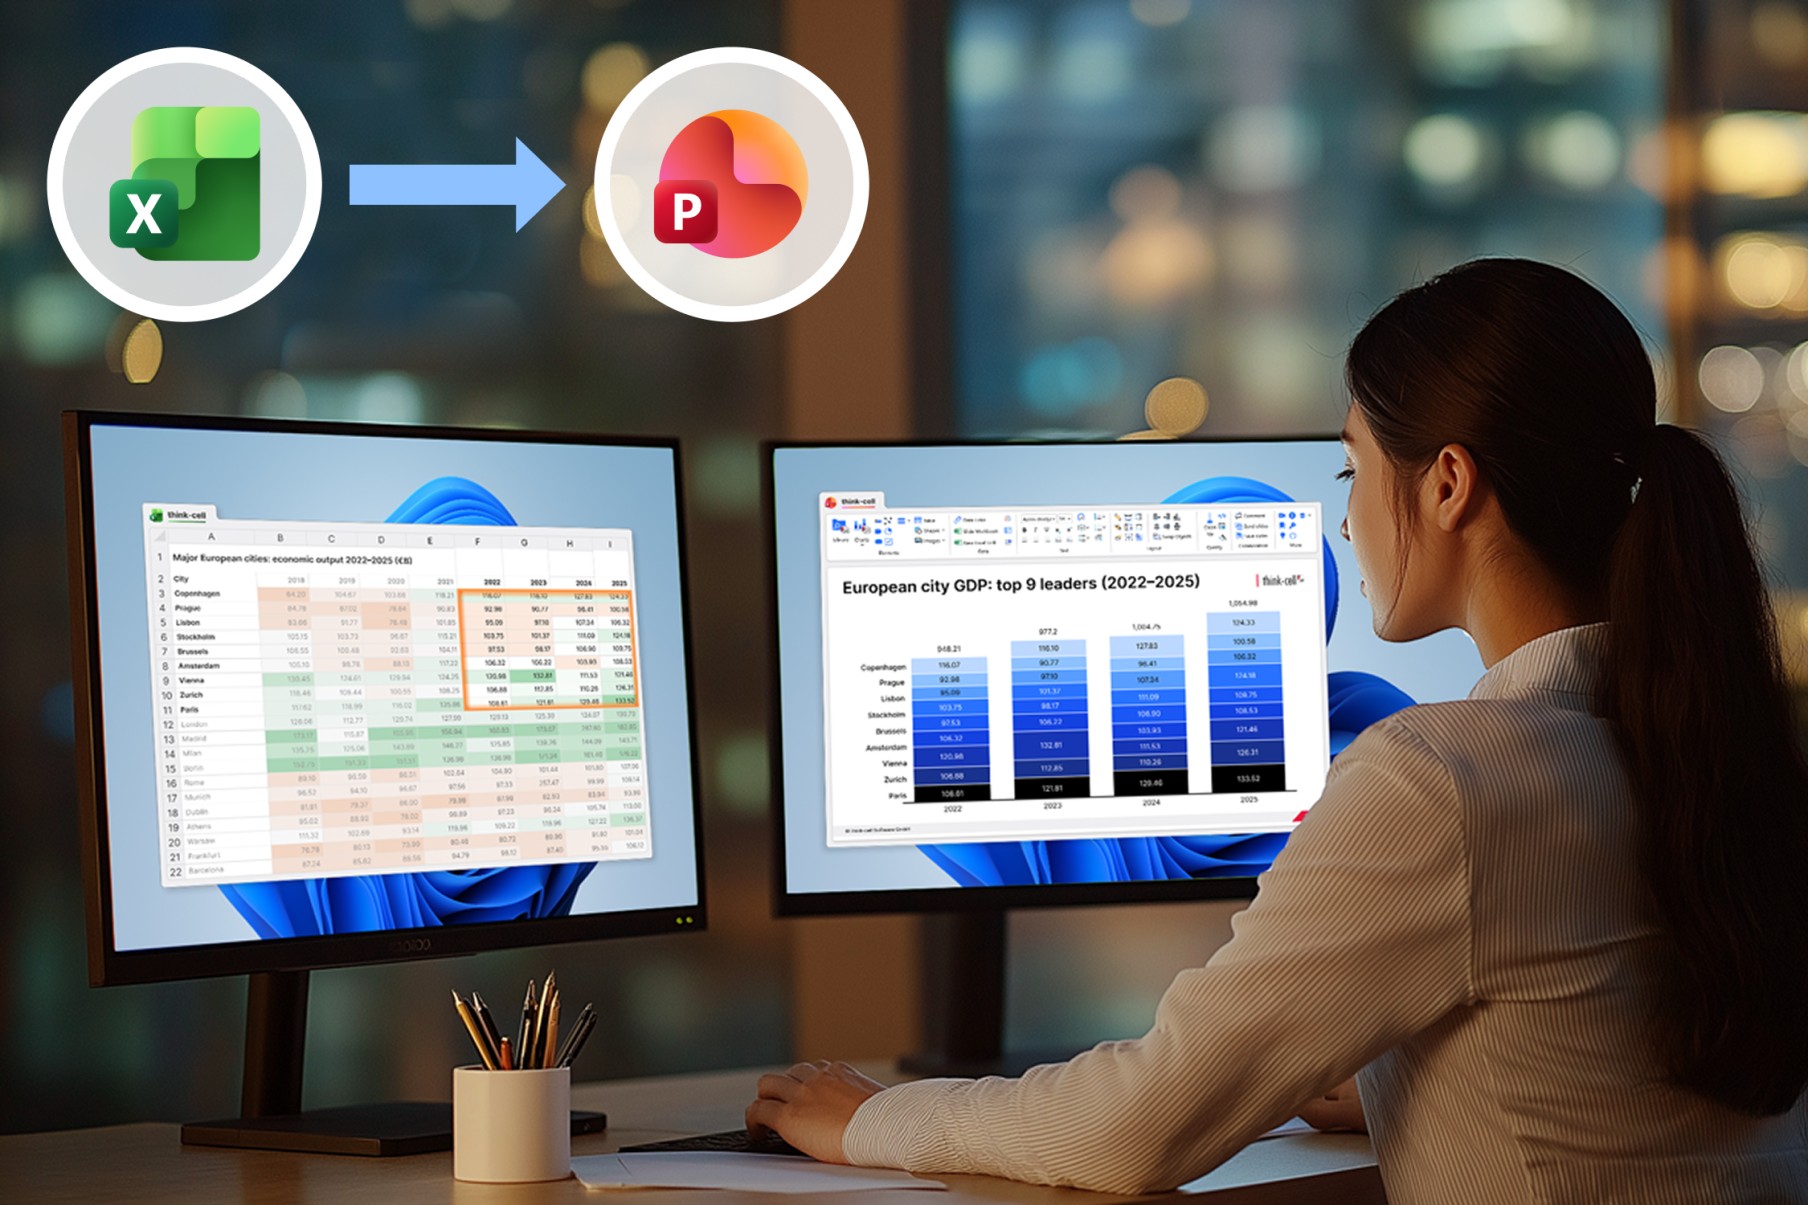
Work in Excel, share in PowerPoint
Build your models in spreadsheets, connect them to your slide deck, then just open PowerPoint when you’re ready to present.
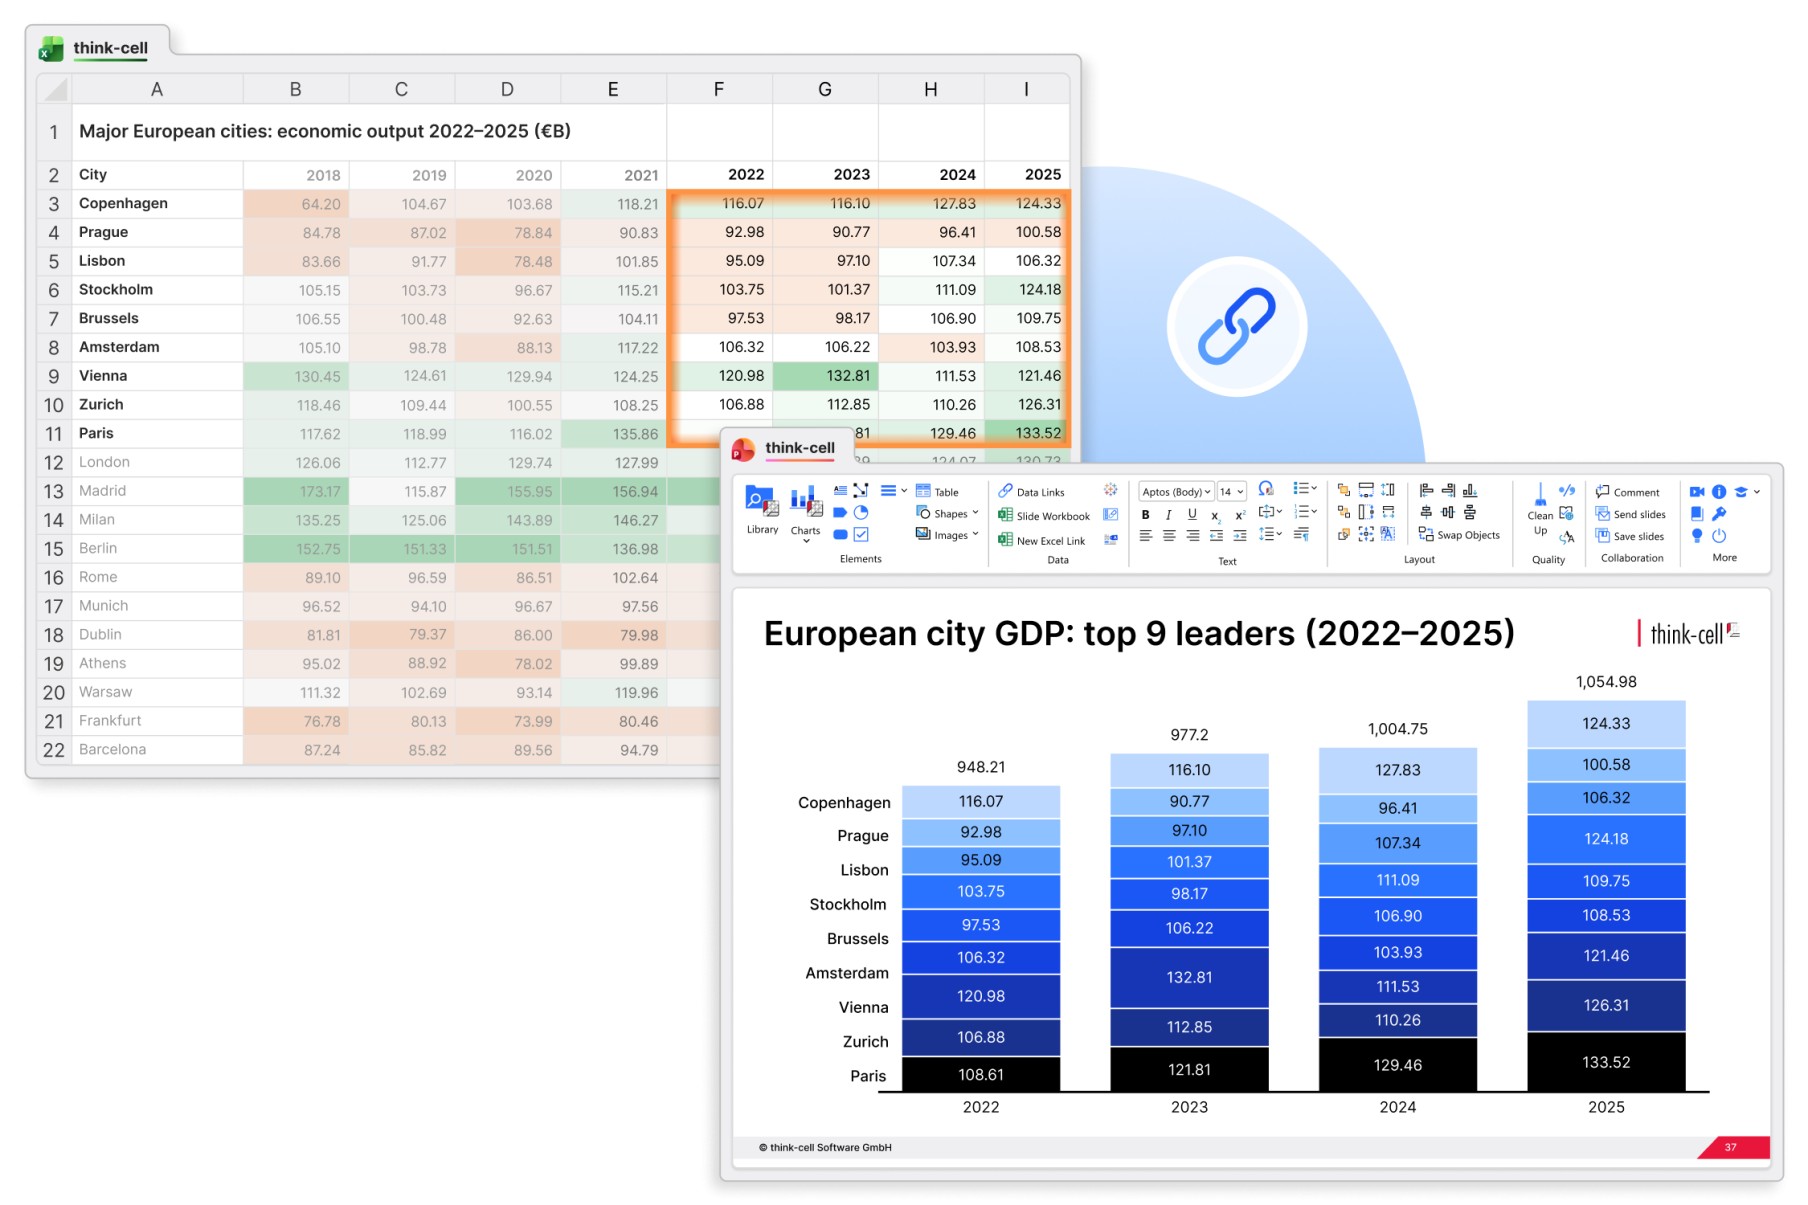
- Select your Excel data, choose a chart type, place it on a slide. Done in under a minute.
- Link tables and heatmaps into charts across your deck for accurate reporting.
- Update multiple slides from one Excel master file with just a click.
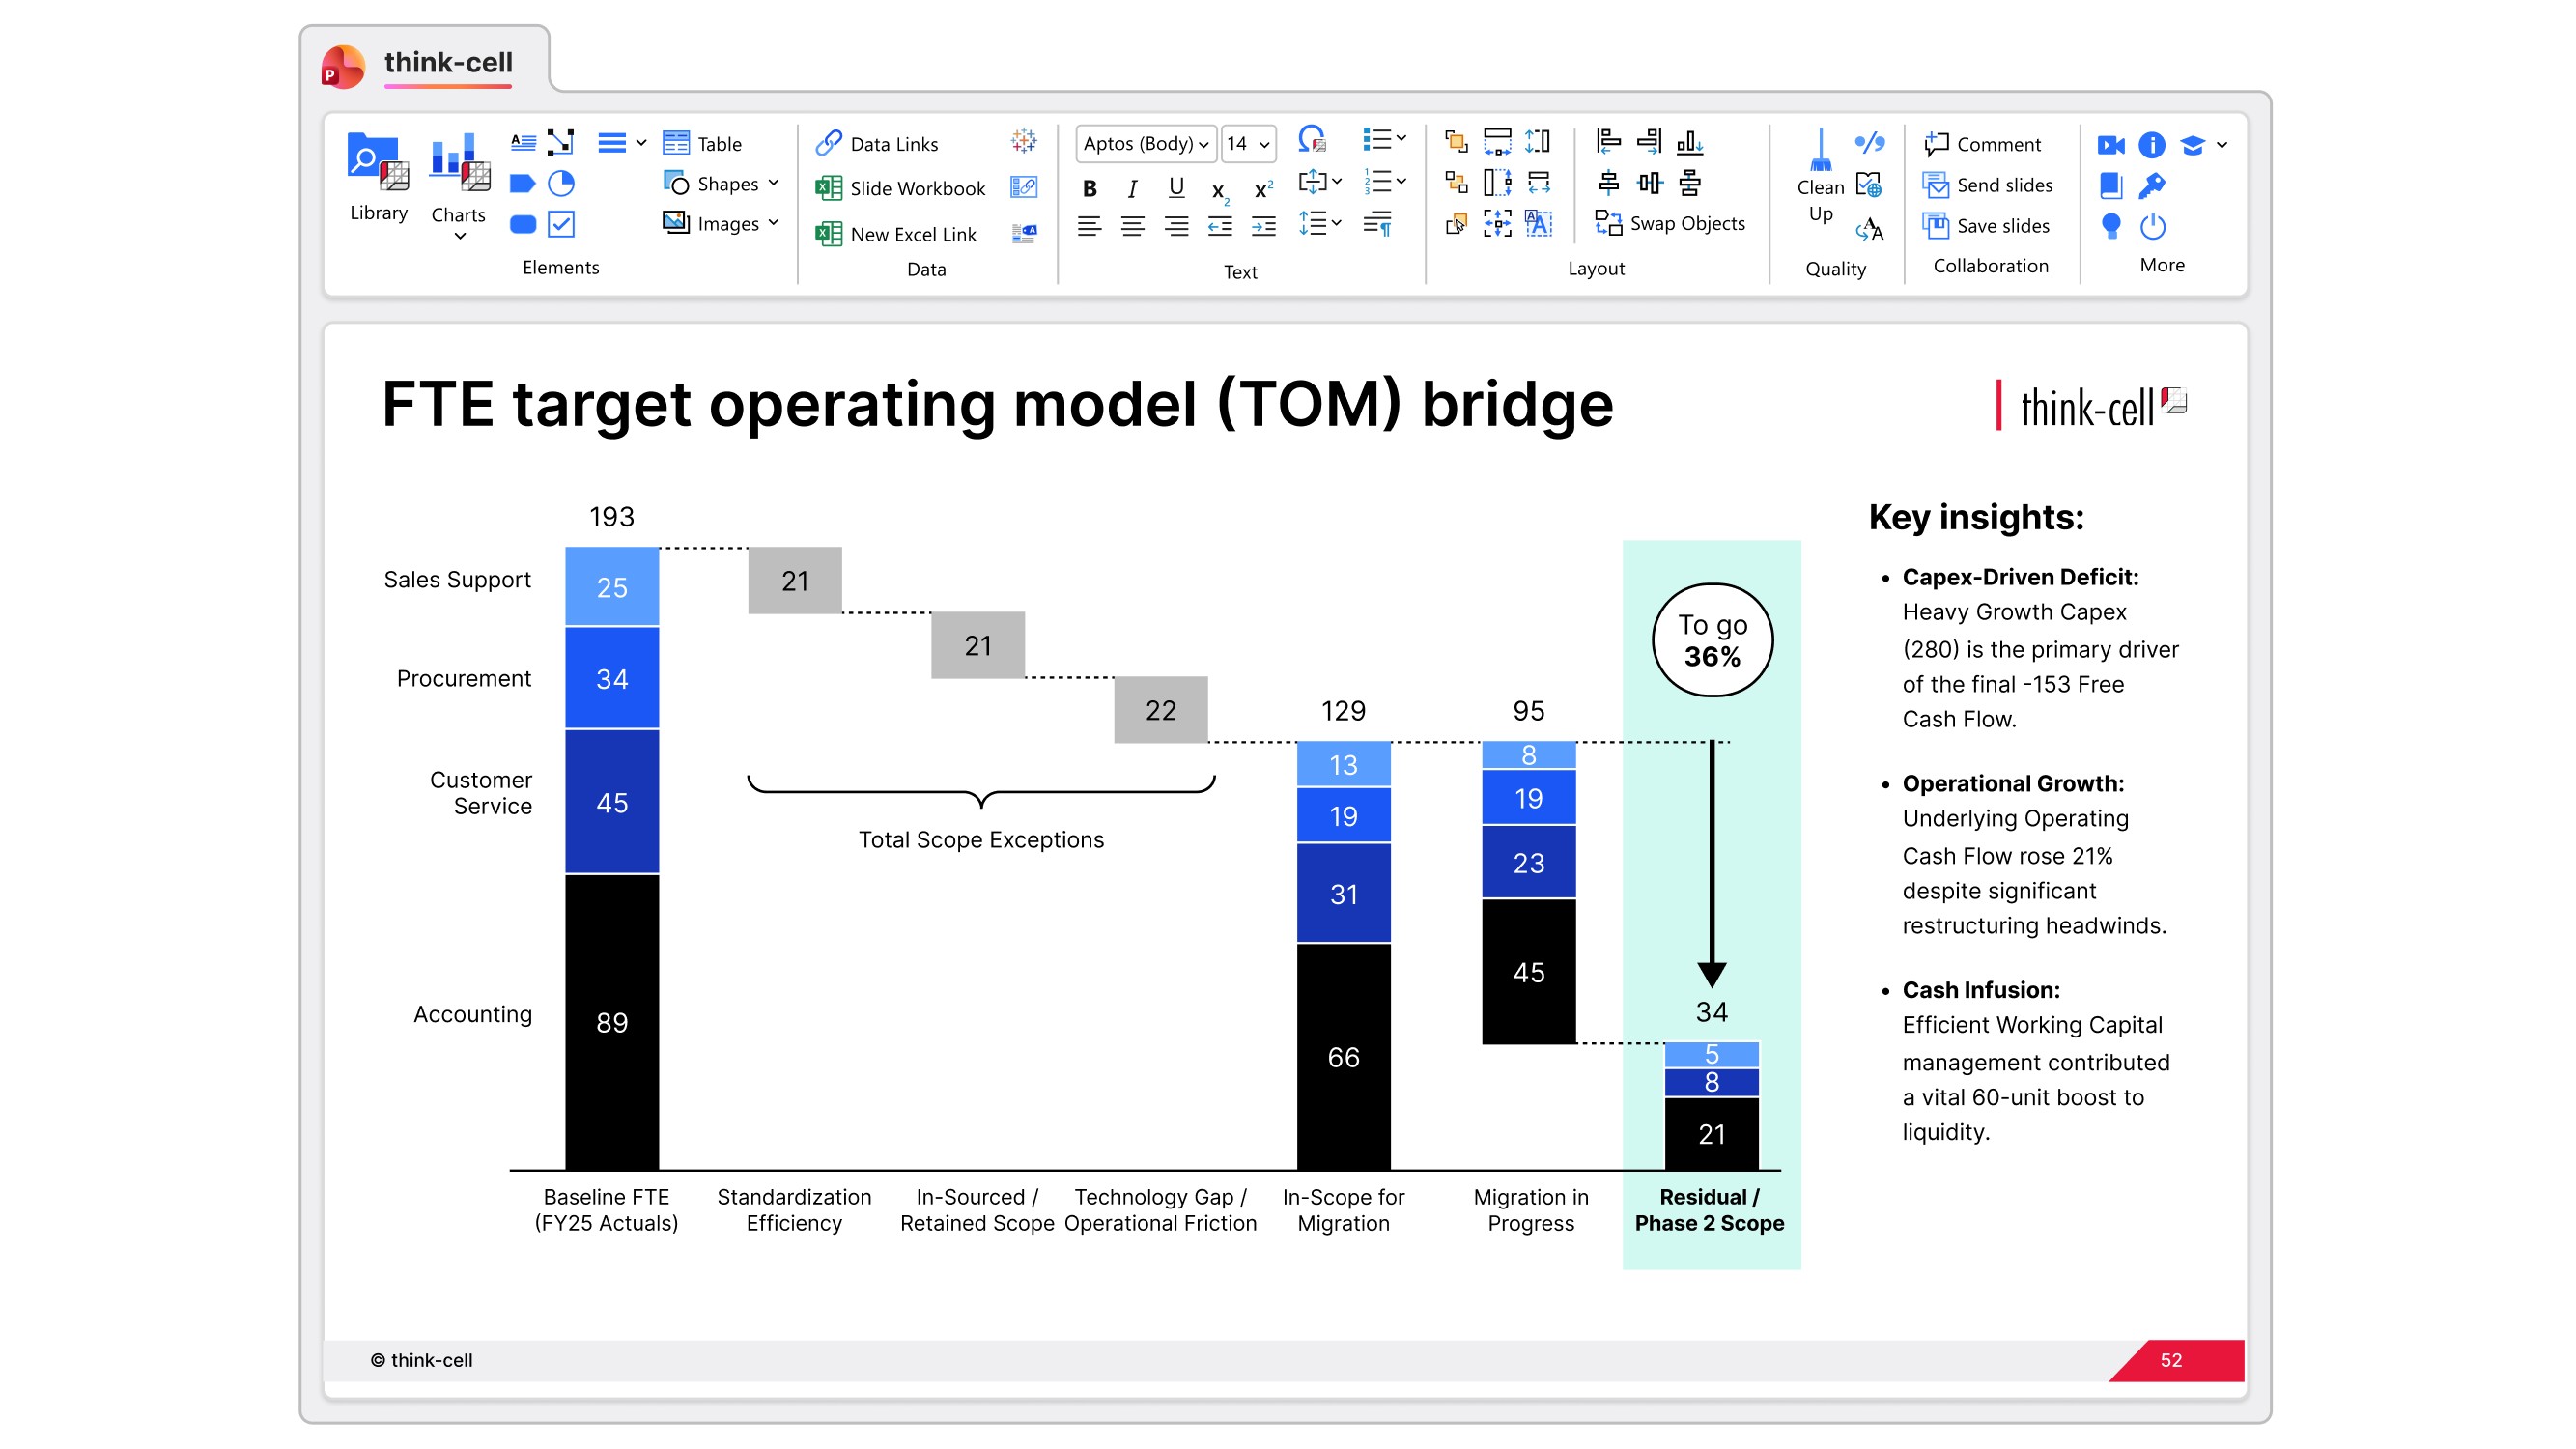
Build the template, then automate
Refine your monthly reporting workflow with tools that make creating and updating your slides easier.
- Build complex slides in minutes to turn around ad hoc requests faster.
- Resize, swap and snap elements into place with precision layout tools.
- Set up templates that pull live data from your model and refresh with zero rework.
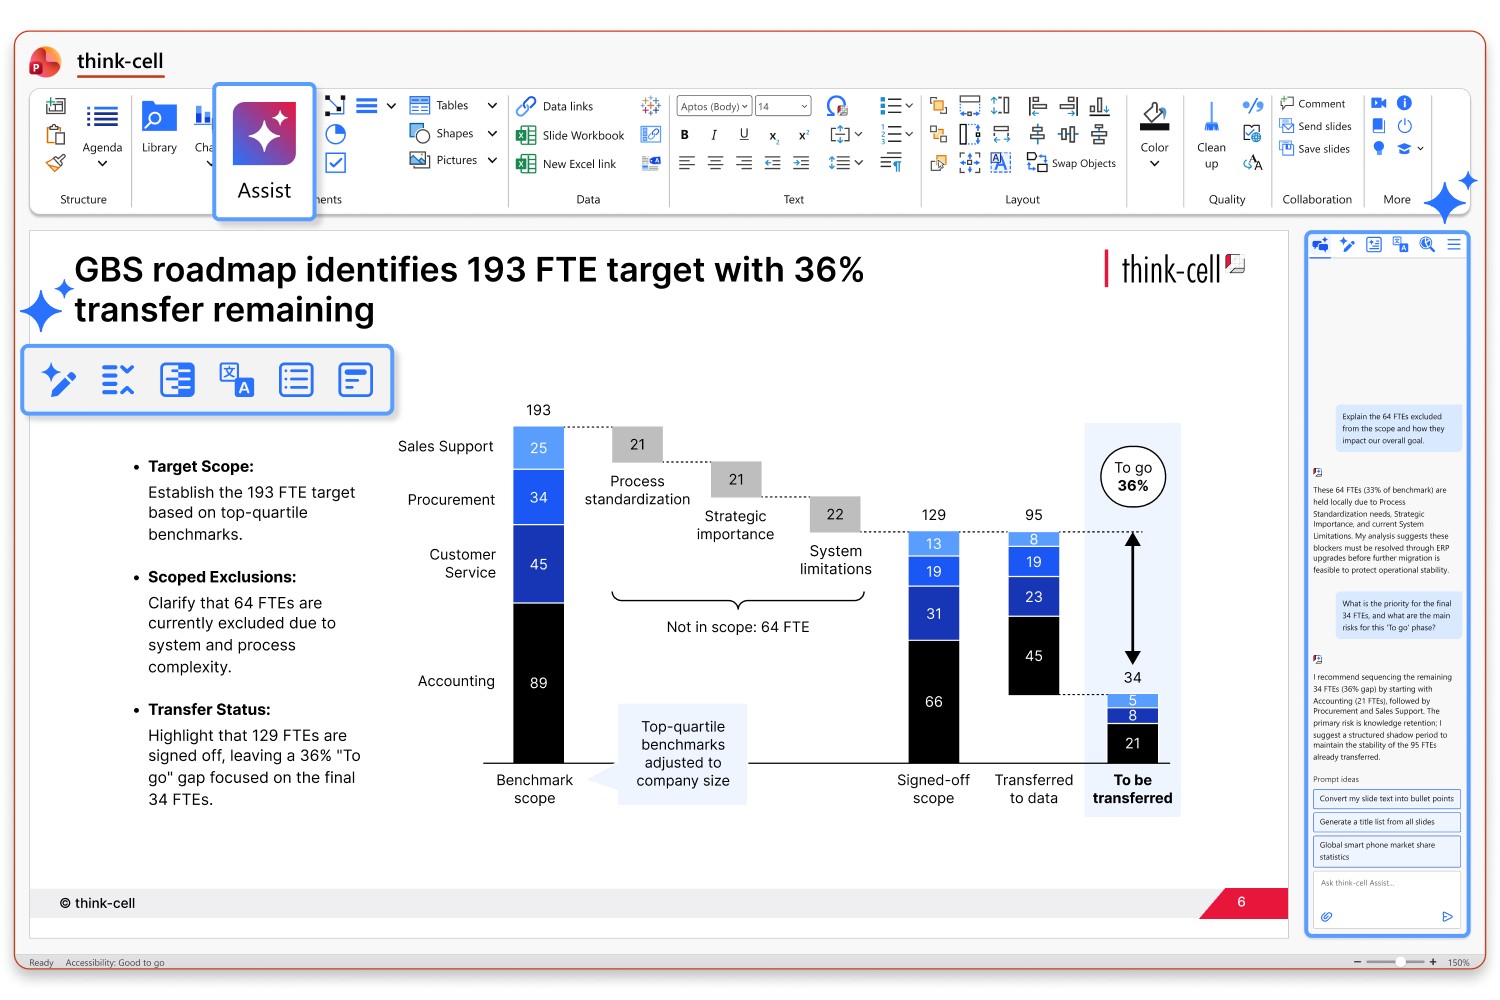
Accurate reporting and analysis with AI
Get AI integrated directly into PowerPoint and Excel to build accurate, board-ready slides, while keeping full control over every output.
- Build charts from your analysis in Excel, and pull it into a boardroom-ready chart in PowerPoint.
- Draft titles and summaries to communicate your analysis clearly.
- Open the chart’s datasheet to adjust or extend figures for your next reporting cycle.
Update your next monthly report in minutes, not hours
How financial analysts use think-cell to create polished CFO-ready slides
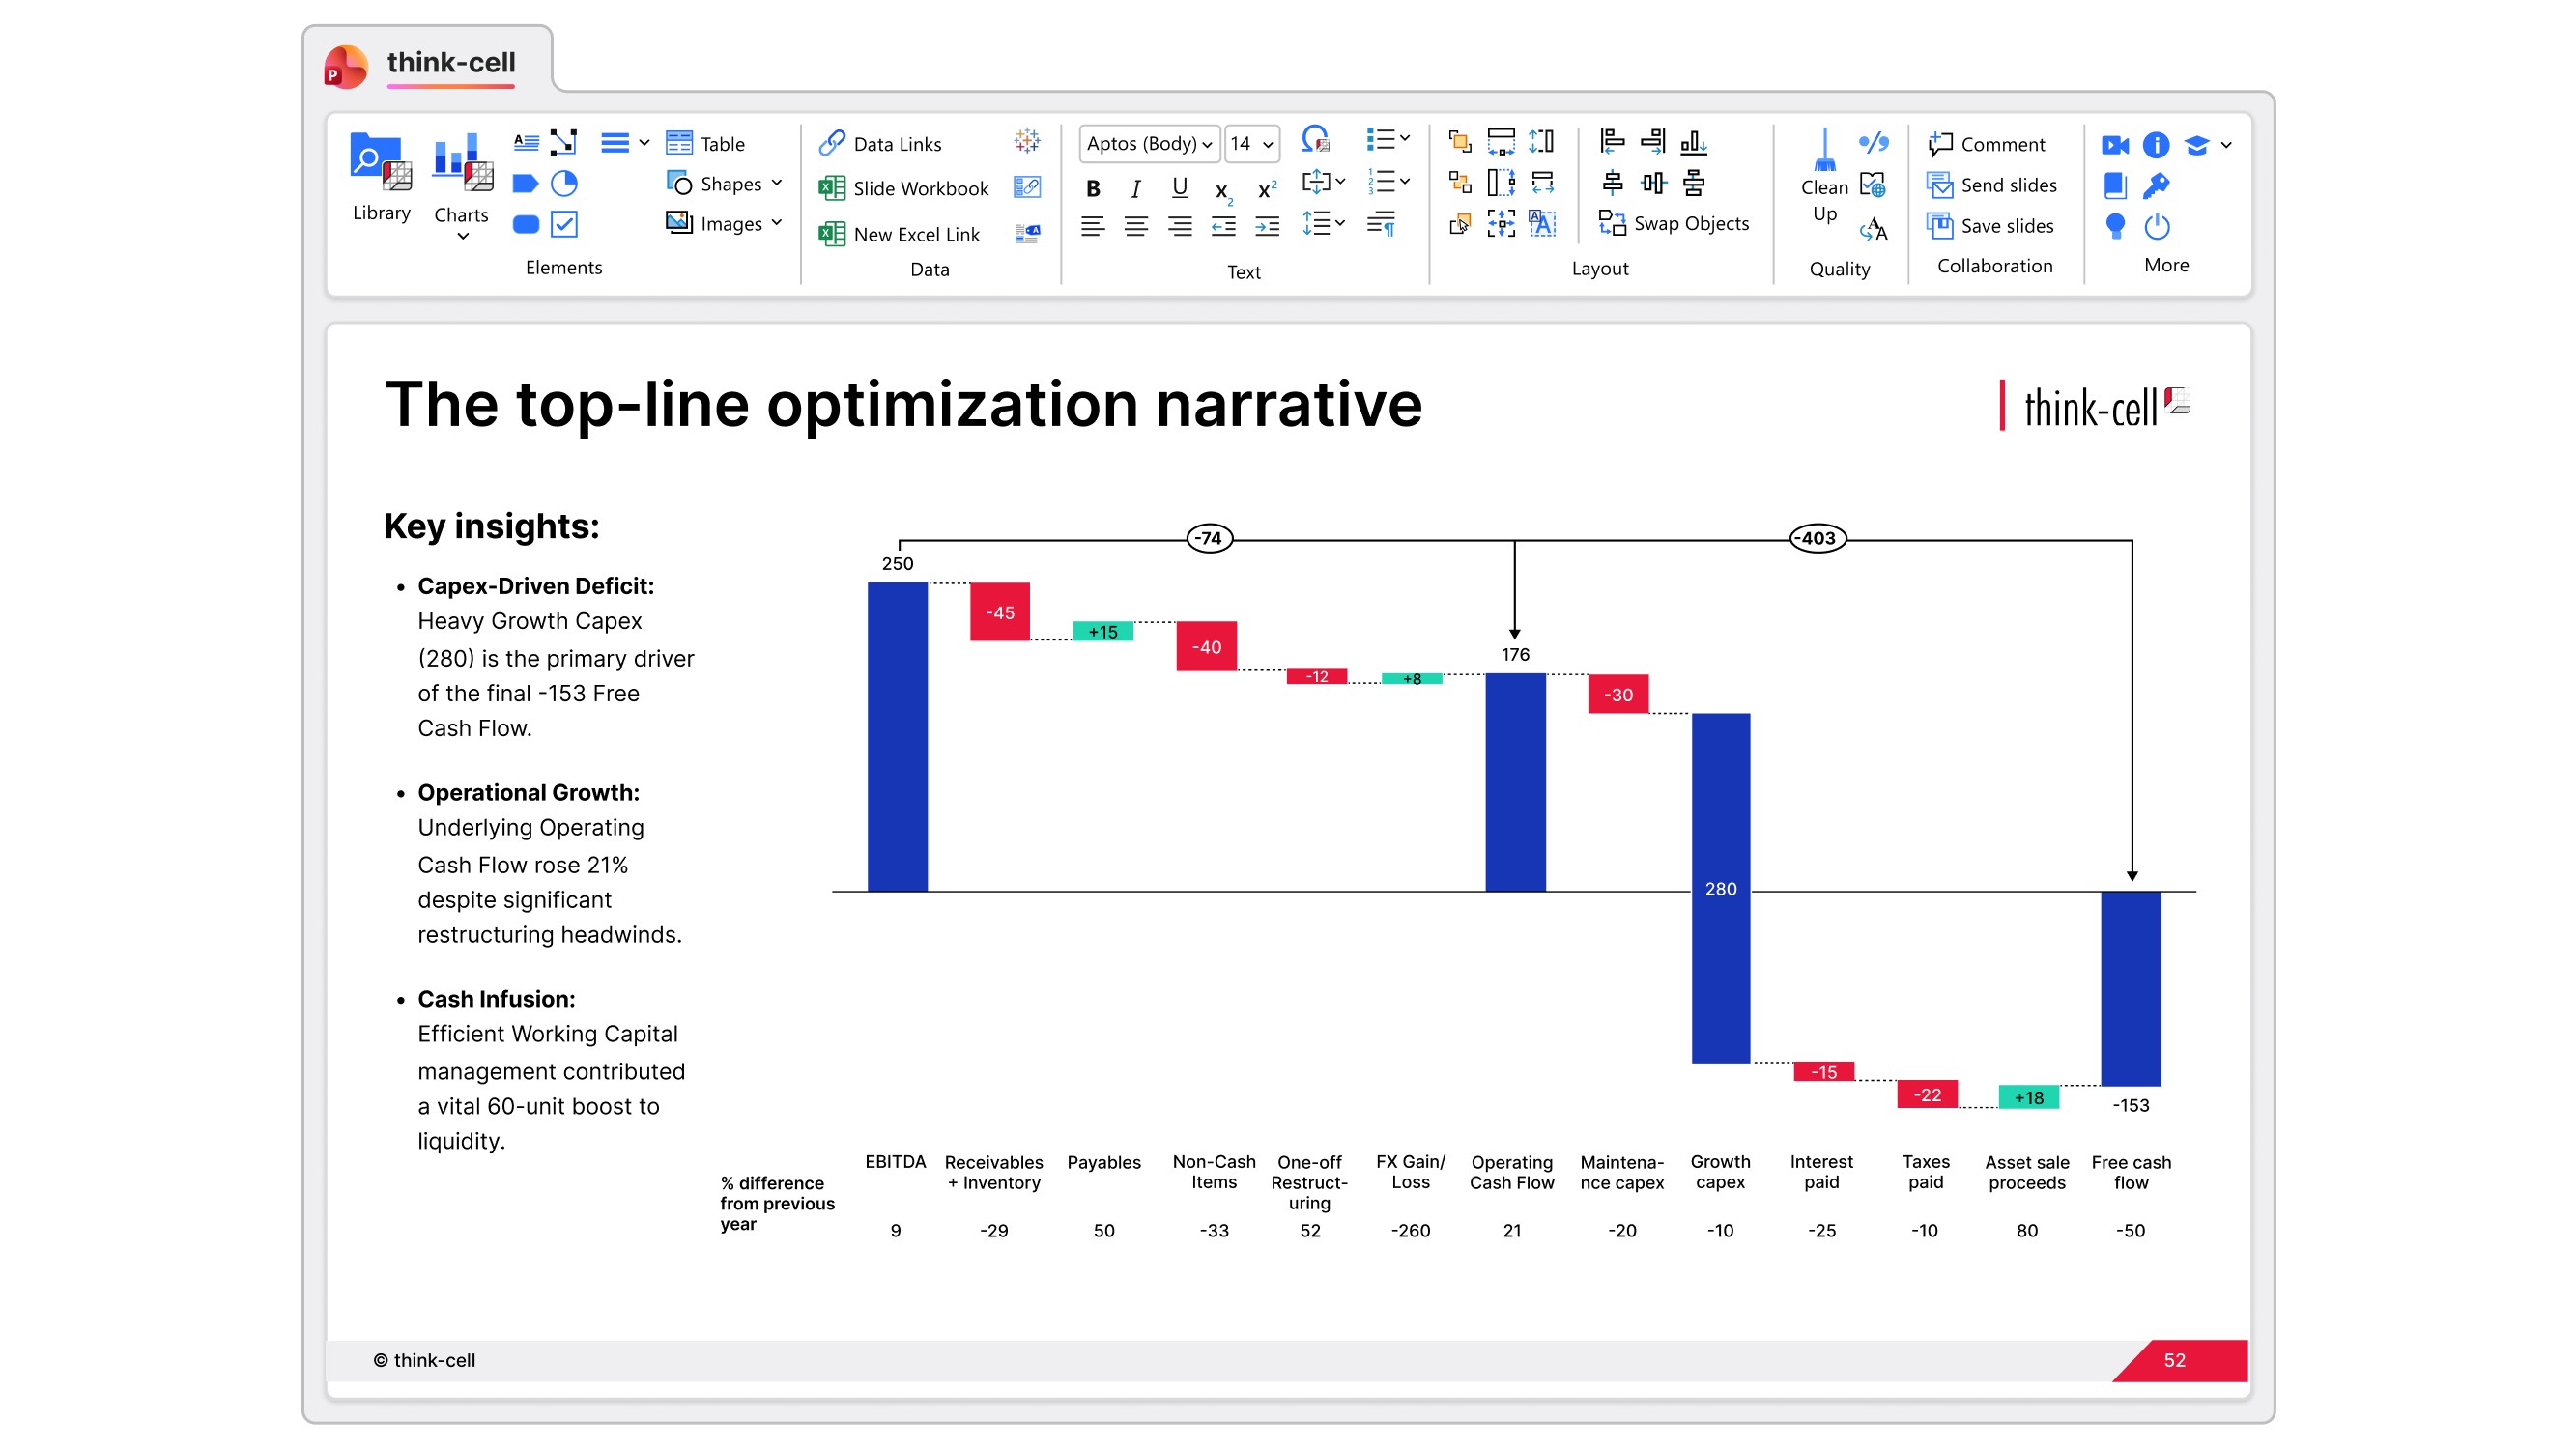
Build waterfall charts in two minutes, not twenty. No invisible stacked columns or dummy data. Just a polished chart for P&L statements and EBITDA bridges.
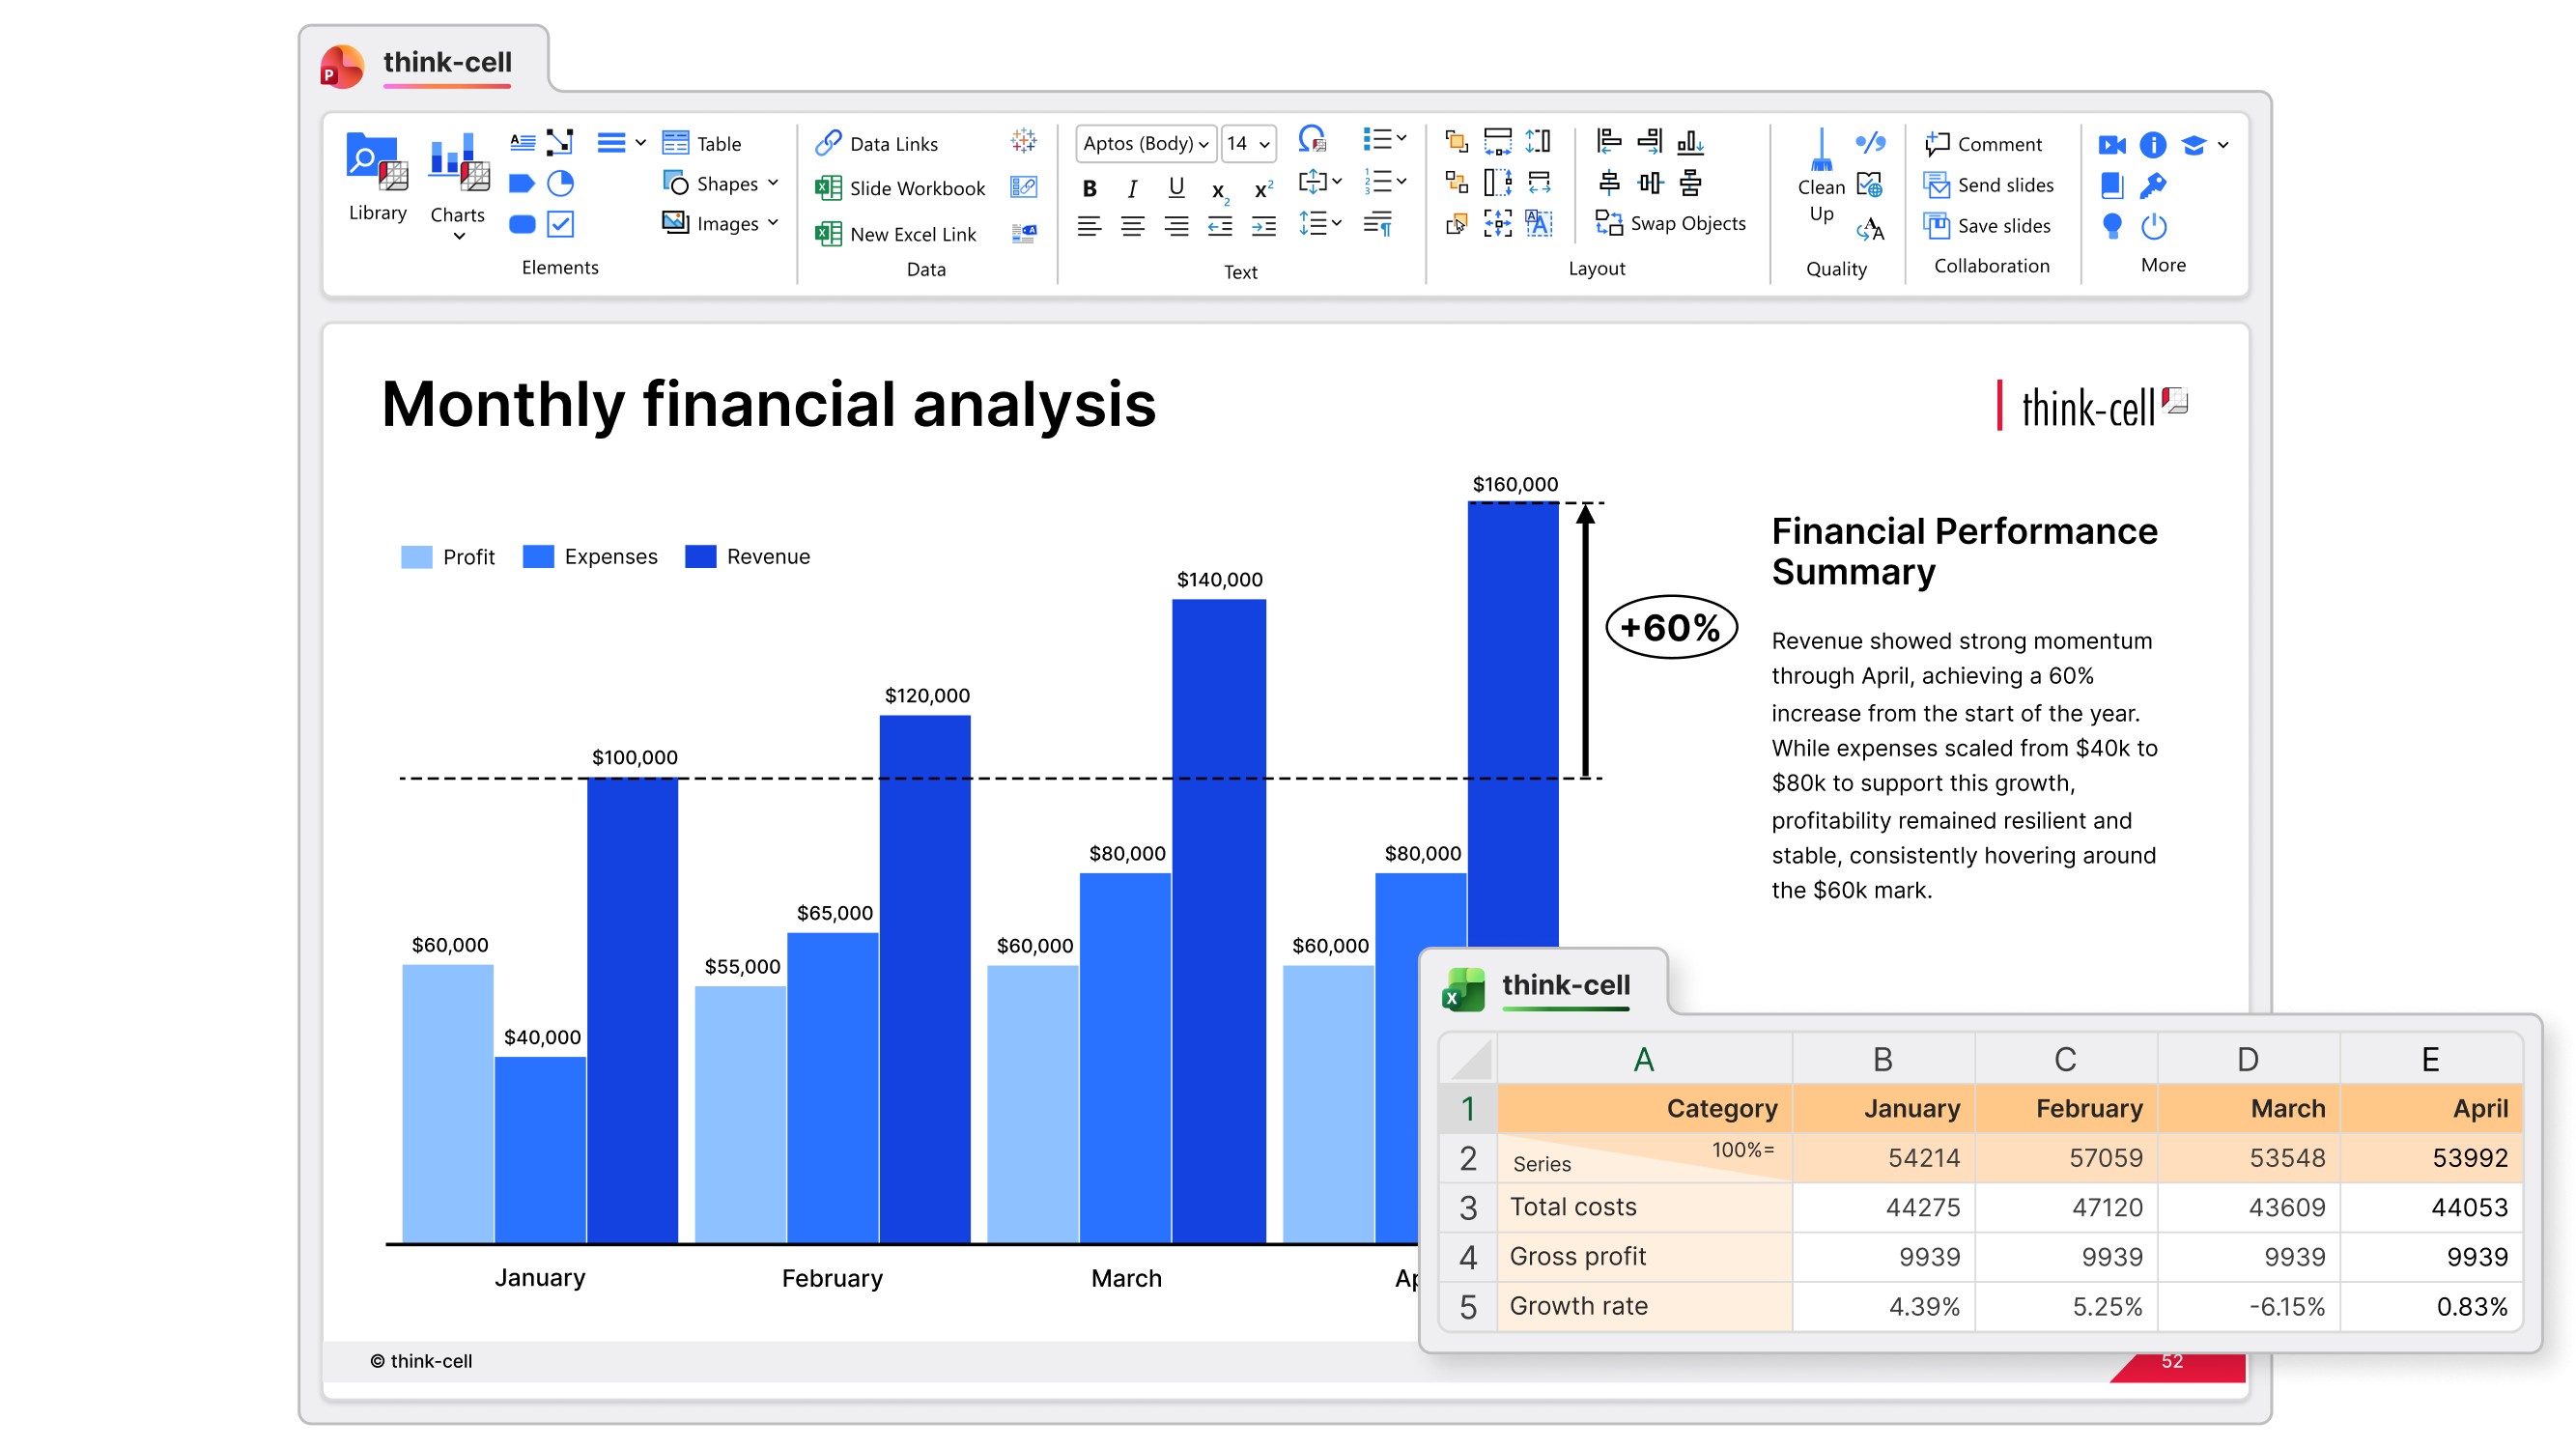
Show variance with clustered charts and linked tables that update together. Highlight what changed and by how much, without rebuilding the slide each month.
Break down cost structures with stacked charts. Add difference arrows that auto-calculate and reposition when the data updates.
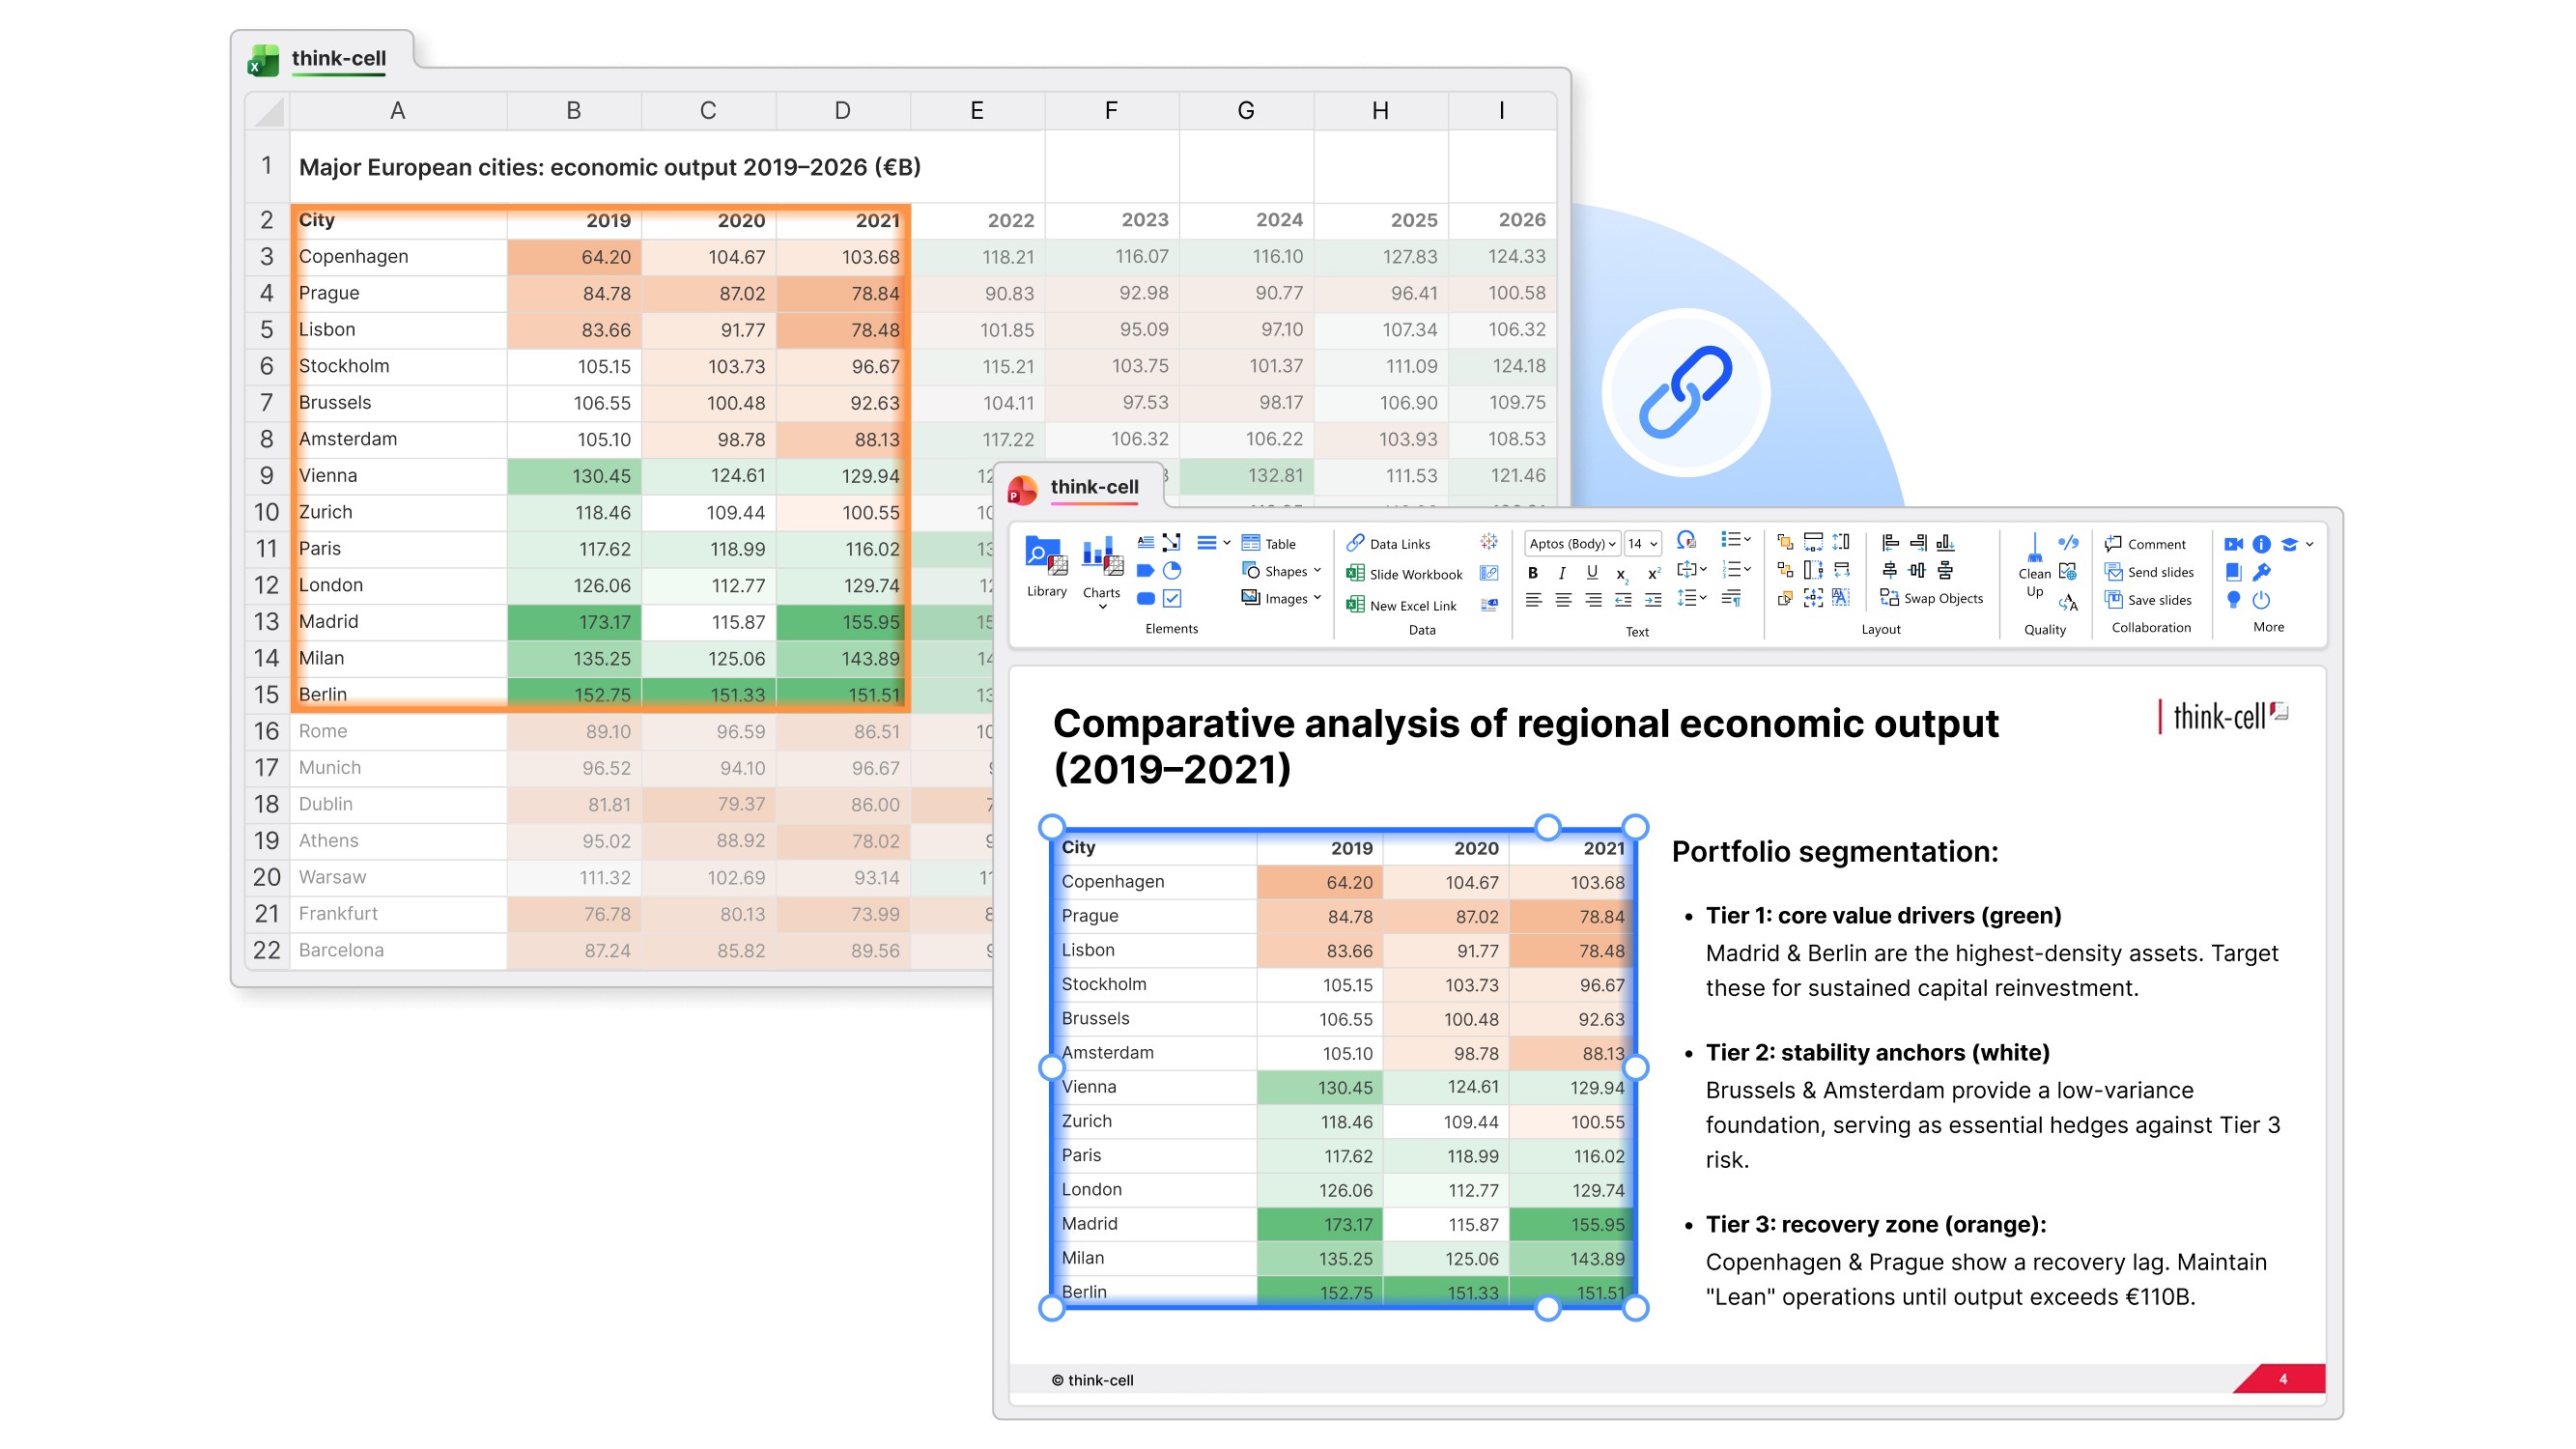
Pull Excel tables into PowerPoint with conditional formatting intact. When the data refreshes, you won’t lose your heat map.
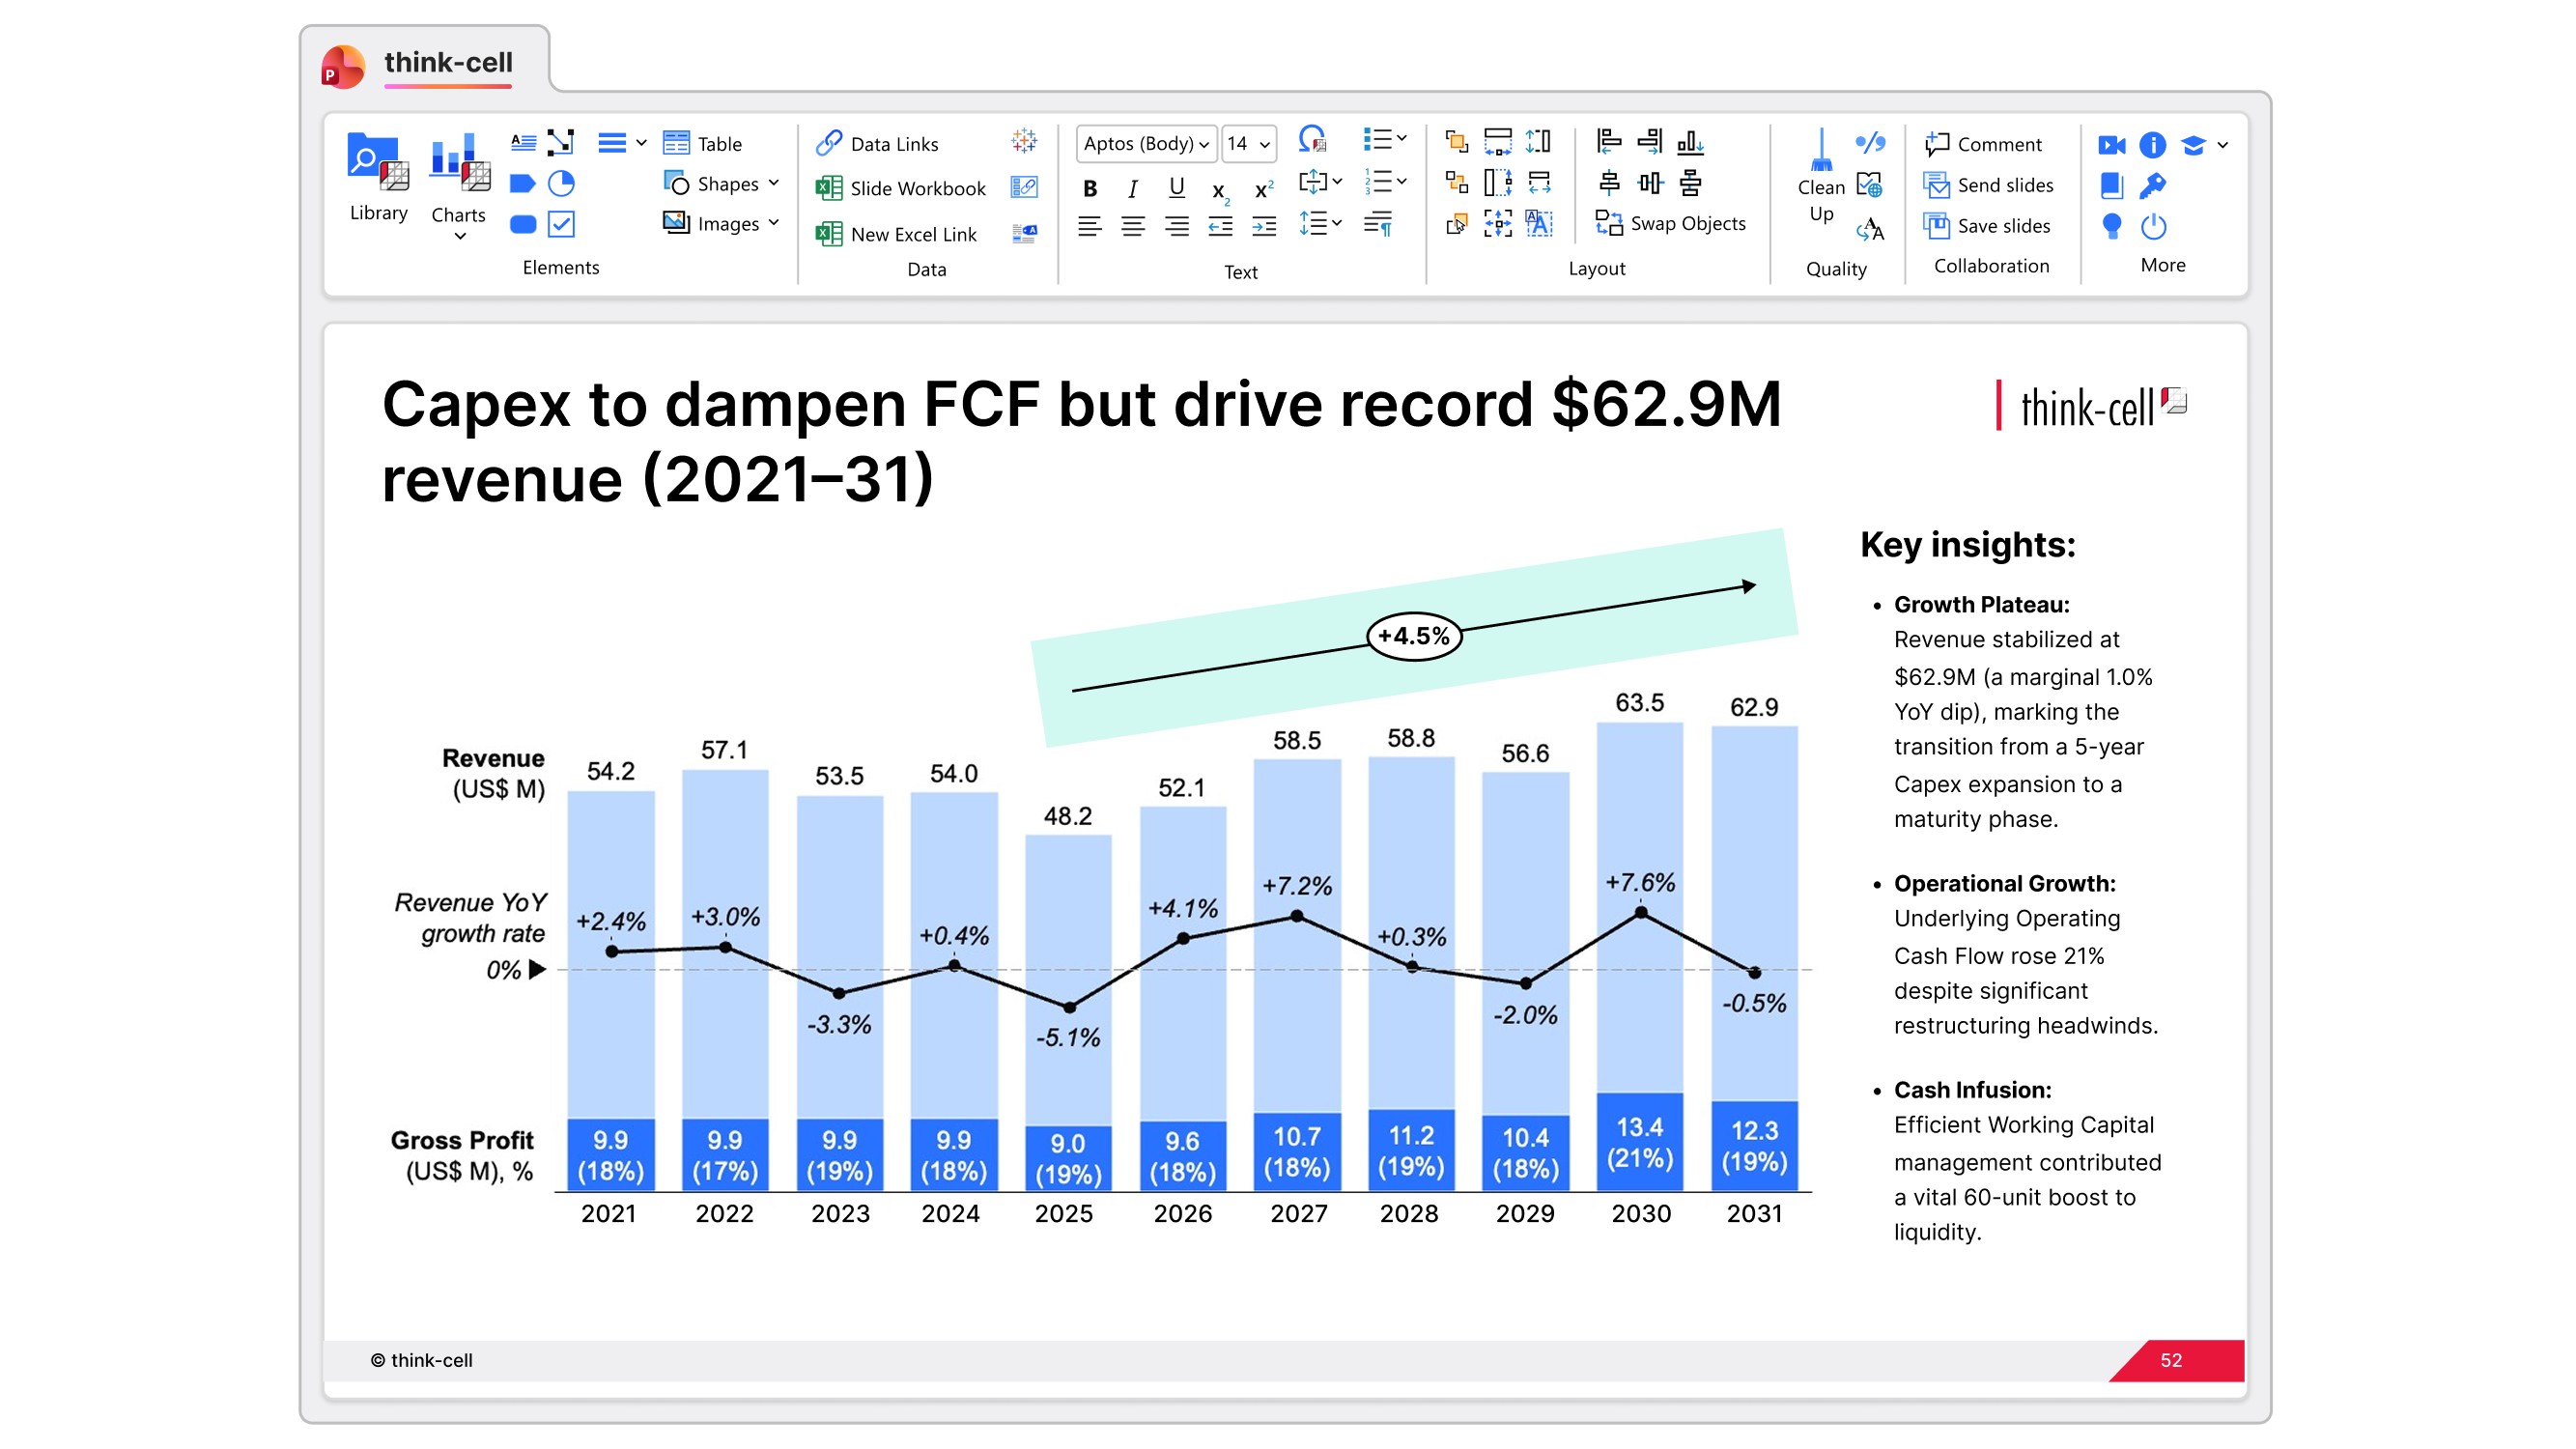
Compare scenarios with line charts and CAGR arrows that recalculate automatically when assumptions change. No manual redrawing.
What our customers say

Automating chart creation and updates cuts the time spent on presentations by half, allowing the team to focus more on analysis and less on formatting.

We automate our reports by establishing links not just to chart data ranges, but to every single cell that contains a value. In this way, think-cell’s Excel links helps us generate our reports faster, while also guaranteeing 100% accuracy.

If I need 10 minutes to create a chart natively in PowerPoint, think-cell reduces this to just 3-5 minutes.


It took me 2 hours to prepare a report for a regular meeting, and I spent 25% of that time, or half an hour, on modifying the charts. With think-cell, I can do this in a few clicks, or in a few seconds. The time I save can be used for thinking about suggestions and analysis.
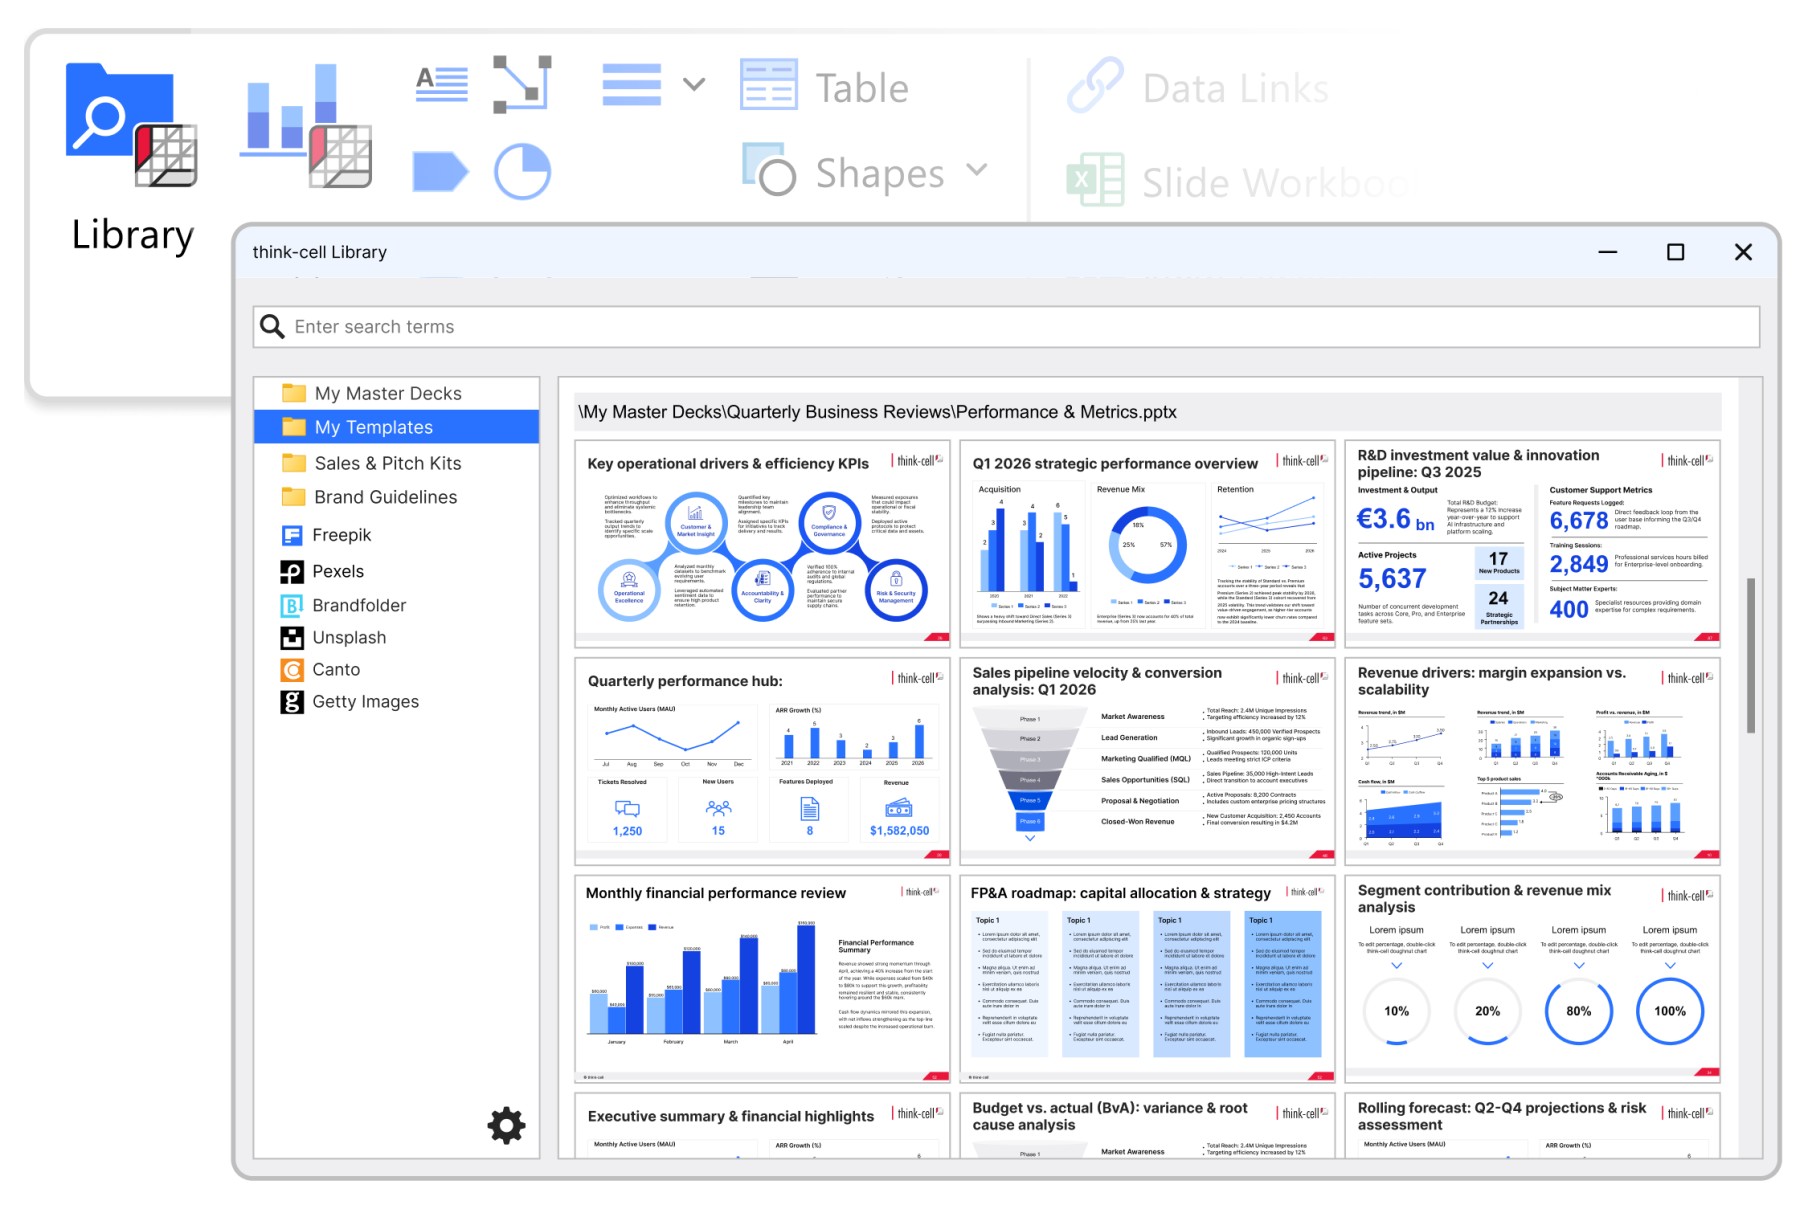
Reuse instead of rebuild
You've built hundreds of slides. So has your team. think-cell Library makes them searchable, so you spend less time redoing work that already exists.
Build great slides in less time
Try think-cell for free. Get full access to advanced charts, a slide template library, and smart layout tools. No credit card required.