几分钟内制作财务图表
- 用可自动更新的图表,快速制作CFO级演示文稿。
- 将幻灯片连接到Excel数据源,确保100%准确。
- 少花时间排版,多花时间做分析。
think-cell 数据一览
全球终端用户
客户
财富 100 强公司
在PowerPoint中节省70%工作时间,成为业务战略伙伴
以速度与精度打造整套演示,从为排版焦头烂额到轻松分享分析与洞察。
快速制作复杂的财务演示
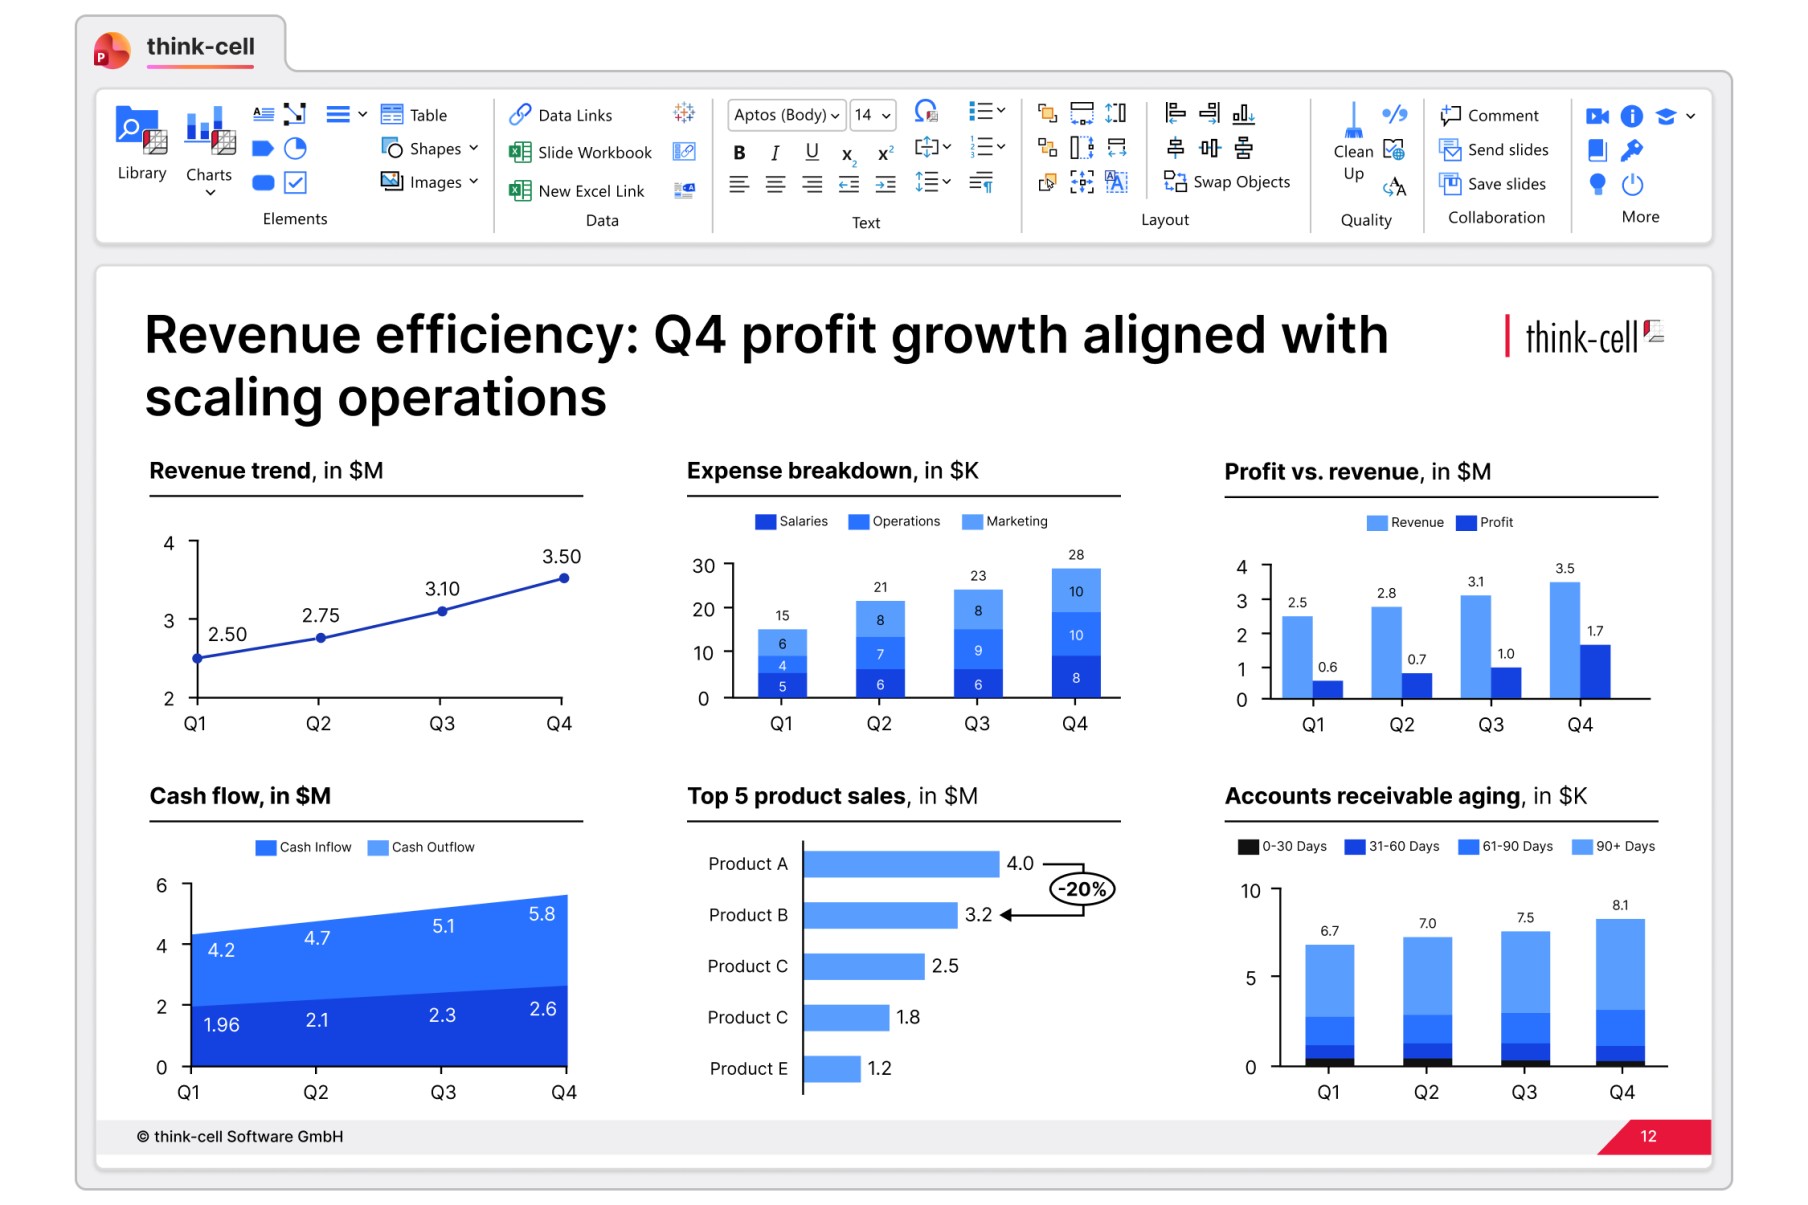
构建40+种数据可视化,快速响应需求。
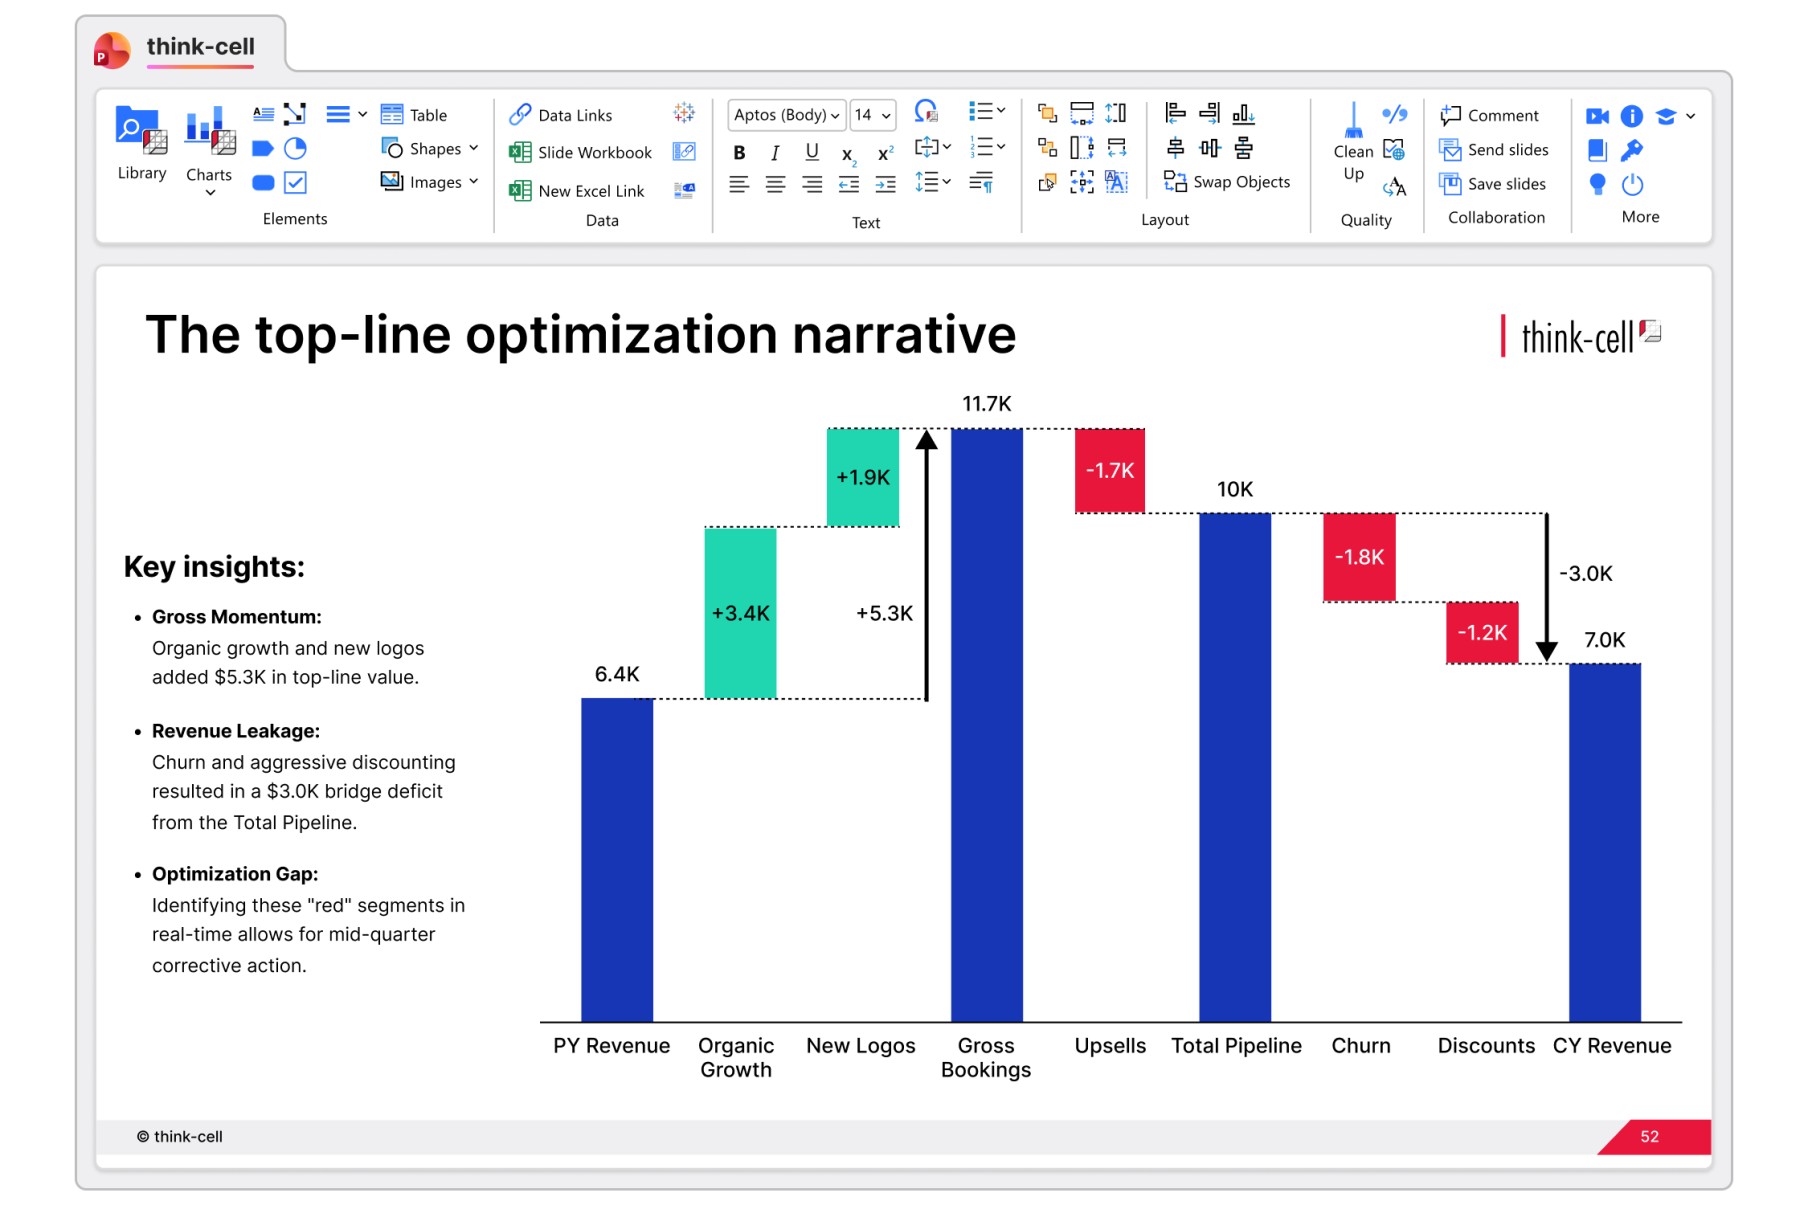
- 两分钟生成瀑布图,无需繁琐的变通做法。
- 用自动计算的增强元素突出关键洞察,并精准定位到位。
- 将图表连接到Excel,兼顾可控性与数据一致性。
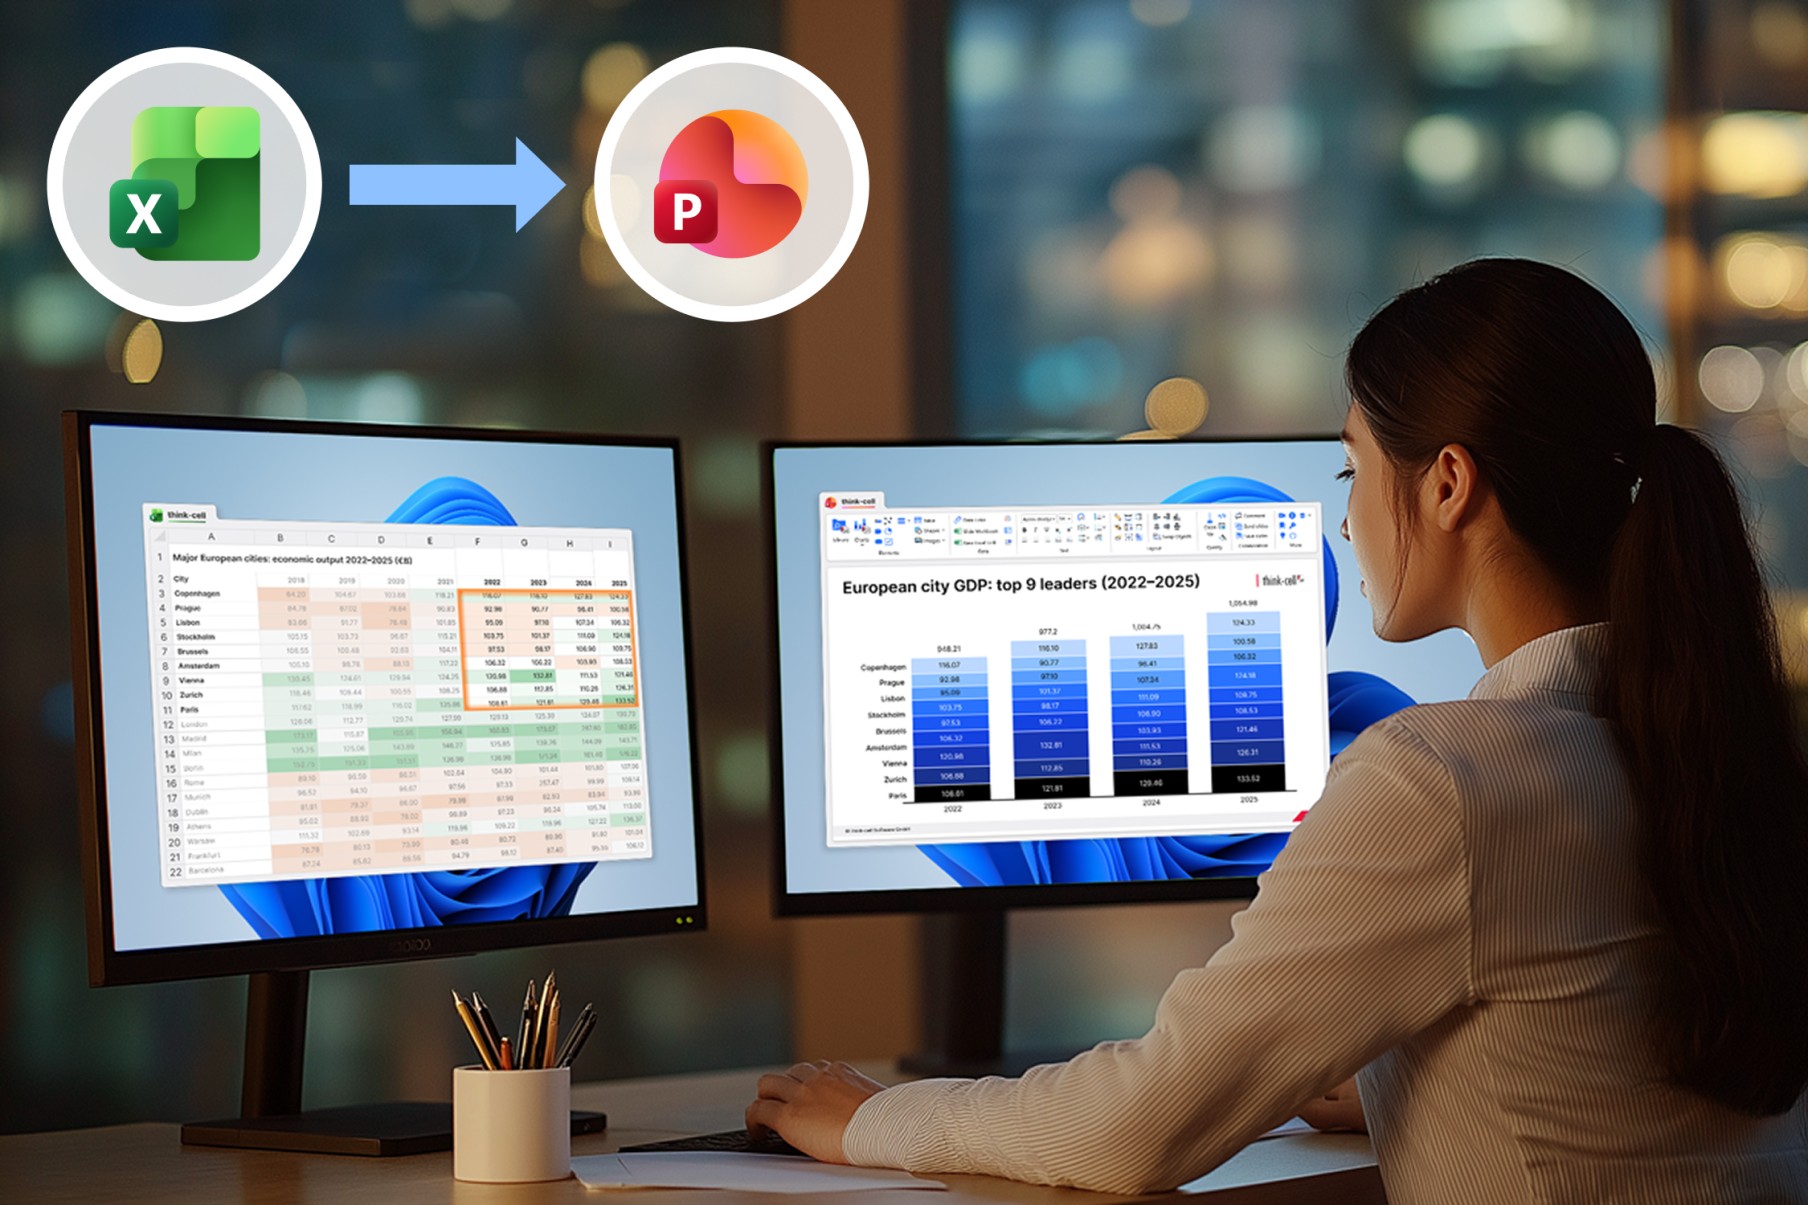
在Excel中建模,在PowerPoint中呈现
在电子表格中搭建模型并连接到演示文稿,需要展示时再打开PowerPoint即可。
- 选中Excel数据,选择图表类型,放到幻灯片上。不到一分钟搞定。
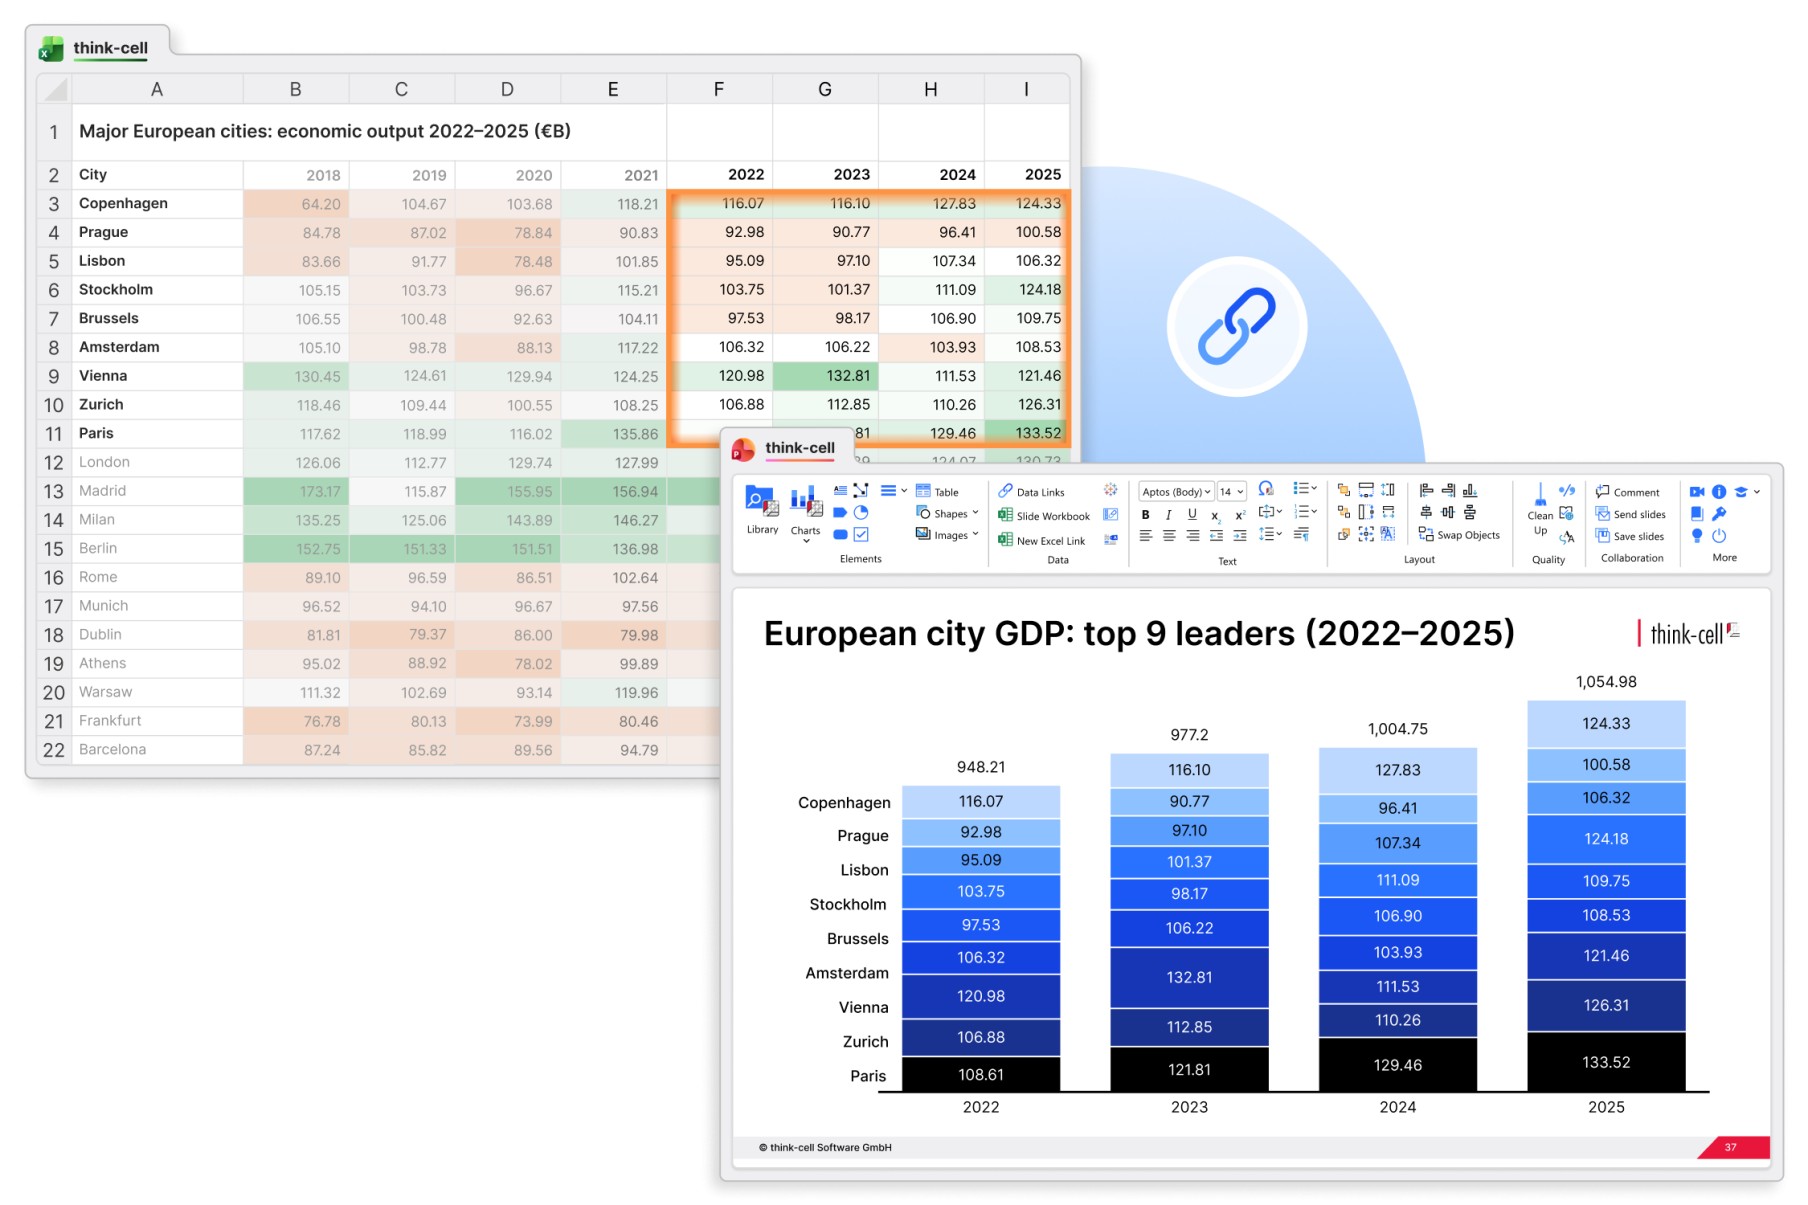
- 将表格与热力图链接进整套演示的图表中,实现准确汇报。
- 只需点击一次,即可用一个Excel主文件更新多张幻灯片。
先搭模板,再自动化
用更易创建与更新幻灯片的工具,优化你的月度汇报流程。
- 几分钟内完成复杂页面,更快响应临时需求。
- 借助精确布局工具,精准缩放、替换并吸附对齐各元素。
- 设置可从模型拉取实时数据的模板,刷新无需返工。
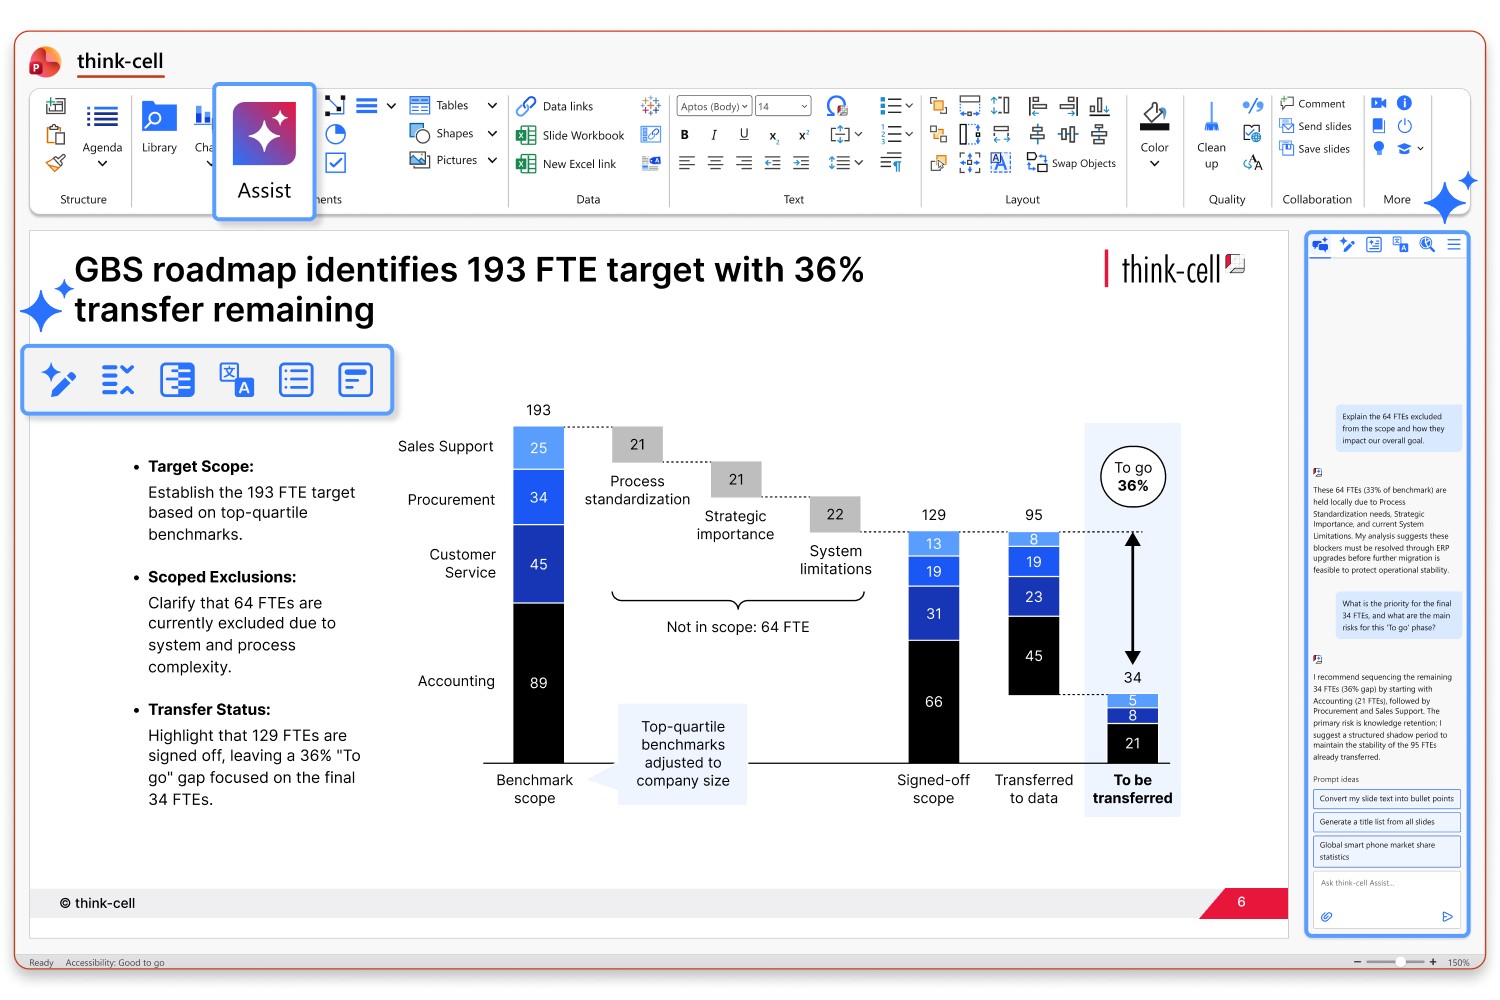
借助 AI 实现精准报告与分析
将 AI 直接集成到 PowerPoint 和 Excel 中,生成准确、可用于董事会汇报的幻灯片,同时对每一项输出都保持完全掌控。
- 在 Excel 中基于你的分析制作图表,并将其导入 PowerPoint,生成适合会议汇报的专业图表。
- 起草标题和摘要,清晰传达你的分析结论。
- 打开图表的数据表,调整或扩展数据,用于下一轮报告周期。
下一份月报,用分钟完成,而不是用小时
财务分析师如何使用 think-cell 制作精致的CFO级幻灯片
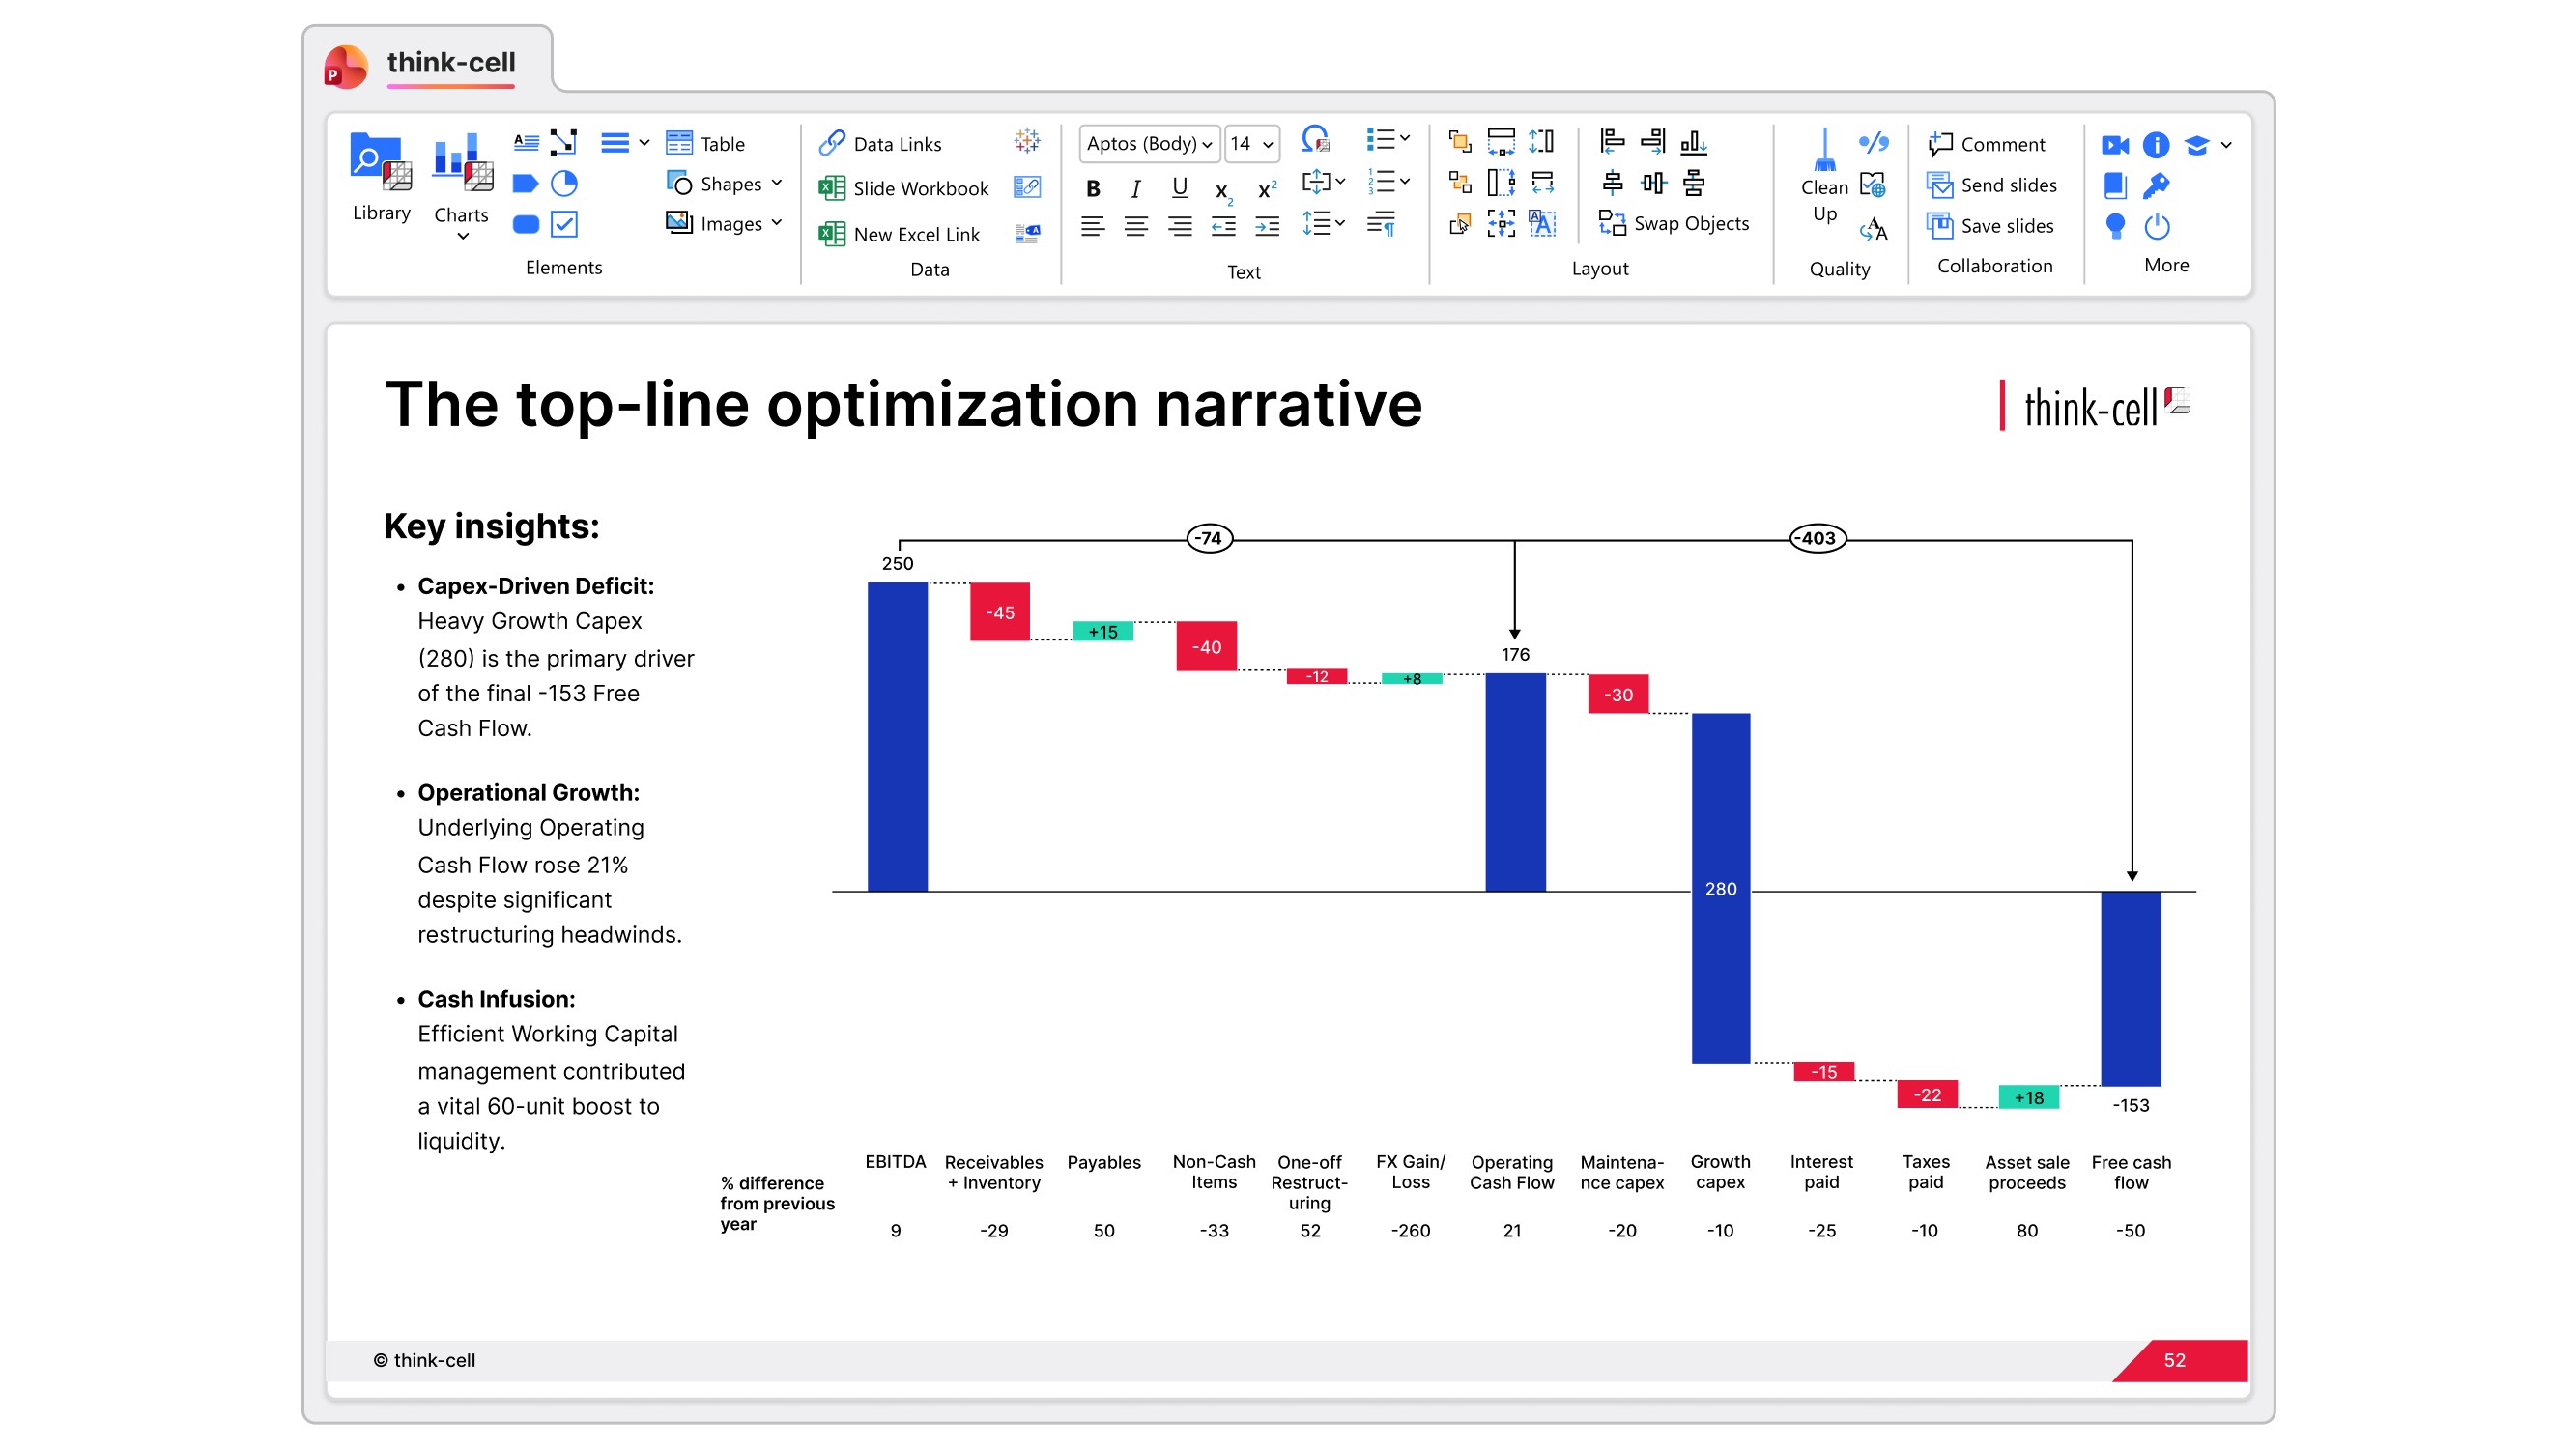
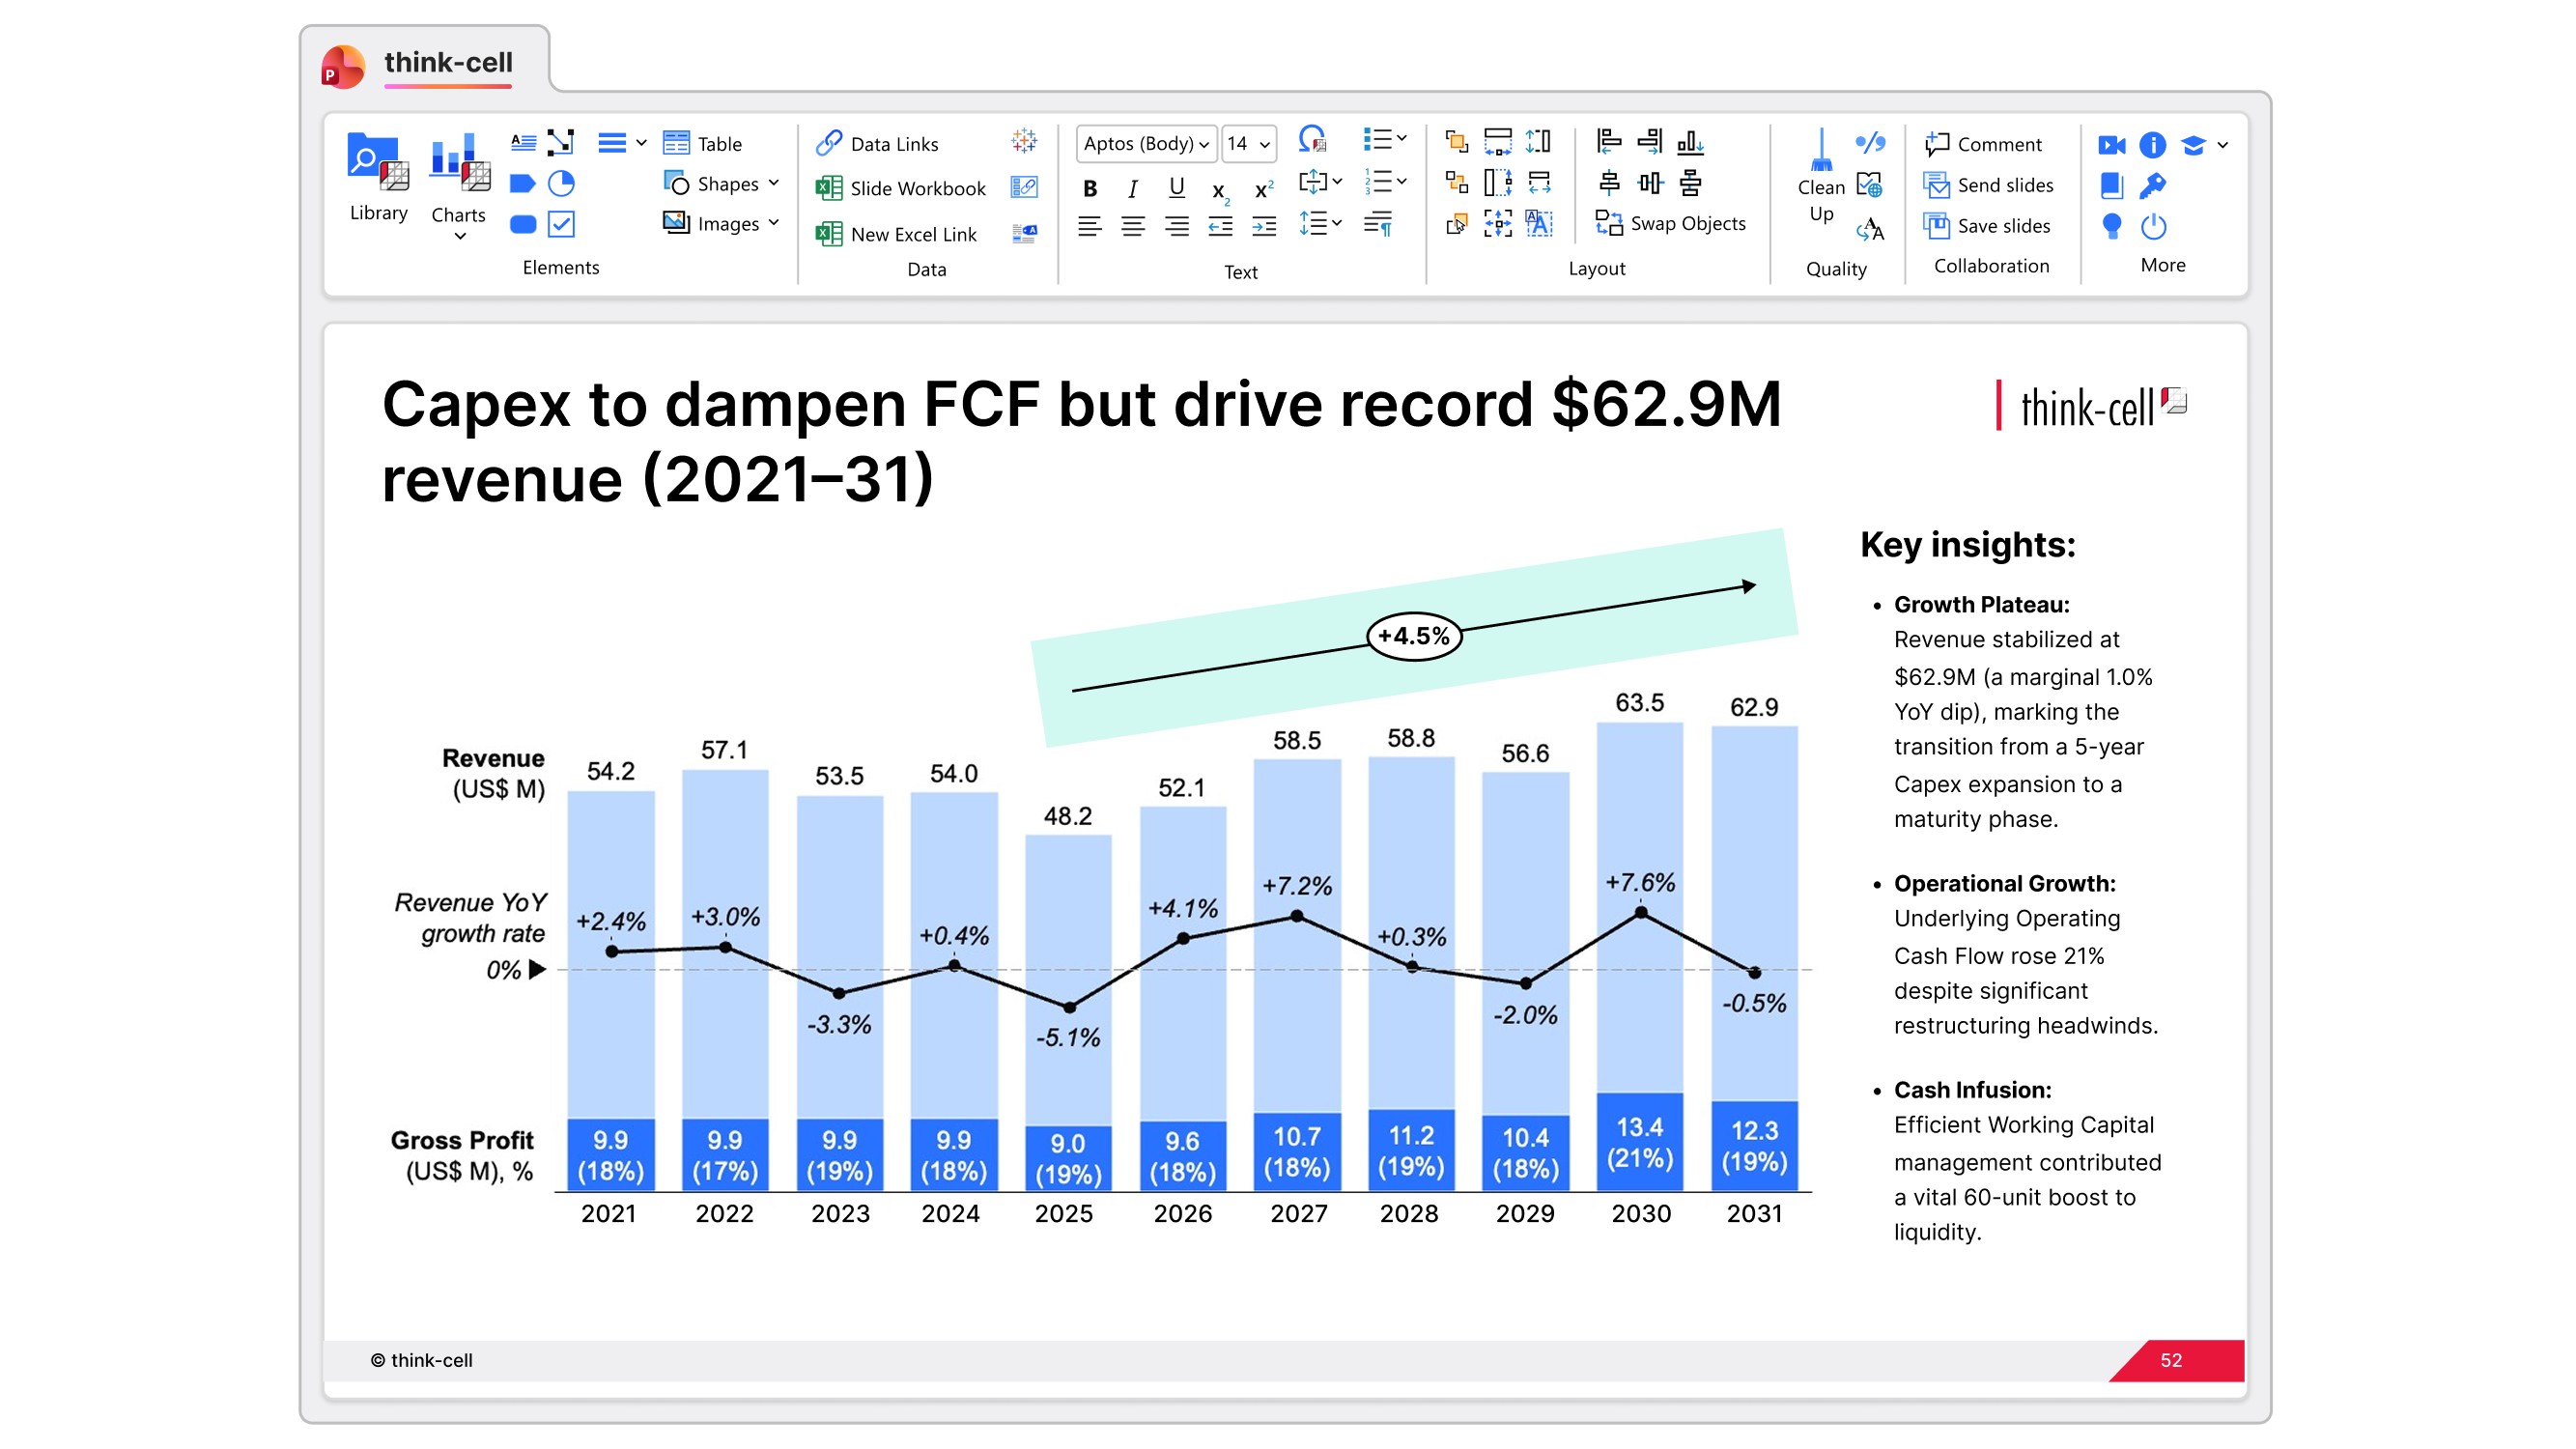
两分钟制作瀑布图,而不是二十分钟。无需隐藏的堆叠列或虚拟数据。只需一张精致图表,即可用于损益表与EBITDA桥接分析。
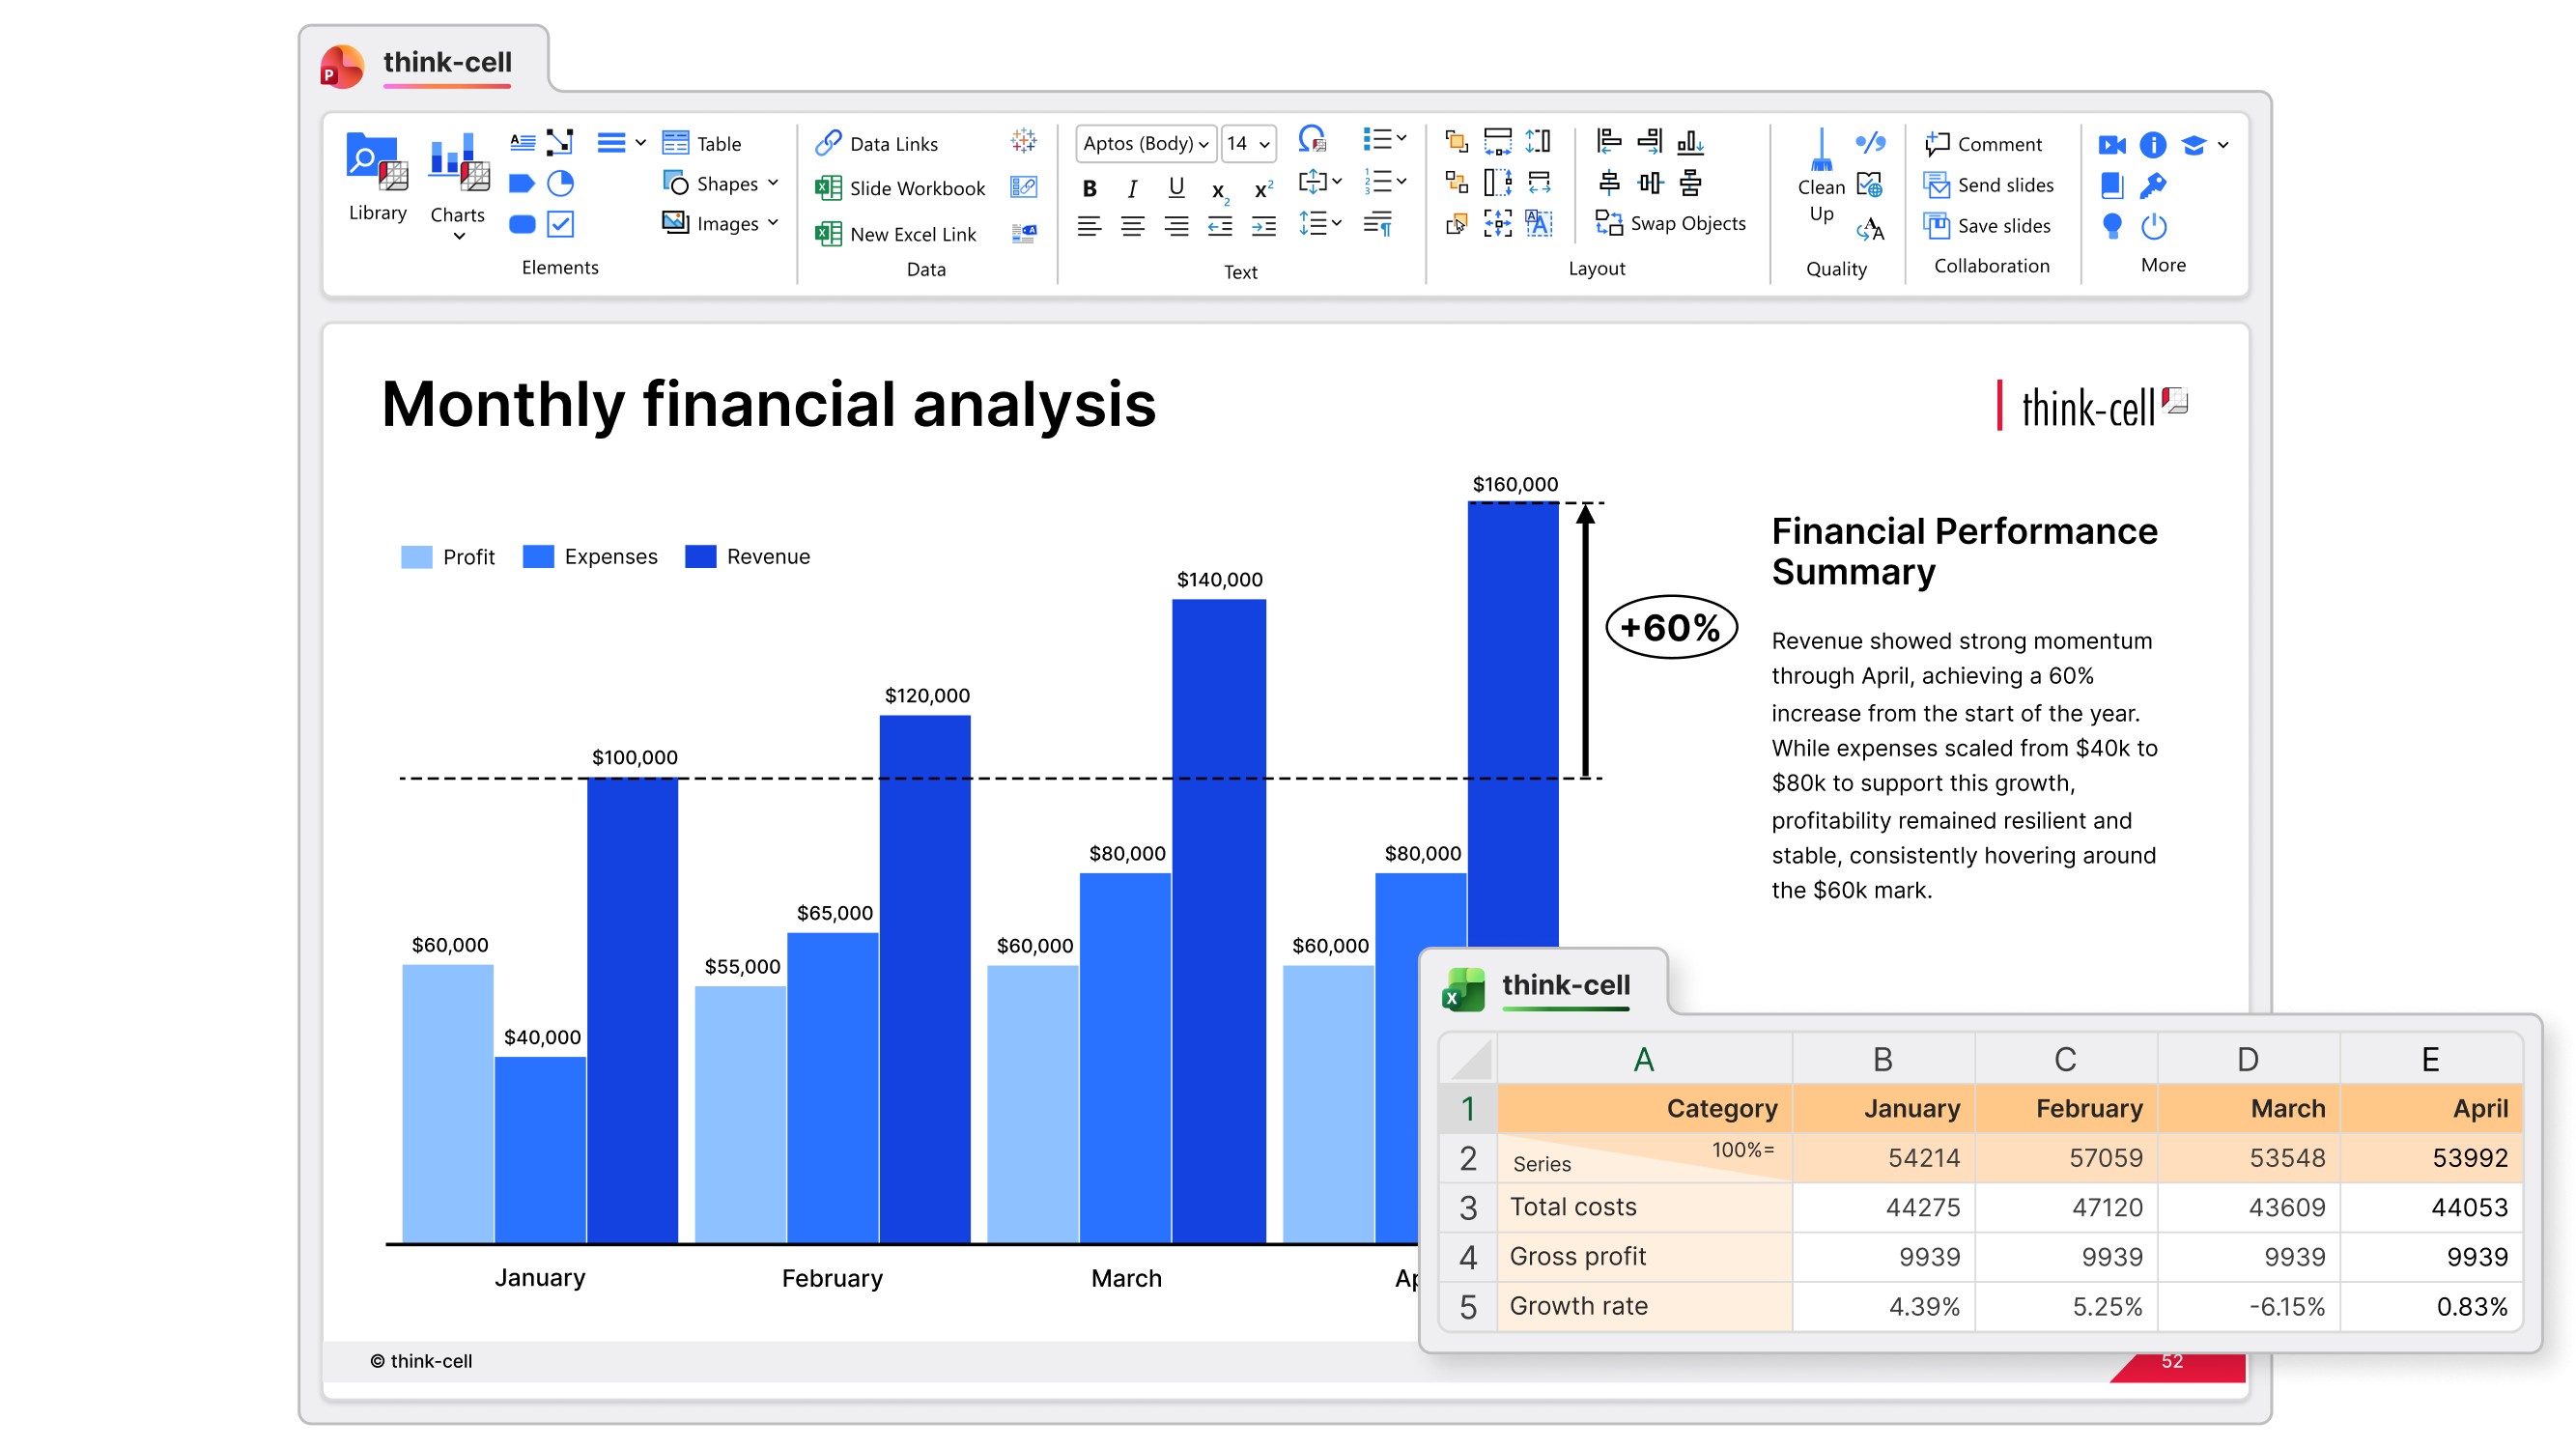
用簇状图与联动表格展示差异,同步更新。清晰突出变化项及变化幅度,无需每月重做页面。
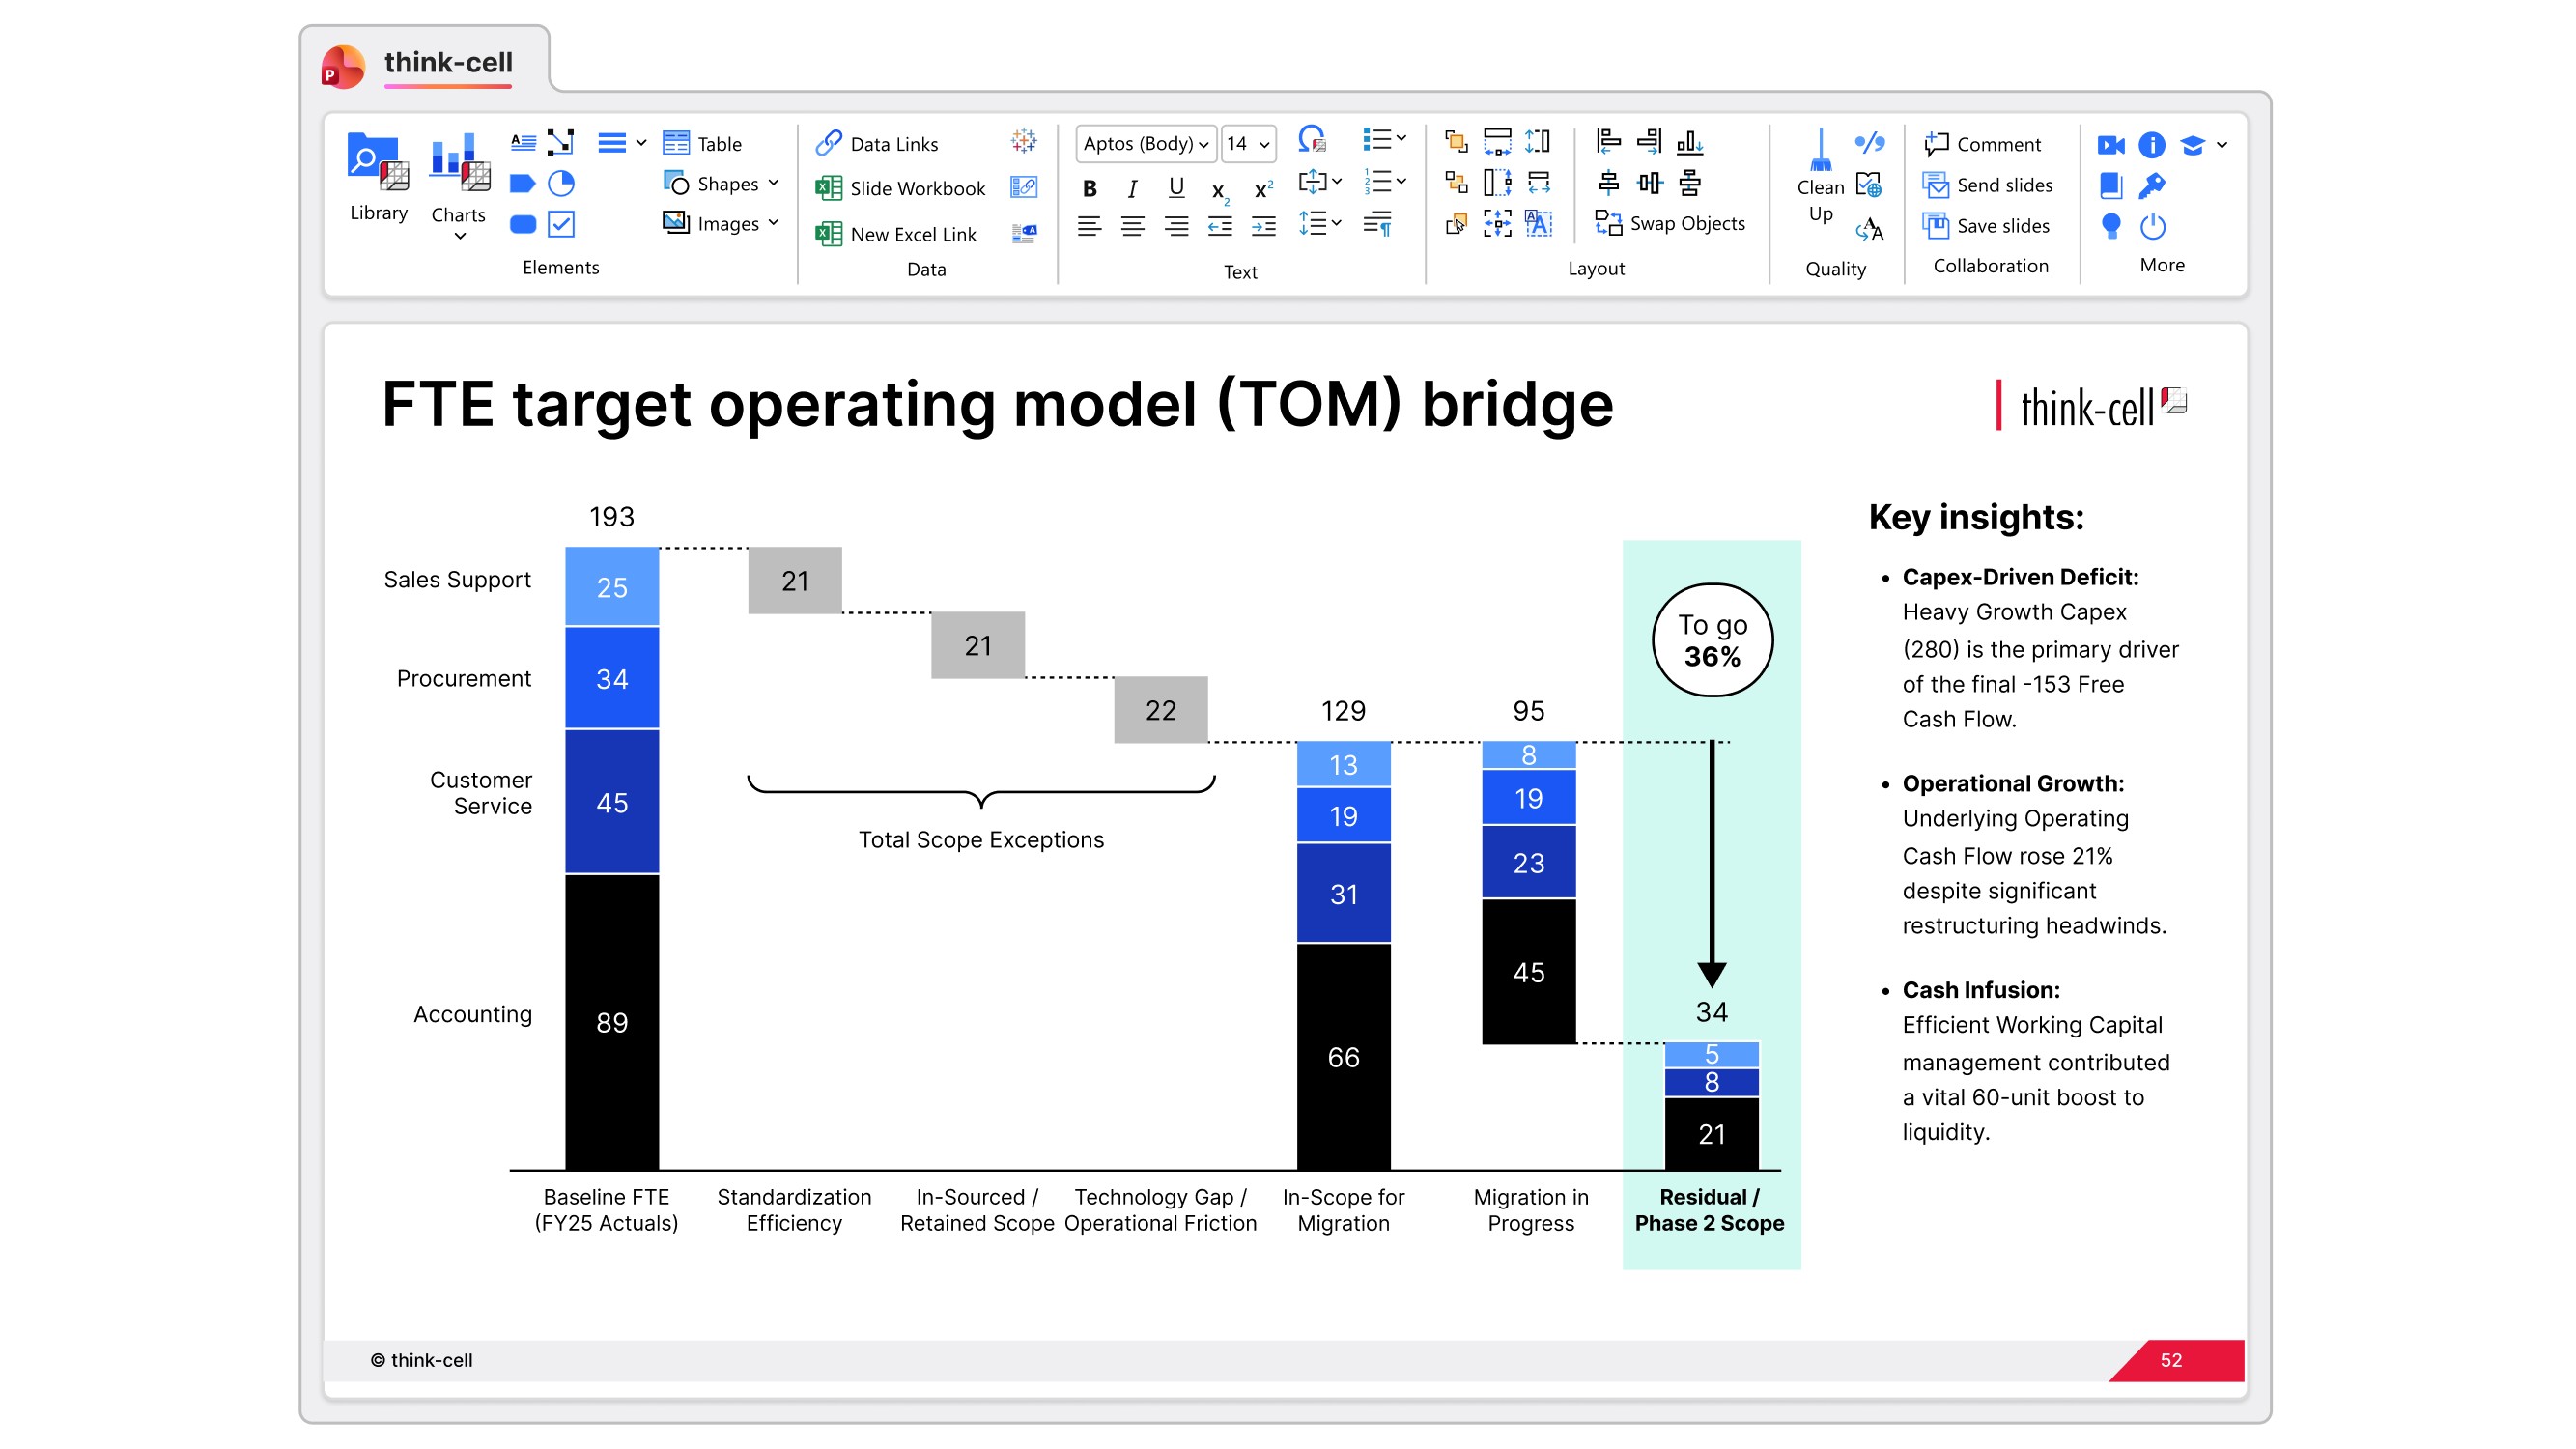
用堆叠图拆解成本结构。添加可自动计算的差值箭头,数据更新后自动重新定位。
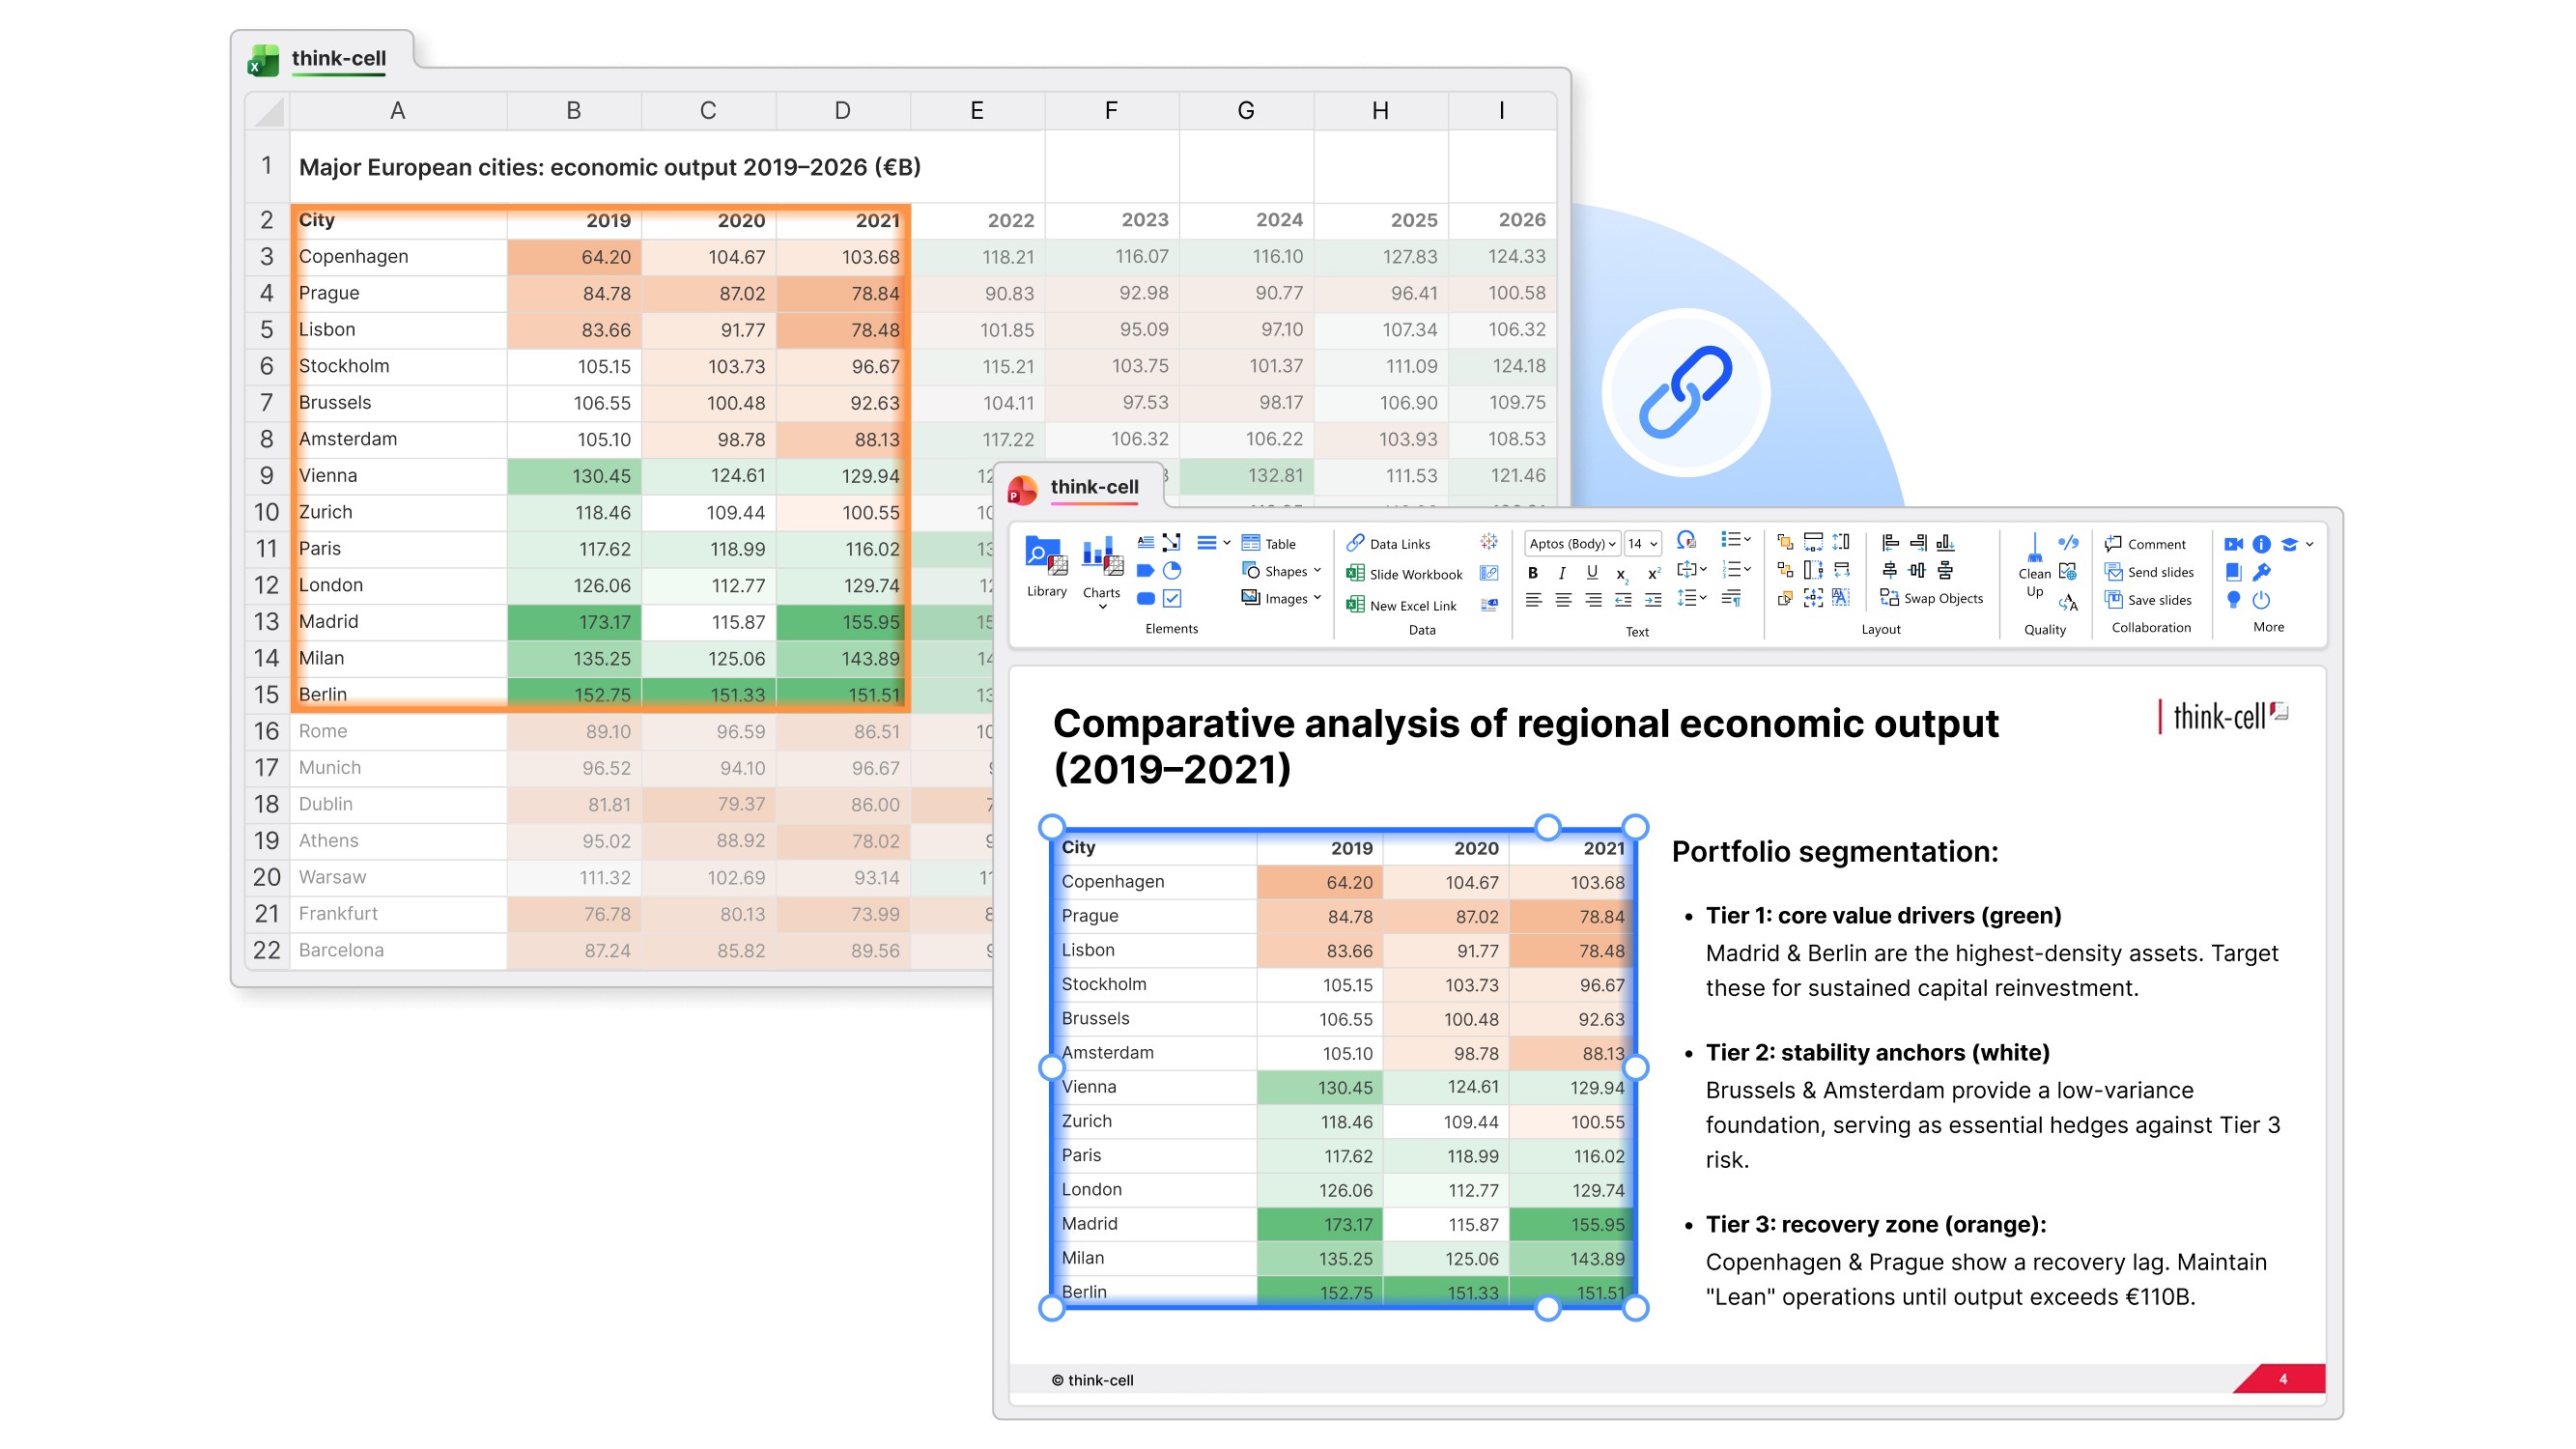
将Excel表格导入PowerPoint,并保留条件格式。数据刷新后,你的热力图也不会丢失。
用折线图与CAGR箭头对比不同情景;当假设变化时自动重新计算,无需手动重画。
客户怎么说

Automating chart creation and updates cuts the time spent on presentations by half, allowing the team to focus more on analysis and less on formatting.

We automate our reports by establishing links not just to chart data ranges, but to every single cell that contains a value. In this way, think-cell’s Excel links helps us generate our reports faster, while also guaranteeing 100% accuracy.

If I need 10 minutes to create a chart natively in PowerPoint, think-cell reduces this to just 3-5 minutes.


It took me 2 hours to prepare a report for a regular meeting, and I spent 25% of that time, or half an hour, on modifying the charts. With think-cell, I can do this in a few clicks, or in a few seconds. The time I save can be used for thinking about suggestions and analysis.
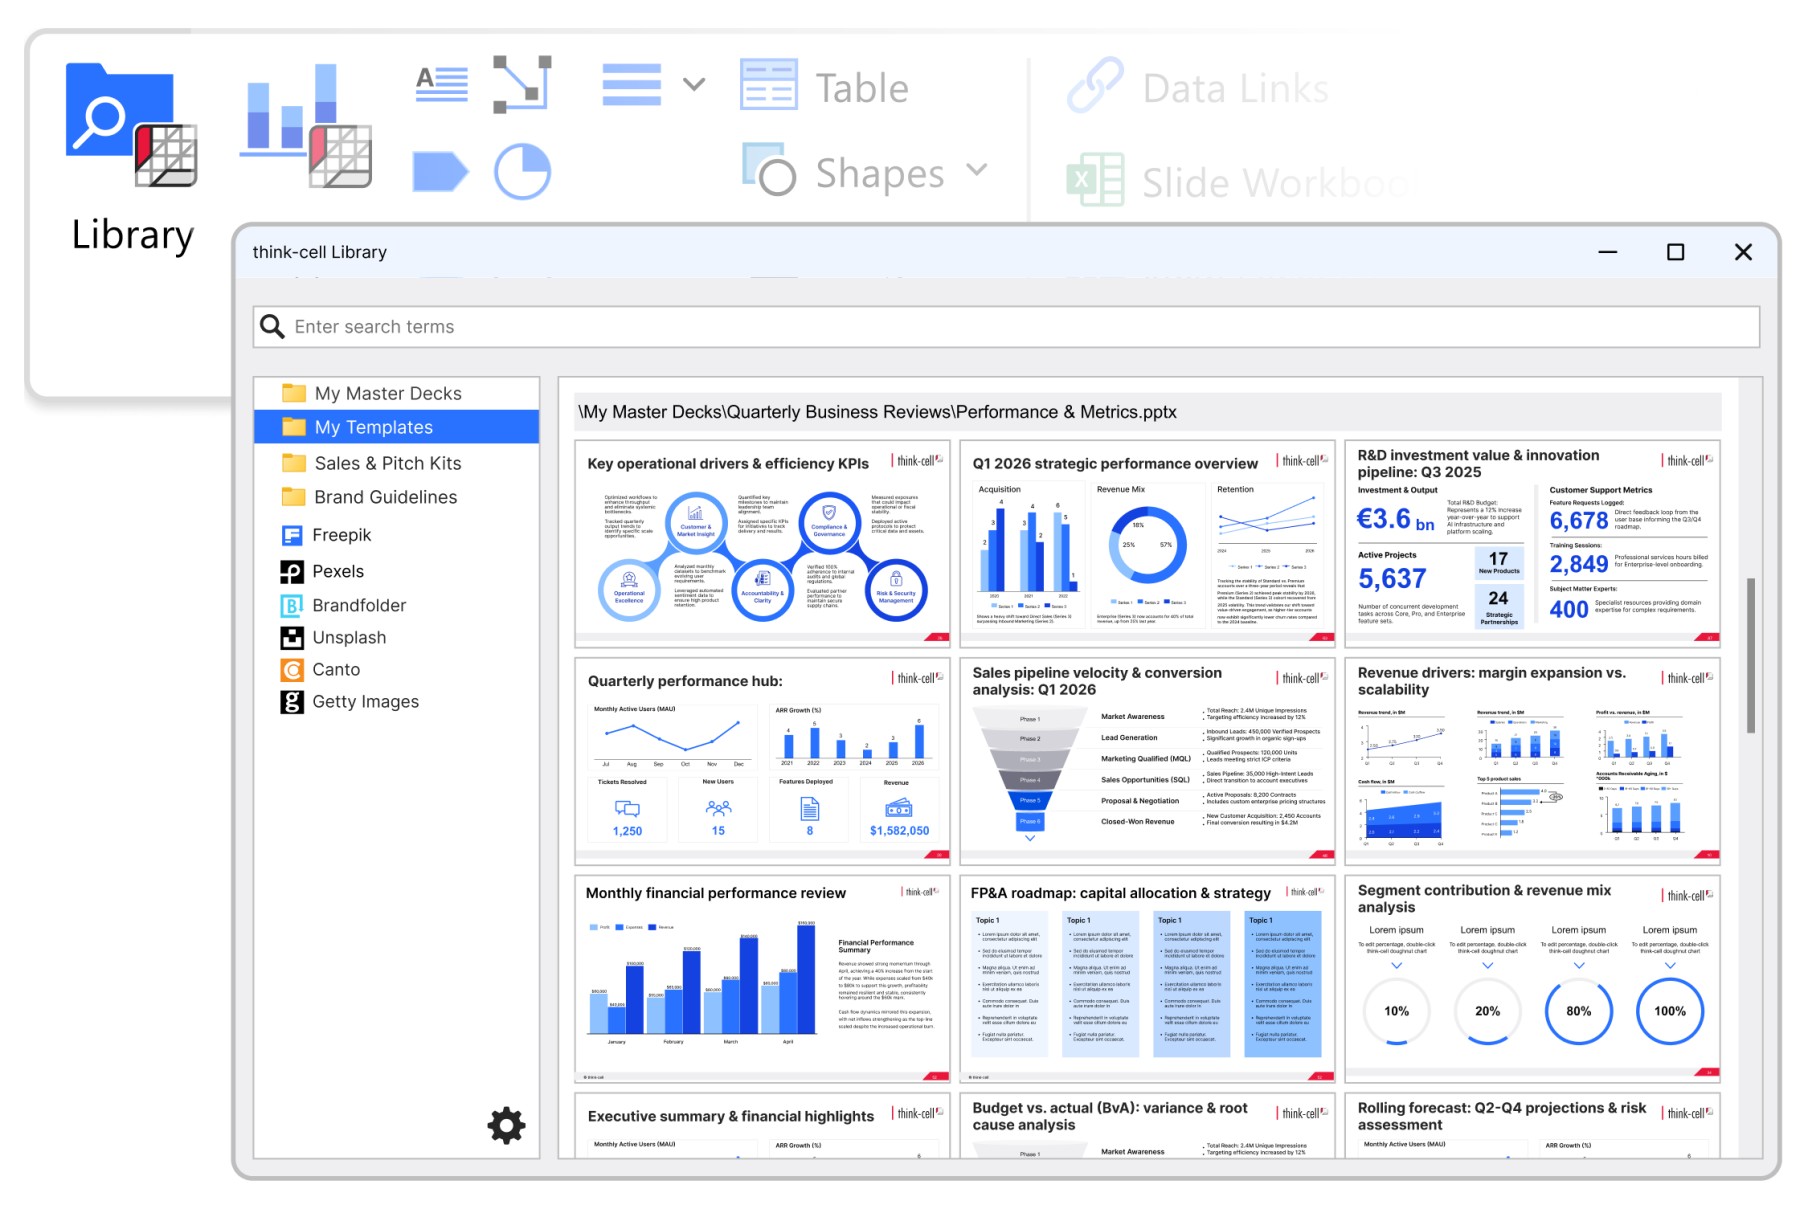
复用,而不是重做
你做过上百张幻灯片,你的团队也是如此。think-cell Library 让它们可搜索,减少重复制作已存在内容的时间。
用更少时间制作出色幻灯片
免费试用 think-cell。全面体验高级图表、幻灯片模板库和智能排版工具。无需信用卡。