KB0229: How can I create a box and whisker chart?
- Home
- Resources
- Knowledge base
- KB0229
Box and whisker charts, also called box plots, can be created using think-cell's Excel data links (see Create elements from Excel). You can download our template Excel and PowerPoint files from the following link: box_and_whisker.zip.
Simply extract the .zip file contents and follow the instructions in the Excel Workbook to add your data. The template calculates the five-number summary from your raw data and arranges it as a data source for think-cell's Excel link. The linked chart in PowerPoint will then automatically update itself to show a box and whisker chart based on your own data.
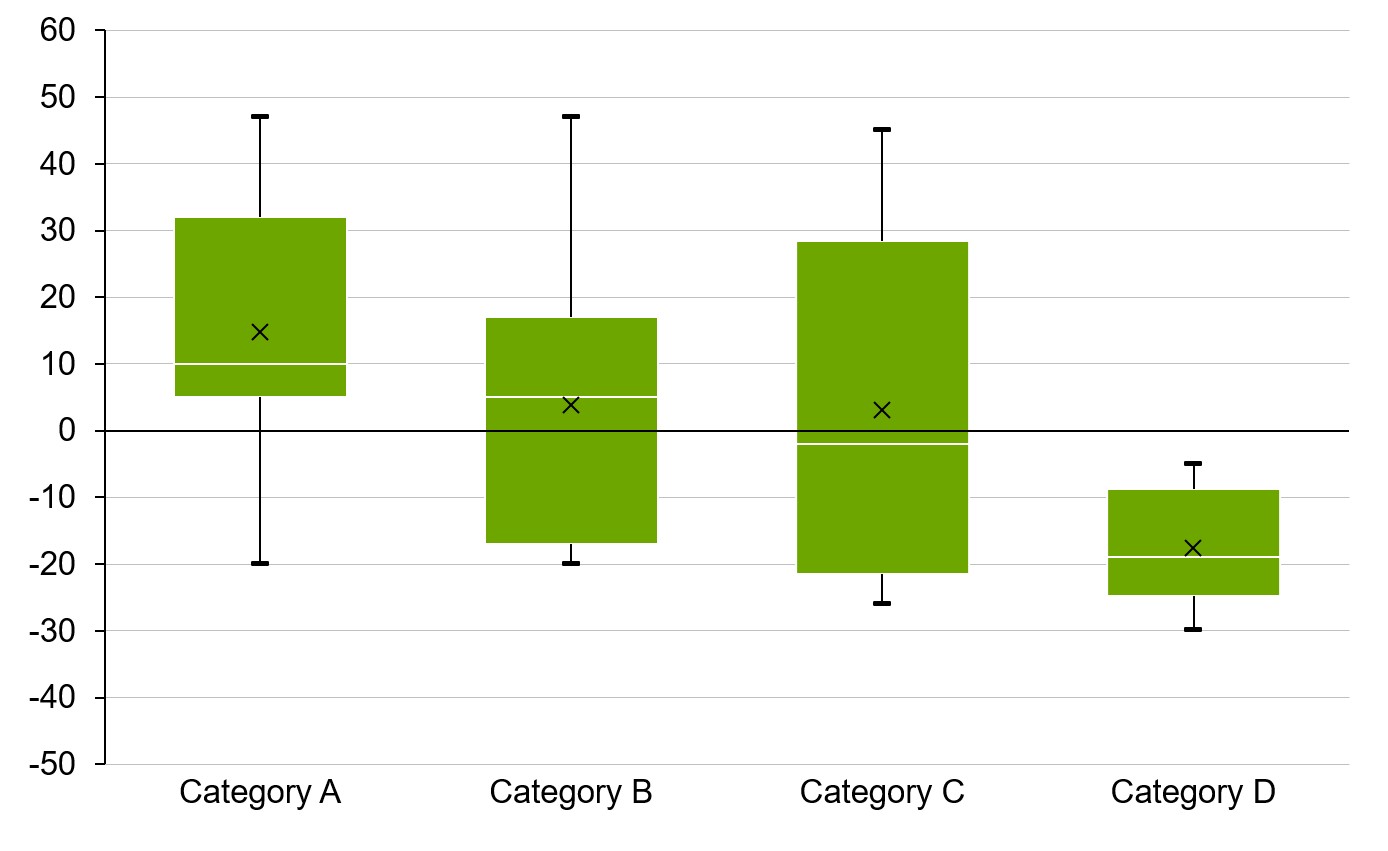
- The whiskers of the box plot are created using error bars (see Error bars) placed between the maximum and 3rd quartile values, and the minimum and 1st quartile values respectively.
- The boxes are created as stacked segments. If the boxes do not touch the baseline, a segment with no fill is used to "float" the box segments above or below the axis.
- If a box crosses the baseline, the box is split into two segments, one above the baseline and one below.
For a more detailed step-by-step guide to building a box and whisker chart, see our blog article: Create a box and whisker chart