think-cell 7 launched
Berlin, February 12, 2016
Today, think-cell launched the brand-new version 7 of our flagship presentation software for Microsoft PowerPoint. It comes with a wealth of new and improved features.
Compatibility with Microsoft Office 2016
think-cell 7 is the first version of our software that is compatible with Microsoft Office 2016. Of course, it is compatible with all current Microsoft Windows and Office versions, including 32 and 64 bit versions. It is therefore recommended to install think-cell 7 regardless of which Windows or Office version is used.
Charting features
-
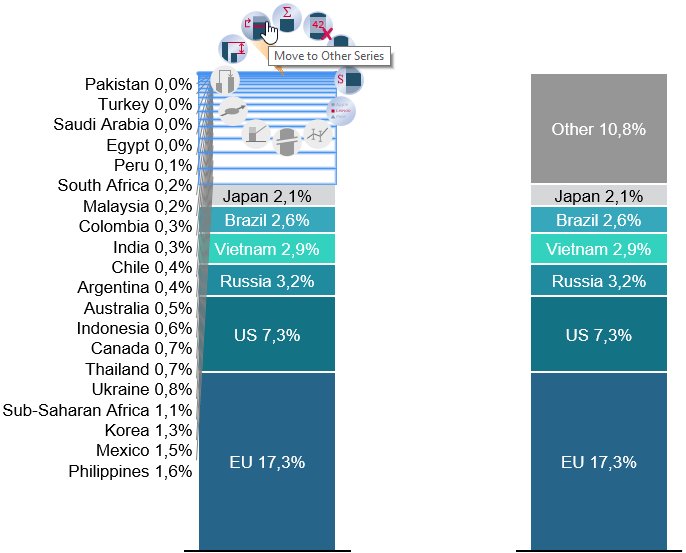
Aggregate data into a separate Other series from the segments' context menu in column, Mekko, area and combination charts. Add segments to or remove them from the Other series simply by dragging a handle. (More on this)
-
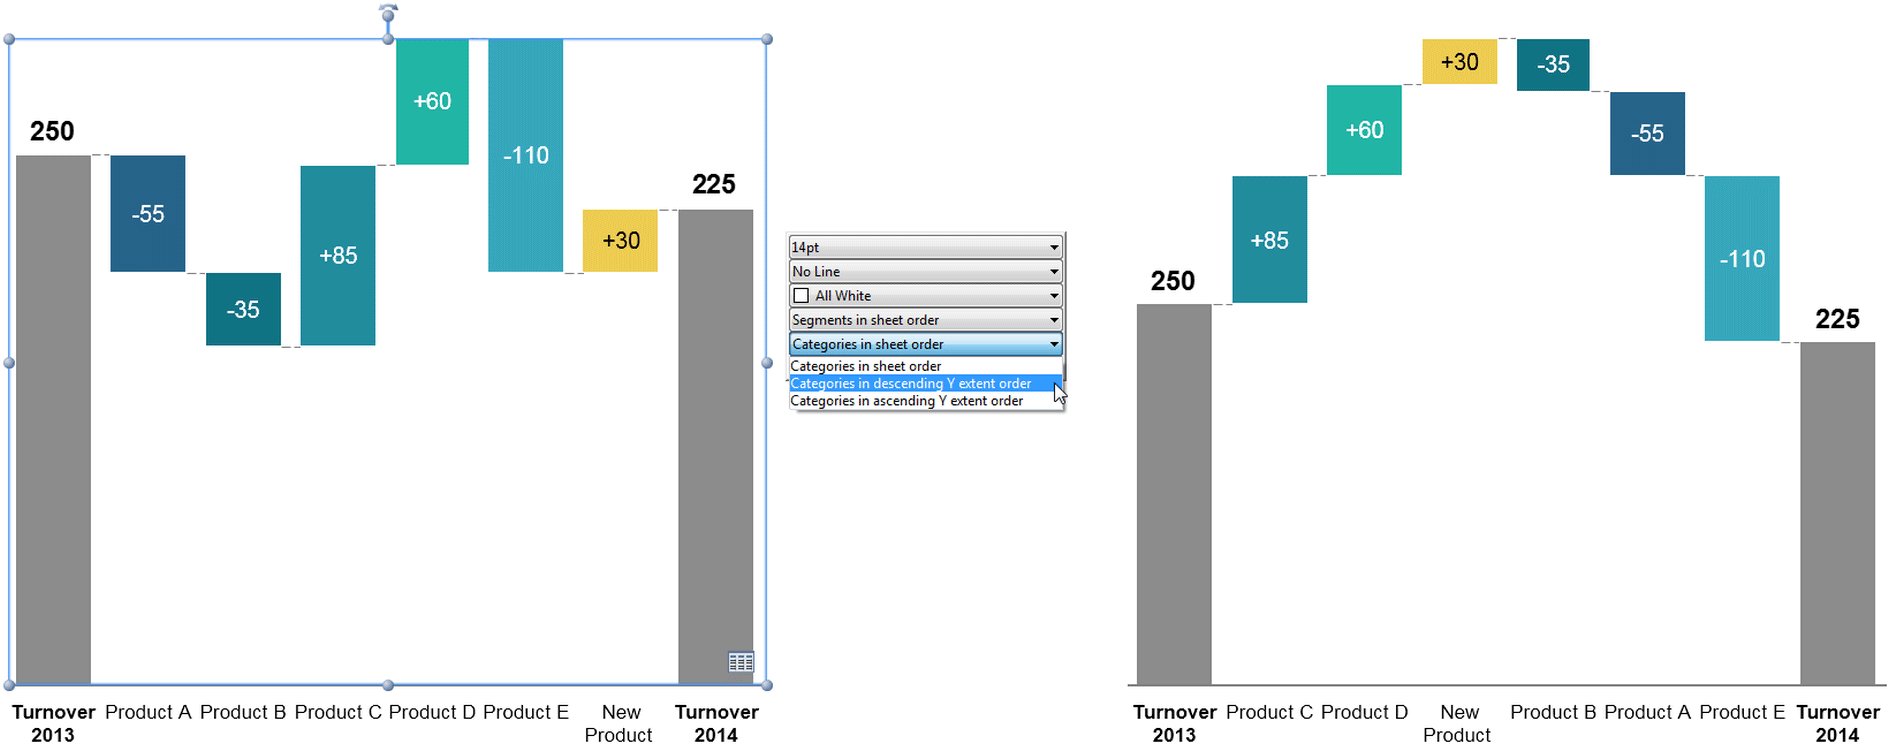
Sort categories by their total values directly from the chart's floating toolbar. (More on this)
-
Interactively resize data bubbles in bubble charts by dragging a bubble's handle. The other bubbles will be updated automatically, maintaining correct size ratios.

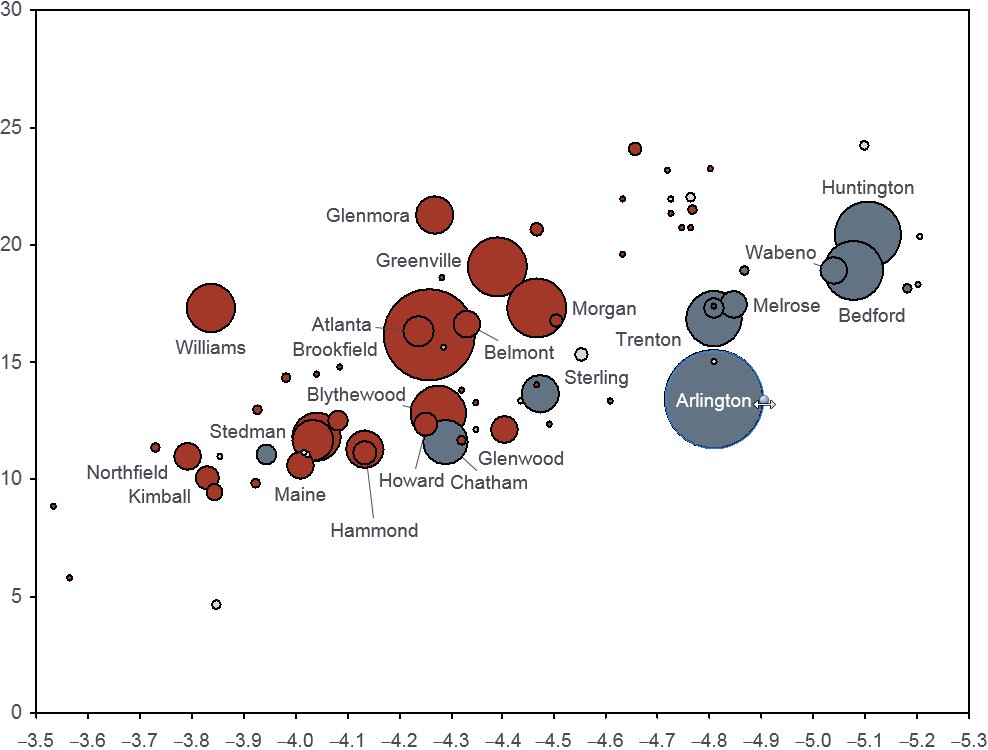
- Adjust the reference size of the bubble size legend by dragging its handle.
- Easily toggle the value axis between absolute and percent representations in stacked, 100% and area charts. (More on this)
- To move all Gantt chart date items at once, press Ctrl+A while a bar, milestone or process is selected.


Formatting and style
- Choose from the complete set of Microsoft Office design theme colors to style your think-cell charts. If needed, compatibility with Office 2003 and older versions can be ensured by a restricted color scheme offered in the chart's floating toolbar.
- Customize your charts for a consistent visual identity with new options in the think-cell style file. In version 6, you could already change defaults for segment colors and color schemes. Now, in addition, you can define your own line colors and line styles, arrow bubble fills and outlines, Harvey balls and checkboxes, which may even include pictures instead of checkmark signs. (More on this)
Label content
- Labels entered into the datasheet can now be up to 255 characters long without being truncated in the chart.
- Create clean yet unambiguous charts by showing 4-digit year numbers on specific axis labels, while keeping 2-digit years for all others. (More on this)
- In recognition of our growing Asian user community and its currency conventions, you can now find 104, 108 and 1012 in think-cell's magnitude dropdown box.
User interface improvements
- Floating toolbars now open to the right of the mouse pointer, staying out of the way of selected elements.
- Easily access cell formats from the datasheet toolbar with the new datasheet formatting button.
About think-cell
Founded in Berlin in 2002, think-cell is the de facto standard for creating professional presentations in PowerPoint. With productivity tools and support for 40+ chart types, all of the top 10 global consulting firms rely on think-cell. It is the software of choice for the DAX 40 and Fortune 500 companies and is taught at 10 of the top 10 US business schools.