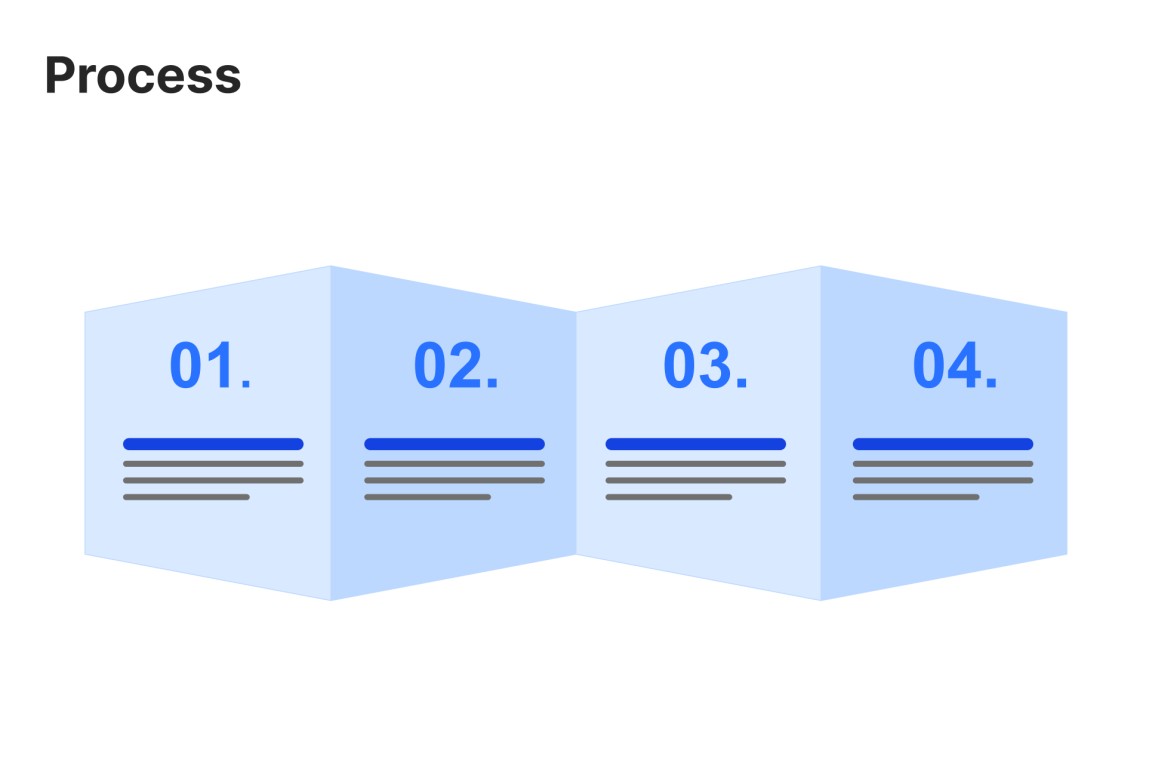
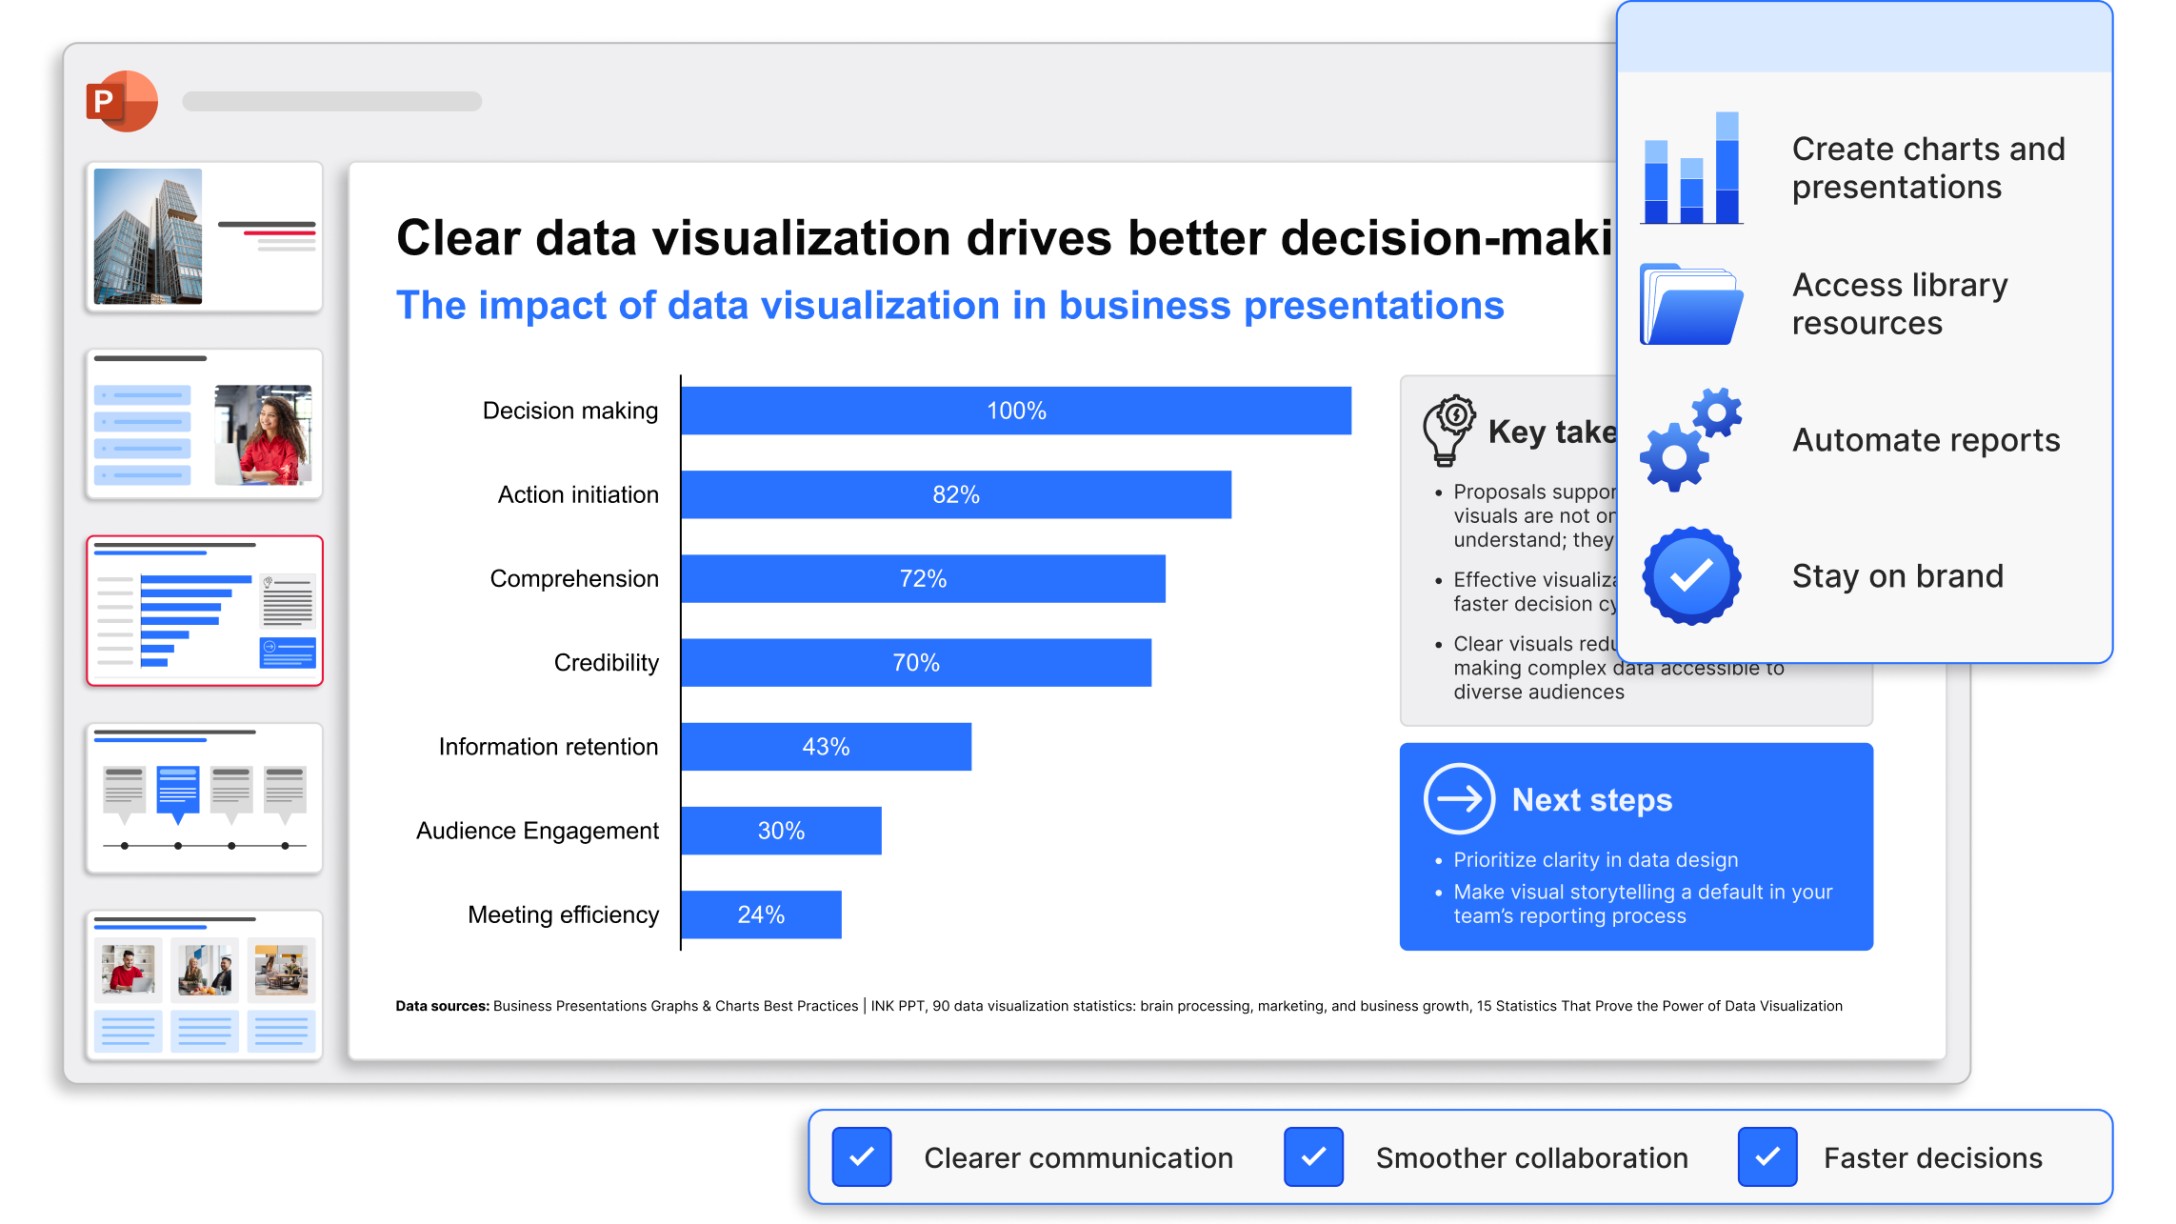
Presentations that impress

#1 PowerPoint add-in for chart creation and business presentations

Save hours on every deck with smart automations, seamless Excel linking, and 40+ pre-built charts.

Trusted by over one million professionals worldwide

0M+

end users worldwide

0+

businesses

0%

Fortune 100 companies

Everything you need in a single Suite

A single solution to boost productivity across all aspects of your PowerPoint presentations.

  • Chart functionalities and automation features help you tell your story more efficiently.
  • Templates, resources and visual assets let you work faster and stay on brand.
  • Precision tools give you control of professional slide layouts and boost collaboration.

Products tailored to your needs

think-cell Charts

Fully integrated chart creation for management-style visualizations that support convincing, data-driven storytelling.

think-cell Library

All the resources you need to start your business presentations quickly and never stare at a blank slide.

think-cell Core

A set of powerful tools you can use to build and edit professional PowerPoint slides with heightened efficiency and consistency.

World-class design baked in

Explore 250+ slide templates developed in collaboration with top management consultancies.

40+ powerful chart templates

Transform any data into real business insights with our extensive library of prebuilt charts.

Waterfall charts

Create waterfall charts to show how different drivers contribute to an overall change. Industry standard for EBITDA bridge and P&L statements.

  • Display multiple series with stacked segments.
  • Include totals and subtotals that calculate automatically.
  • Add segments that cross below the baseline.

Column and bar charts

Use column and bar charts to present your data in a clear, digestible form anyone can recognize. Easily modified to create butterfly/tornado charts.

  • Choose from stacked, clustered and 100% charts.
  • Insert axis breaks to make best use of the slide space.
  • Add category gaps to highlight distinct values like targets.

Line and area charts

Build line, area, and area 100% charts to communicate data trends over time. Versatile use as candlestick charts for stock prices or football field charts.

  • Add a secondary value axis to better compare metrics.
  • Add linear interpolation for any missing values.
  • Use error bars to show confidence intervals.

Scatter and bubble charts

Create scatter and bubble charts to show the relationship between two variables, reveal patterns in categorized data, and uncover outliers.

  • Ensure maximum readability with automated point labels.
  • Use bubble sizes and group colors to communicate more information.
  • Shade or color partitions to highlight segments in scenarios, heat maps, etc.

Pie and doughnut charts

Use pie and doughnut charts to easily visualize the proportions of each category within a 100% total. Can be easily modified to create gauge charts.

  • Break out individual slices to add emphasis
  • Add connectors to create pie of pie charts or show segment growth.
  • Use concentric doughnut charts for multi-series comparisons.

Mekko charts

Build Mekko charts to show data in two dimensions, using column width for total category sizes and height for proportions. Ideal for market shares.

  • Choose from unit axis or percentage axis.
  • Avoid manual workarounds as column widths are calculated automatically.
  • Combine smaller segments to ‘Other’ to reduce noise.

Combination charts

Create combination charts to show trends and relationships between data series, bringing column/bar and line charts together in a single visualization.

  • Set each series flexibly to be displayed as a column/bar or line.
  • Use a secondary value axis to display data or series with different scales.
  • Sort columns in descending order to create insightful Pareto charts.

think-cell in numbers

0%

think-cell users save 70% of time spent building charts in PowerPoint.

0+

think-cell includes more than 40 chart types for impactful data visualizations.

0/10

The world’s top 10 consulting firms all use think-cell.

The foundation of successful presentations

How think-cell makes anyone’s PowerPoint work better.

01

Outstanding results

Convince your audience with messages backed by industry-leading visualizations that are not only slick, but easily digestible and built for powerful communication.
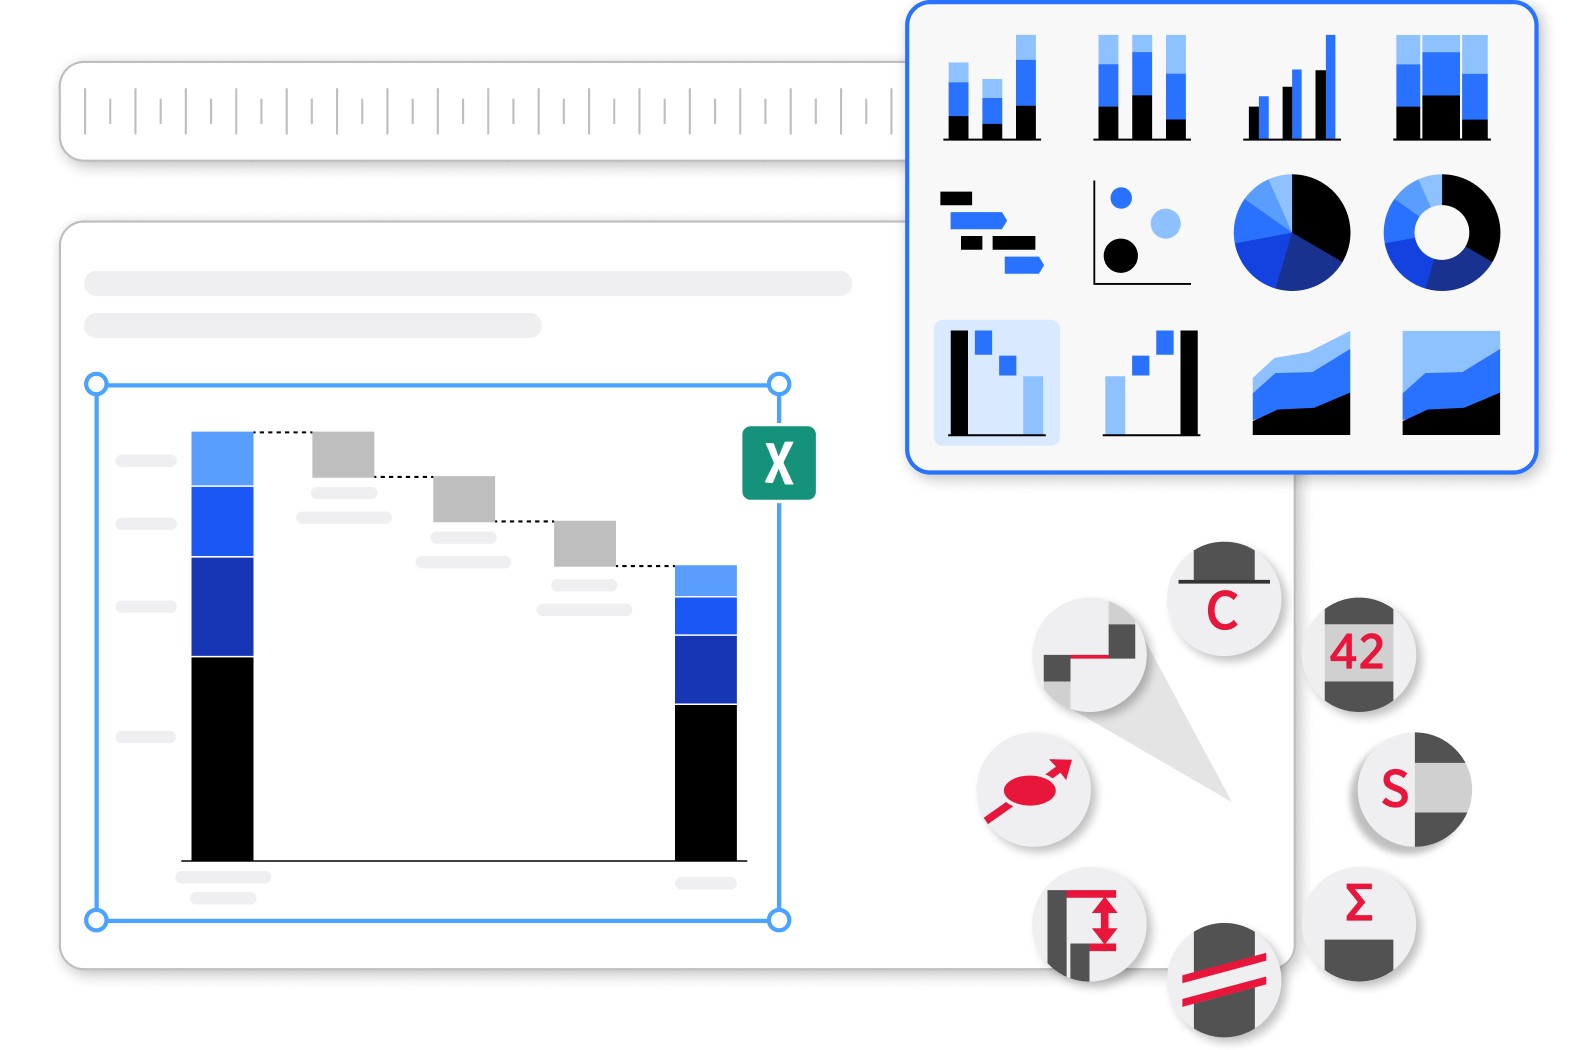
02

Error-free outputs

Build your slides with confidence, knowing that presentations are fully consistent, always accurate, and 100% compliant with your brand’s visual identity.
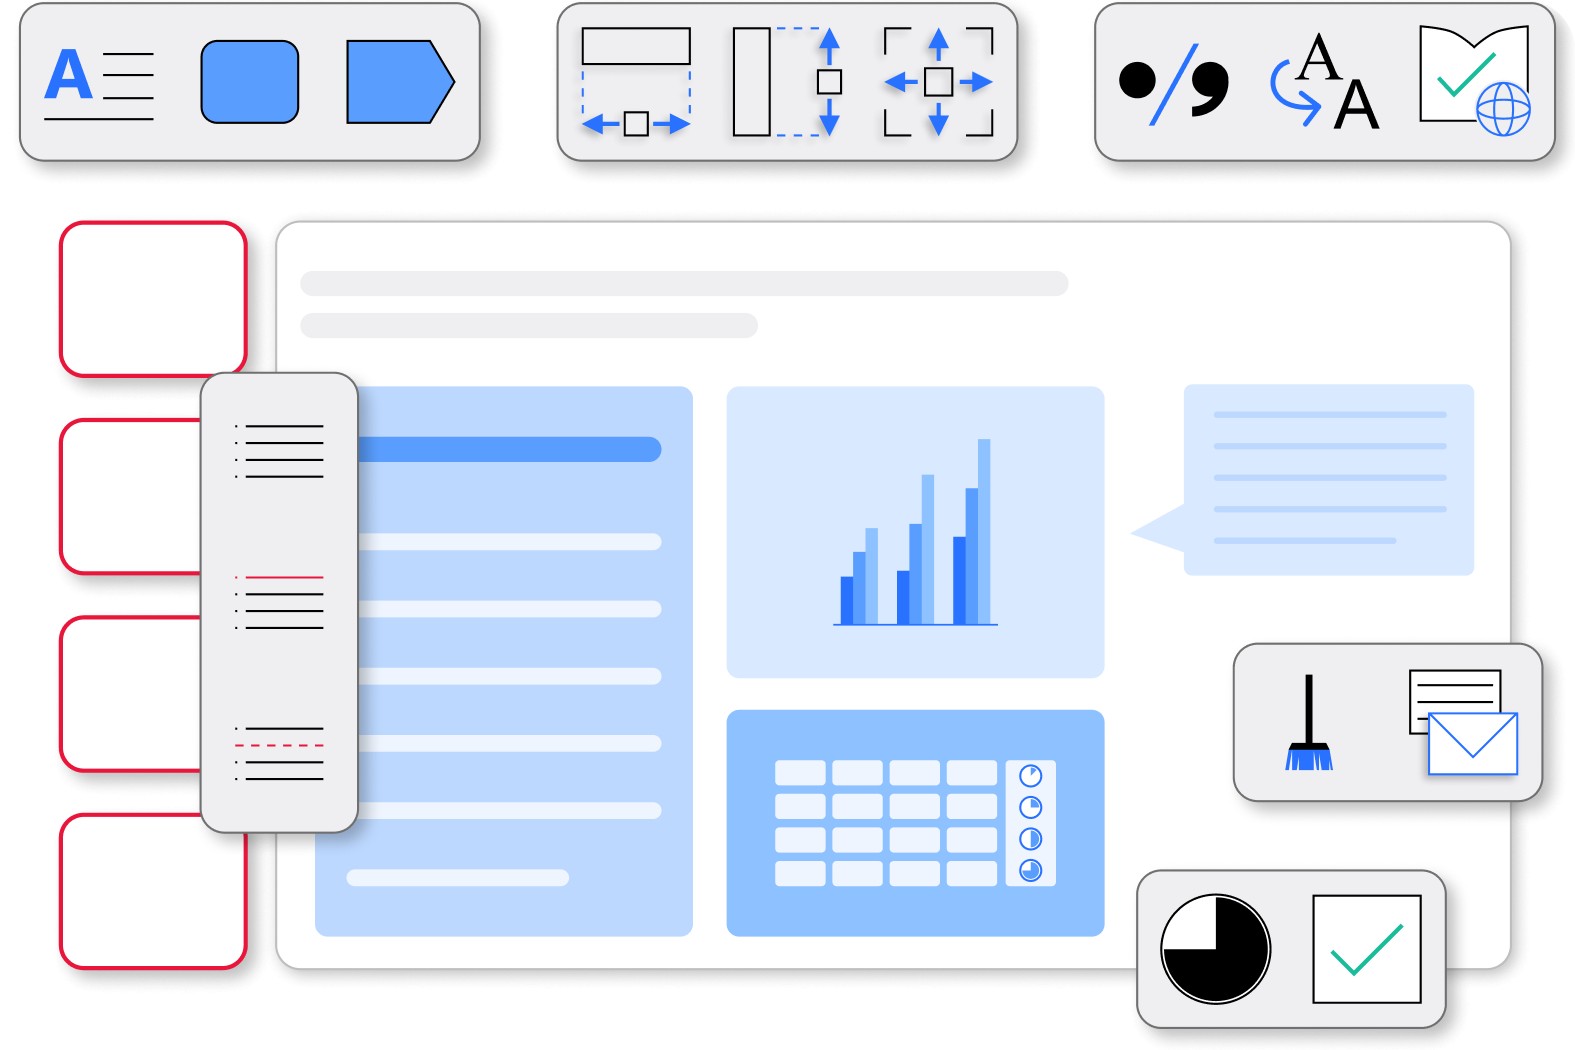
03

Increased efficiency

Enjoy automation that lets you spend less time on mundane tasks like aligning slide elements and more time creating value with your individual skills and expertise.
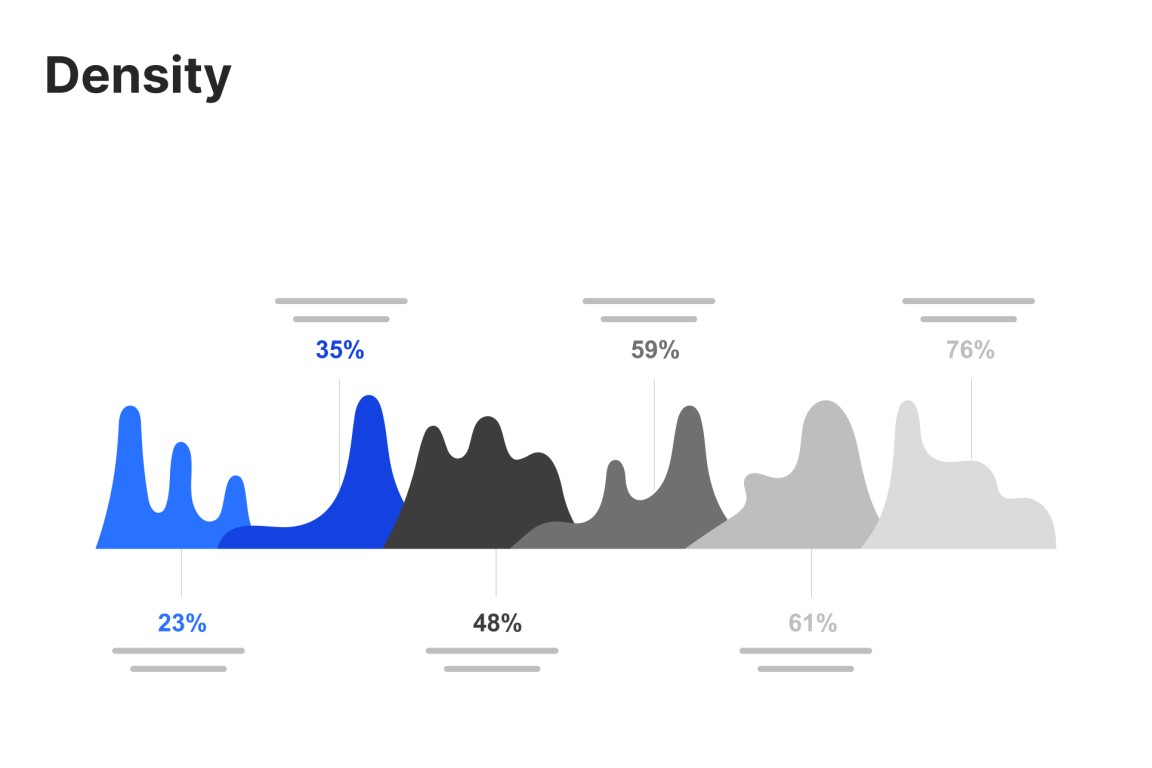
04

Ease of use

Get started quickly from the moment you open PowerPoint and make effortless progress throughout your entire presentation creation journey.

Trusted by over 30,000 companies worldwide

People know exceptional software when they see it.

With think-cell, I’m able to work almost three times faster compared to using standard PowerPoint features. It’s a massive time-saver.

Adrián Fernández Gil
Global Product Manager
Read more

I set myself high standards when it comes to the consistency and quality of how my data is presented, and think-cell is an integral part of my daily work to fulfill this goal.

Ruben Latz
Manager Finance Project and Transition of Vaillant Group Business Services

If I need 10 minutes to create a chart natively in PowerPoint, think-cell reduces this to just 3-5 minutes.

Jakkawal Permyanwanthana
Senior Manager IRPC Strategic Planning and Sustainability Office
Read more

The increased efficiency and clearer communication have allowed product owners to present data and findings better, leading to improved decision-making and business results.

Mariam Lelashvili
Head of Analytics in the Products Development Unit
Read more

If think-cell were to be described in another way, it would be “the time-creating tool.” I think think-cell is not just a convenient add-on tool for PowerPoint, but a solution that reduces the time you spend moving your hands while creating meaningful time for you to use your brain.

Tadashi Mitsutake
Deputy Manager, Japan Market Intelligence Department
Read more

Create more impactful presentations faster