What's in the package?

A wealth of features

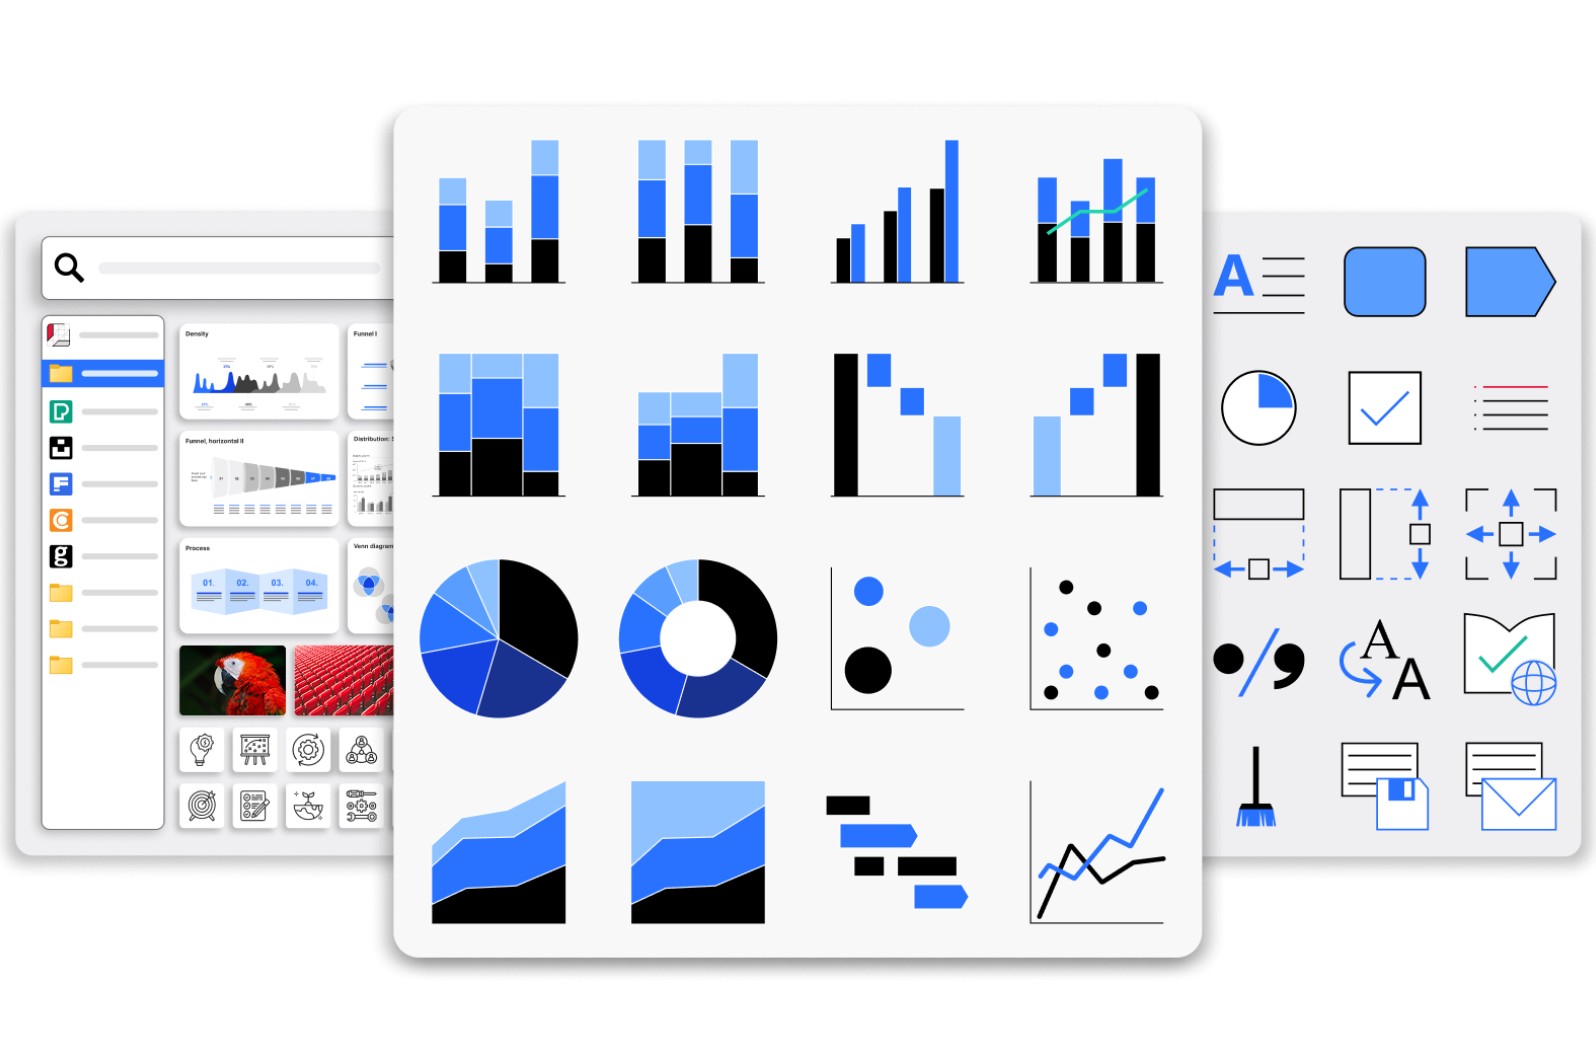
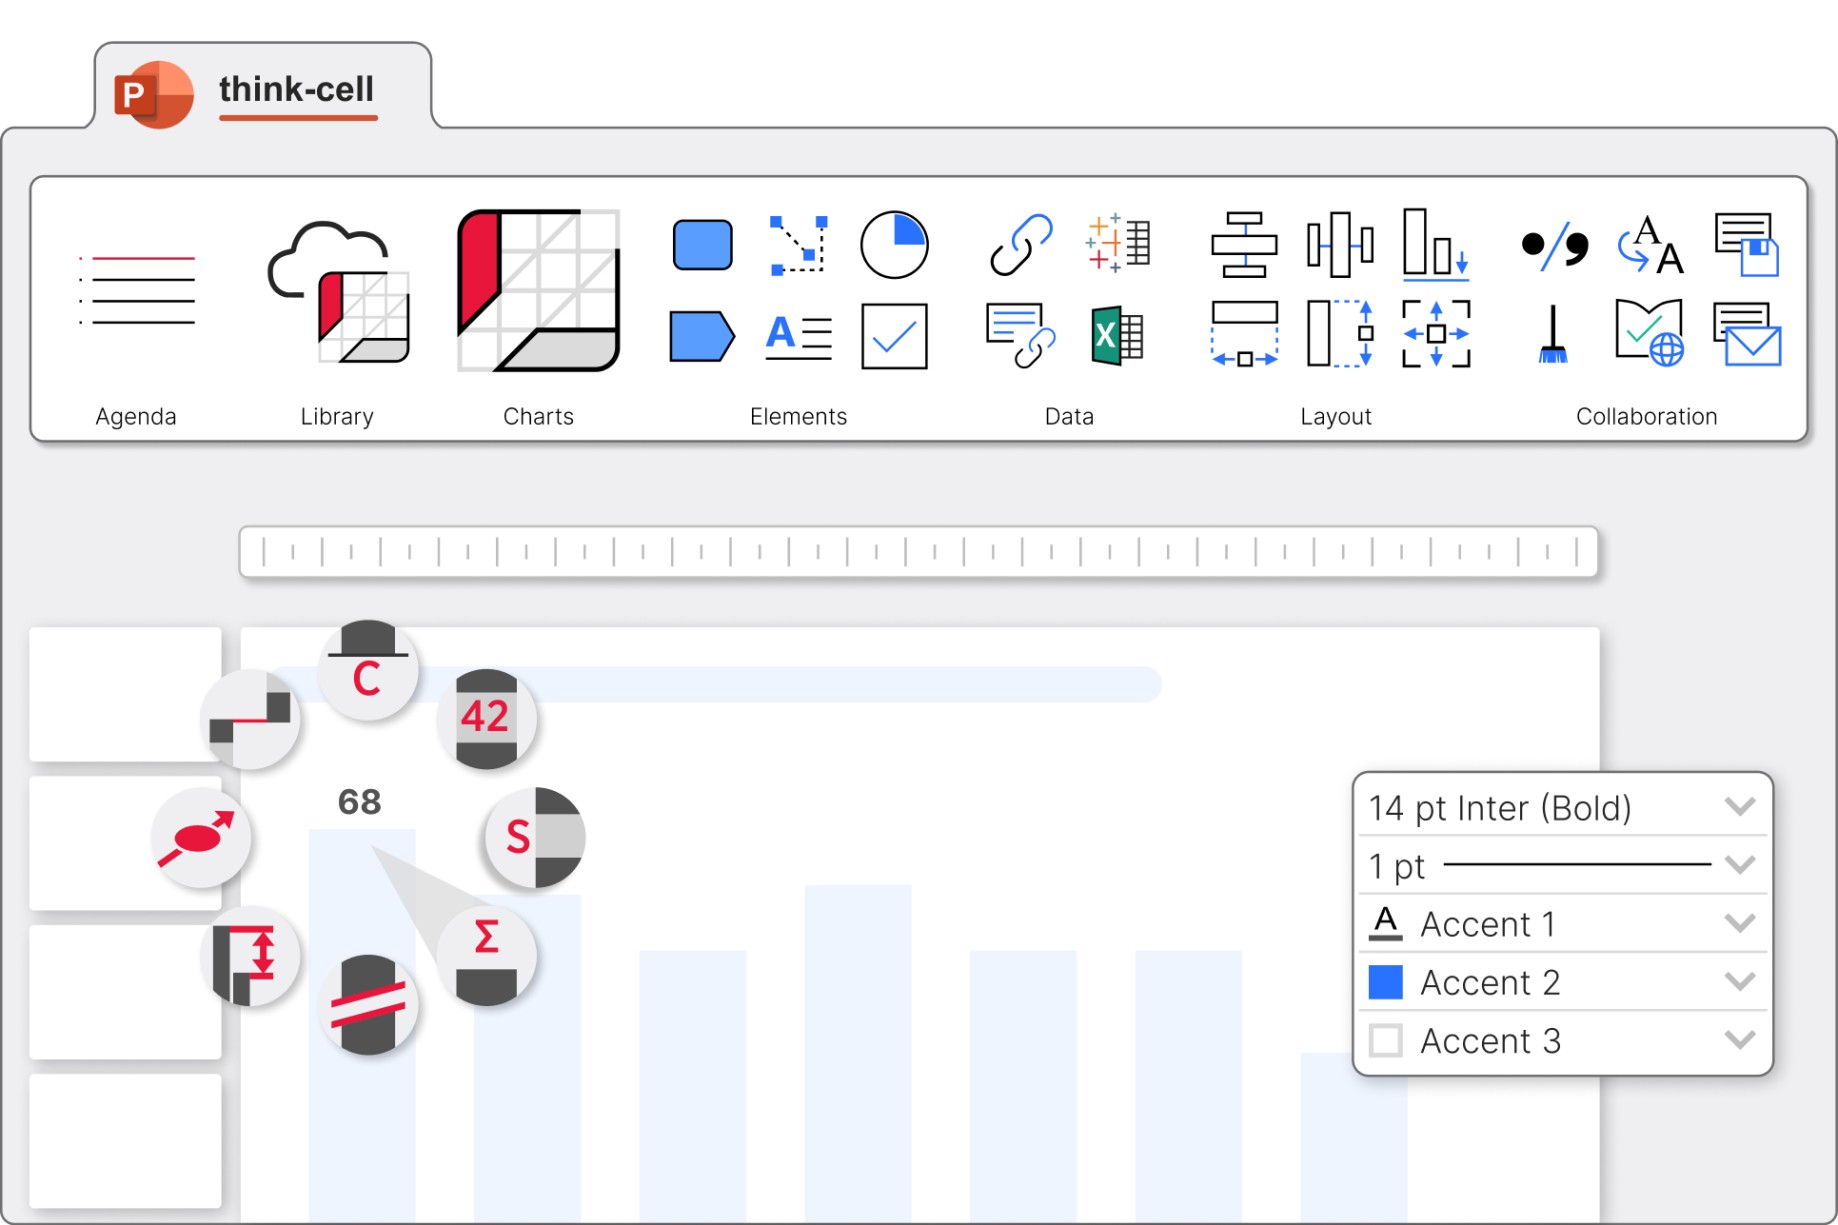
think-cell smoothly integrates into PowerPoint and brings you 40+ chart types, dozens of data-driven visual enhancements and other unique features, which you can find listed on this page.

Convinced?

Stacked column and bar chart

Stacked charts seem simple, but labeling, axes breaks and additional decorations can still take a lot of time. This video shows how think-cell helps in this regard and can therefore save you time even in case of common chart types.

  • Excel-based datasheet with formulas
  • Auto-placed segment & series labels
  • Column & bar totals
  • Percentages derived from absolute values
  • Individual series connectors
  • Two types of column & bar breaks
  • Baseline breaks
  • Baseline gaps
  • Absolute & percent difference arrows
  • CAGR arrows
  • Value lines
  • Series CAGRs
  • Automatic series & category sorting
  • "Other" series
  • Table-like layout of series legends

Waterfall chart

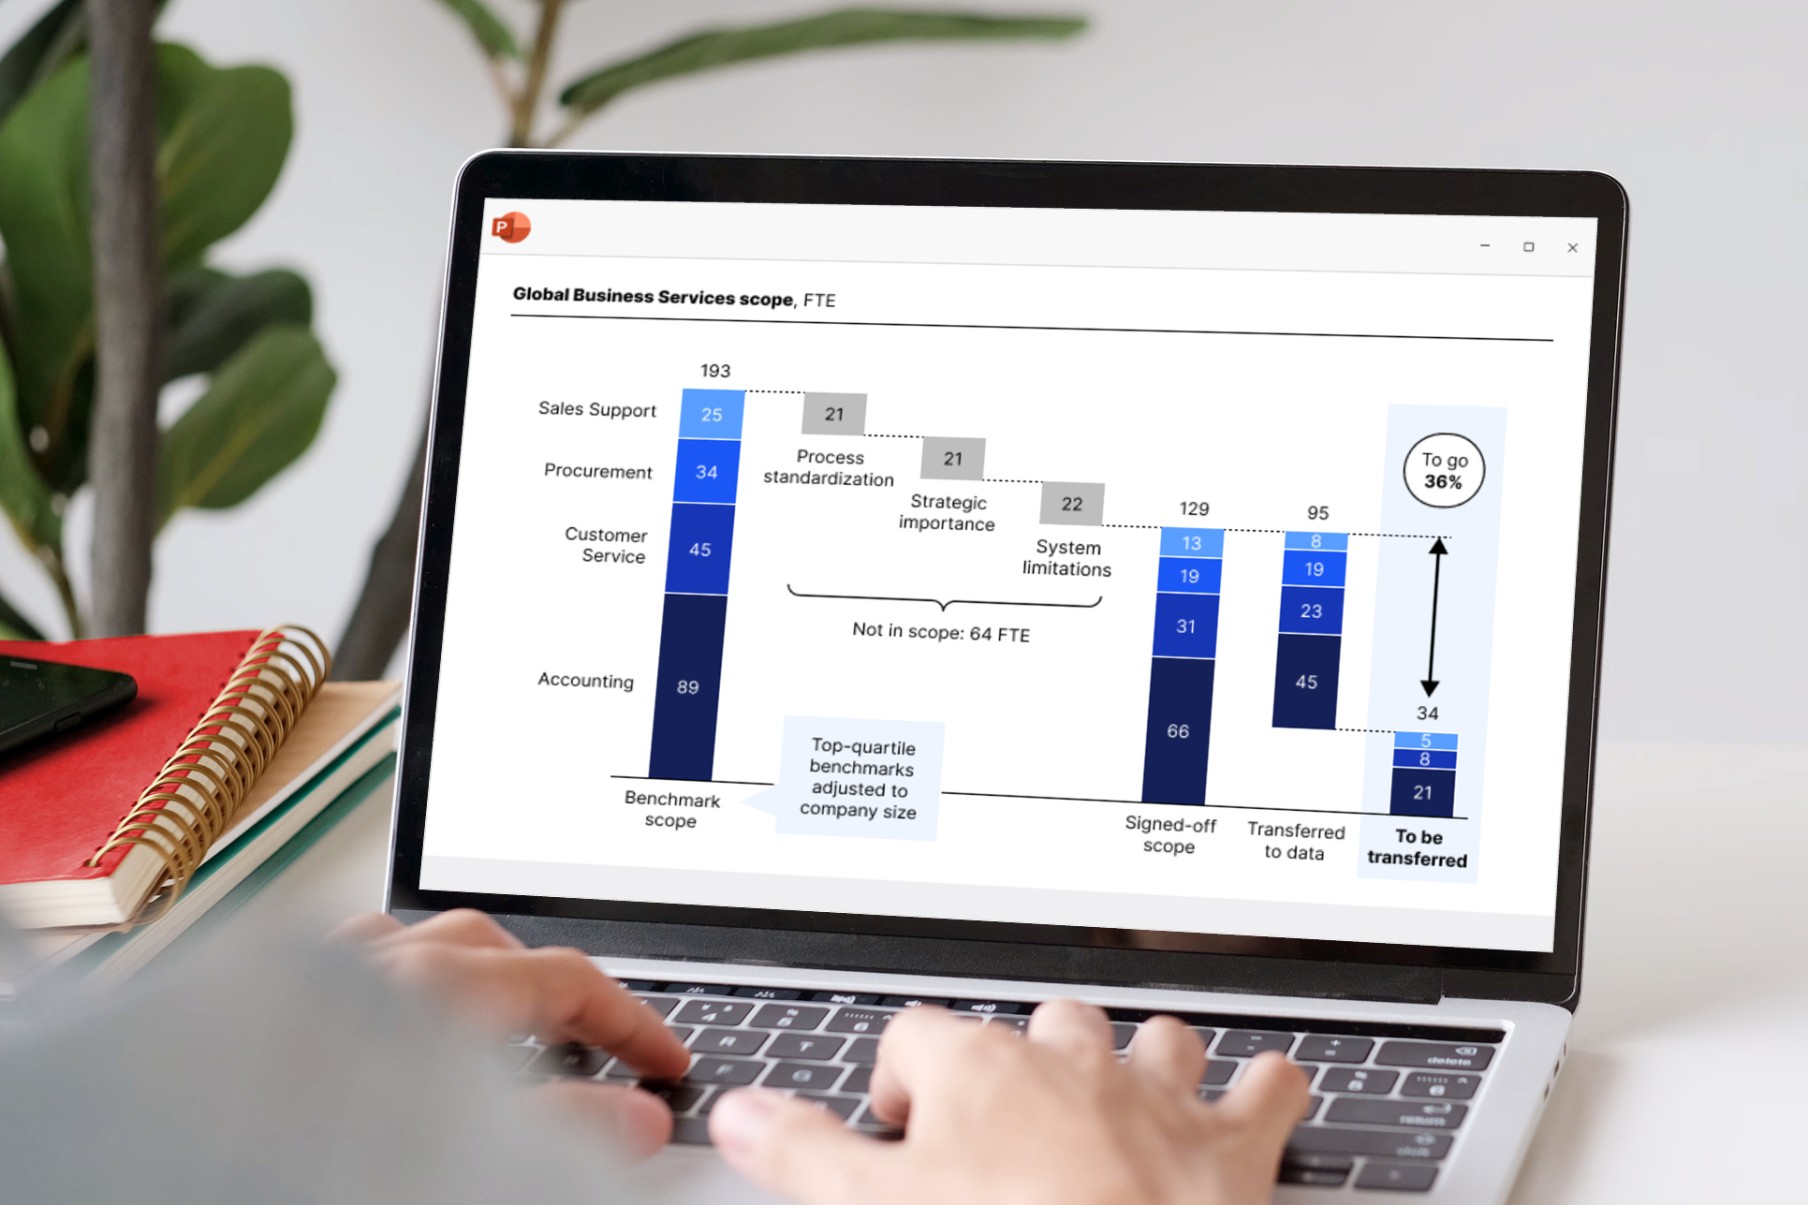
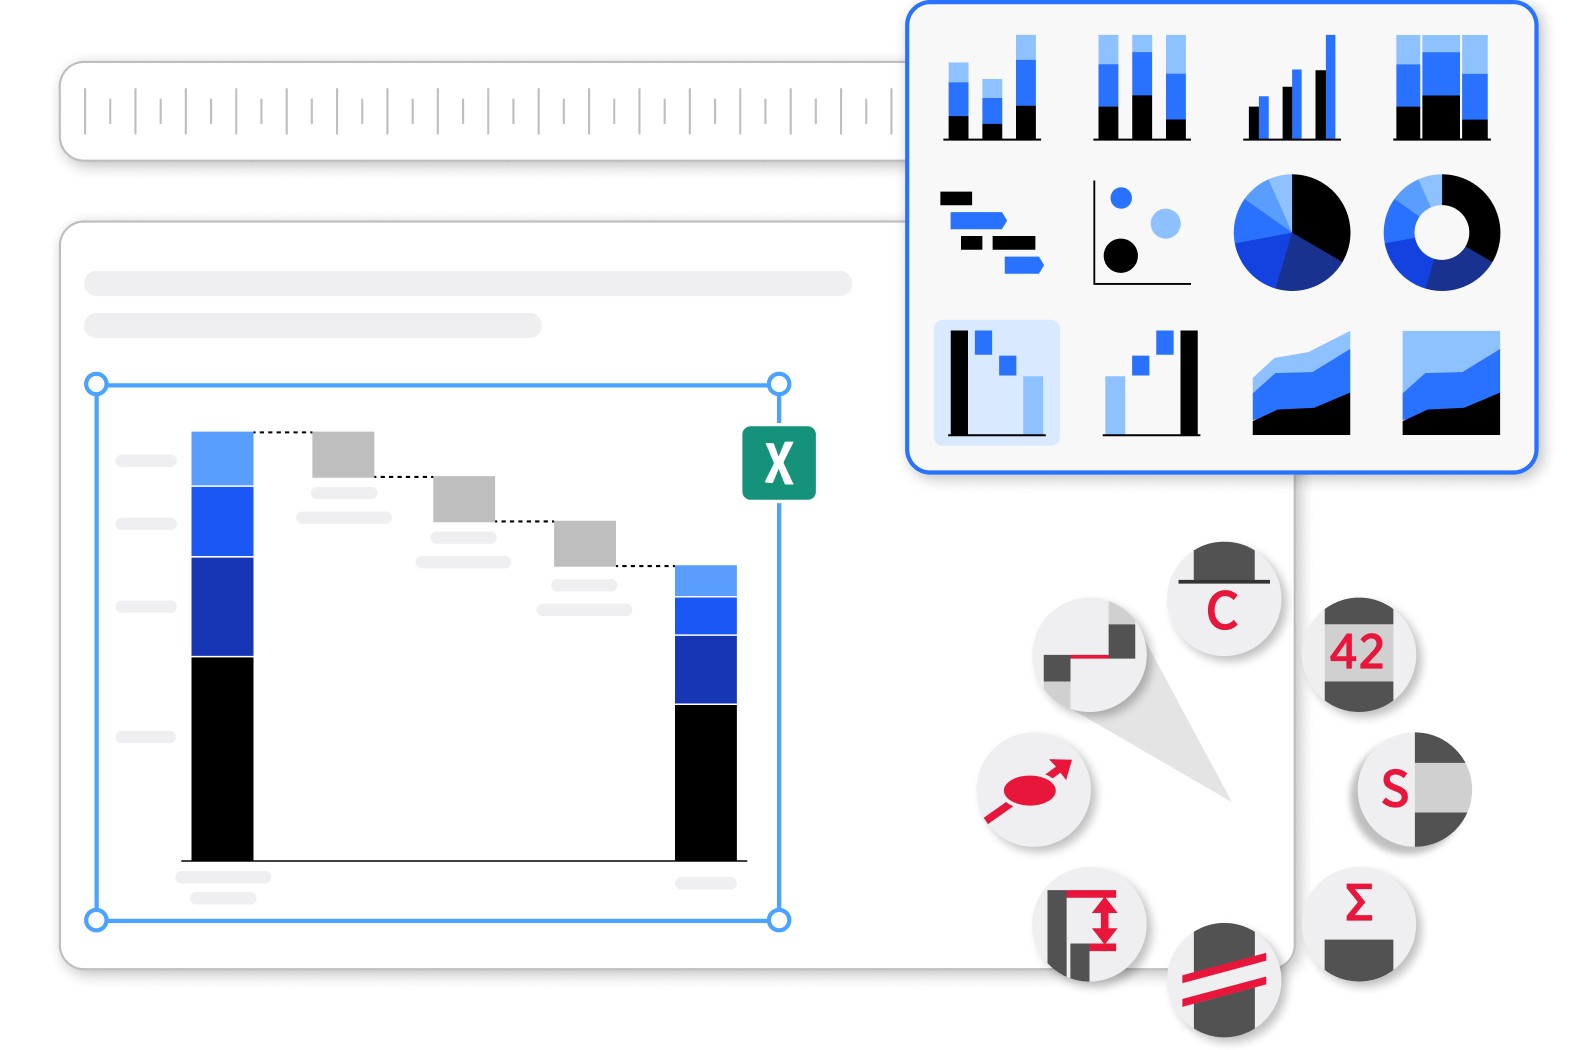
To create a waterfall chart simply enter the values to add. Positive values build up, negative values build down. "e" calculates a subtotal. For additional flexibility, you can interactively reattach the reference connector of each segment to change the order of summation.

  • Any combination of build-down & build-up
  • Column & bar waterfall chart
  • Calculation-oriented data entry
  • Arbitrary number of reference connectors
  • Segments crossing the baseline
  • Auto-placed segment labels
  • Column & bar totals
  • Percentages derived from absolute values
  • Two types of column & bar breaks
  • Absolute & percent difference arrows
  • Automatic series & category sorting
  • Table-like layout of series legends

Gantt chart

think-cell is the only software that allows you to create complex timeline charts (also known as Gantt charts) directly in PowerPoint. As seen in this video the chart is completely calendar-based and supports a variety of decorations and labels.

  • Date-oriented & interactive activity entry
  • Built-in calendar
  • Excel interface for automation
  • 5-day or 7-day work weeks
  • Self-adjusting time scale
  • Auto-placed activity & bar labels
  • Columns for remark & responsibility labels
  • Labels spanning several activity rows
  • Fit time scale to data function
  • Different types of milestones
  • Time span brackets & shades
  • Activity row shades

Mekko chart

A Mekko chart (also known as Marimekko chart) is a two-dimensional 100% chart, in which the width of a column is proportional to the total of the column's values. Data input is similar to a 100% chart, with data represented as either absolute values or percentages of a given total.

  • Column & bar marimekko chart
  • Calculation-oriented data entry
  • Ridge
  • Auto-placed segment & series labels
  • Column & bar totals
  • Percentages derived from absolute values
  • Column & bar breaks
  • Value lines
  • Series CAGRs
  • Automatic series & category sorting
  • "Other" series
  • Table-like layout of series legends

Scatter and bubble chart

With think-cell you can forget about labeling scatter and bubble charts by hand. This is done automatically – even with two independent labels per scatter point or bubble. This video shows how to create a scatter chart within seconds and how to turn it into a bubble chart by adding Z-values.

  • Auto-placed point & bubble labels
  • Easy point & bubble grouping
  • Axes breaks
  • Automatic Z order to avoid hiding bubbles
  • Trend lines
  • Partition lines & areas
  • Interactive bubble resizing
  • Bubble size legend

Pie and doughnut chart

This video demonstrates the automatic labeling capabilities of pie charts. You can rotate and explode pie segments by simply dragging their handles to anchor points at 0, 90, 180 or 270 degrees. You can also create break-out charts with the help of universal connectors.

  • Auto-placed segment & series labels
  • Interactive rotation & explosion
  • Adjustable hole size
  • Universal connectors for break-out charts

Line chart

This video demonstrates some of the line chart's advanced options such as a secondary value axis, interpolation, error bars and date-based axis formatting. And of course, you can combine line series with segment series to create combination charts.

  • Various line & marker schemes
  • Date-based axis
  • Secondary value axis
  • Smoothed lines
  • Error bars
  • Interpolation
  • Combination with column chart
  • Excel-based datasheet with formulas
  • Percentages derived from absolute values
  • Line breaks
  • Absolute & percent difference arrows
  • Series CAGRs
  • Automatic series & category sorting
  • Table-like layout of series legends

Butterfly chart

You can flip most charts to combine them. This video illustrates how two charts can be adjusted to the same scale automatically. It also shows that all labels have the same functionality as PowerPoint textboxes.

  • Same scale for chart groups
  • Excel-based datasheet with formulas
  • Auto-placed segment & series labels
  • Column & bar totals
  • Percentages derived from absolute values
  • Individual series connectors
  • Two types of column & bar breaks
  • Baseline breaks
  • Baseline gaps
  • Absolute & percent difference arrows
  • CAGR arrows
  • Value lines
  • Series CAGRs
  • Automatic series & category sorting
  • "Other" series
  • Table-like layout of series legends

Clustered chart

Clustered charts in think-cell feature the same advanced options as stacked column and bar charts. This video shows how arrows can be added that are calculated automatically and emphasize important relationships.

  • Excel-based datasheet with formulas
  • Auto-placed segment & series labels
  • Percentages derived from absolute values
  • Two types of column & bar breaks
  • Baseline breaks
  • Baseline gaps
  • Absolute & percent difference arrows
  • CAGR arrows
  • Value lines
  • Series CAGRs
  • Automatic series & category sorting
  • Table-like layout of series legends

100% chart

The think-cell datasheet is a full-featured Excel sheet. You can input either absolute values or percentages. To quickly mark elements of the same type, you can use our intelligent logical selection mechanism.

  • Columns & bars with more or less than 100%
  • Excel-based datasheet with formulas
  • Auto-placed segment & series labels
  • Column & bar totals
  • Absolute values derived from percentages
  • Individual series connectors
  • Two types of column & bar breaks
  • Baseline breaks
  • Baseline gaps
  • Absolute & percent difference arrows
  • Percent indicator
  • Value lines
  • Series CAGRs
  • Automatic series & category sorting
  • "Other" series
  • Table-like layout of series legends

Area chart

This video illustrates the basics and some advanced features of think-cell's area chart, such as the date-based category axis, the customization of value axis tickmarks, axis range, gridlines and bordered plot area.

  • Various line & marker schemes
  • Date-based axis
  • Interpolation
  • Excel-based datasheet with formulas
  • Percentages derived from absolute values
  • Area breaks
  • Series CAGRs
  • Automatic series & category sorting
  • Table-like layout of series legends

Area 100% chart

This video demonstrates how think-cell increases the effectiveness of your work when working on area 100% charts. Just as in column 100% charts, you can freely decide whether to enter percentages or absolute values.

  • Various line & marker schemes
  • Date-based axis
  • Interpolation
  • Excel-based datasheet with formulas
  • Absolute values derived from percentages
  • Area breaks
  • Series CAGRs
  • Automatic series & category sorting
  • Table-like layout of series legends

Smart text boxes

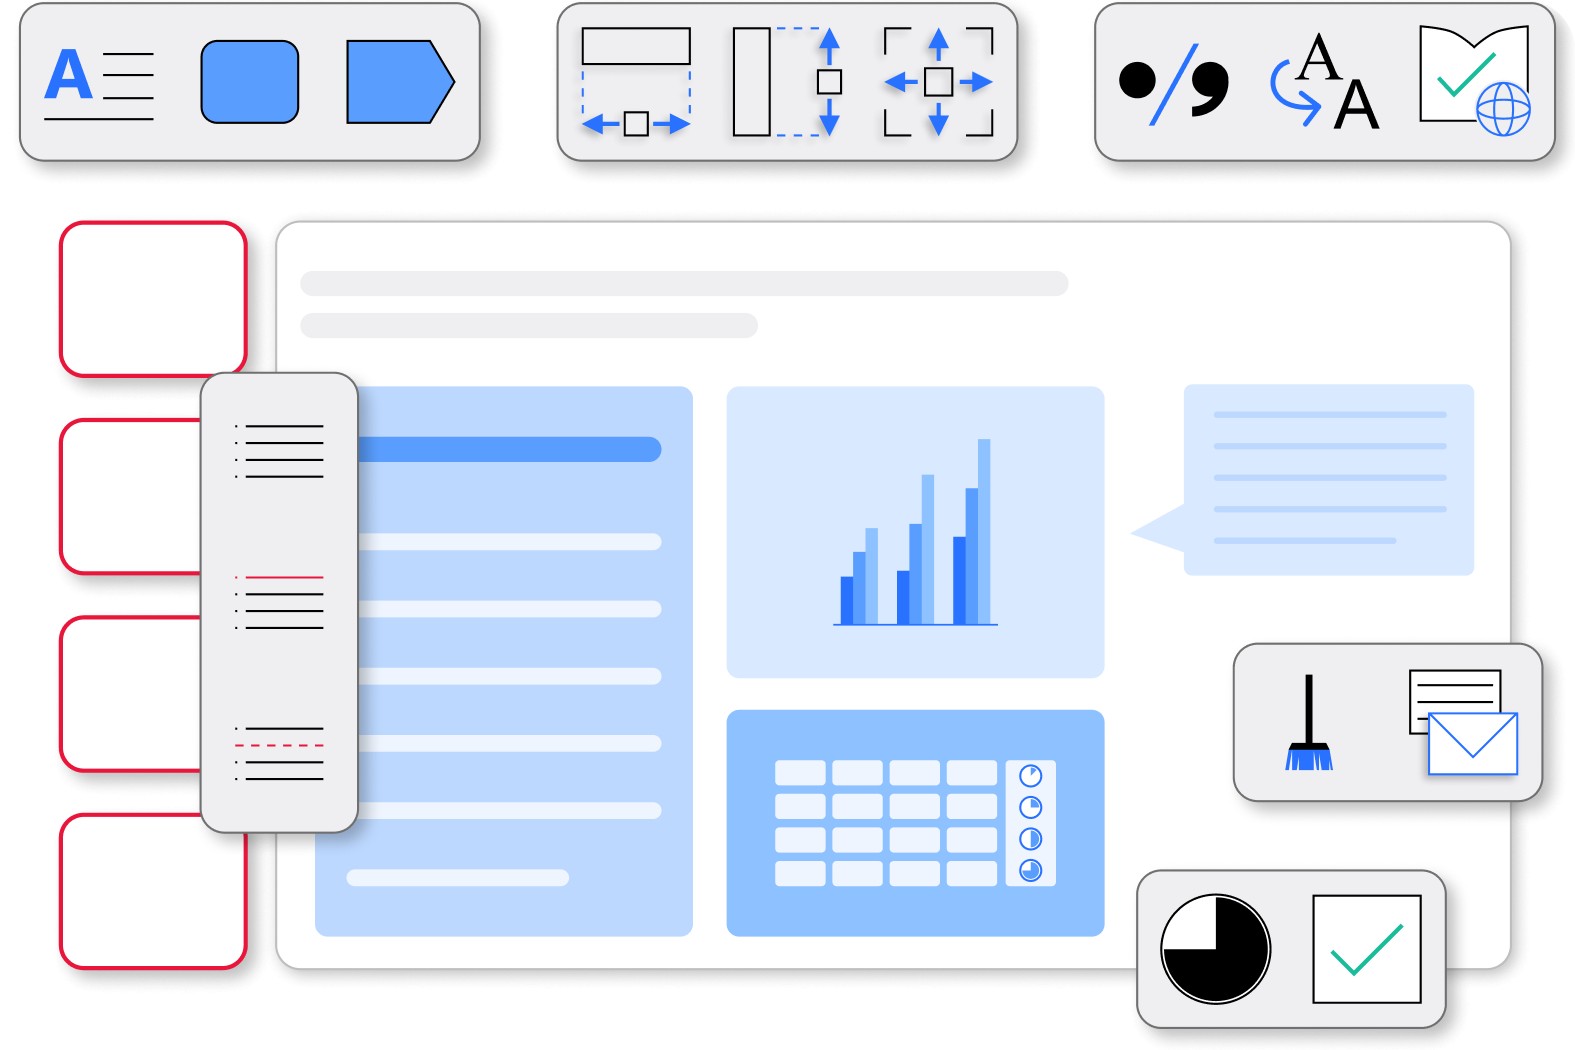
Using think-cell, you can quickly build up complex slides from text boxes. The big difference when using think-cell is that these text boxes not only snap to each other, but stay with each other, no matter what position or size they have to adopt to make their content fit. Such, the complete layout magically adjusts automatically to your text boxes and their content and creates a well-balanced slide.

Process flow

When building a process flow in think-cell you are not going to use a monolithic, inflexible "tool". You simply insert basic elements, such as pentagons, chevrons and text boxes, onto the slide and combine them to create more complex layouts.

Agenda

With think-cell, creating and maintaining a complete agenda in PowerPoint is as simple as a table of contents in a good word processor. Simply add chapter slides to your deck, type in the chapter titles and think-cell will take care of the rest. Not only when you change titles, but also when you reorder your slides in the slide sorter, the agenda will be automatically updated. In slide show mode, the table of contents as well as every chapter slide can be used for non-linear slide navigation by a simple mouse click.

Powerful presentation tools

think-cell comes with a sizeable set of additional tools to increase your productivity, some of which are shown in the video below.

  • Quick access to common special characters
  • Save and send selected slides
  • Change proofing language for all text on slide
  • Font replacement and resizing
  • Automatic case code
  • Ink removal

Excel data extraction from chart images

With think-cell you can extract numerical data and category labels from any column and bar chart image. It not only recognizes simple column and bar charts, but also stacked ones.

You can start the extraction process either from think-cell's internal datasheet or directly from Excel. Move the transparent extraction window over your chart image, hit import and the chart's data and labels will appear in your Excel sheet.

Excel data rounding

When data is compiled for a report or PowerPoint presentation, rounding summations in Excel is a frequent problem. It is often desirable but difficult to achieve that rounded totals match the total of the rounded addends. The video below shows how think-cell solves this problem by offering a set of new Excel functions that are available from a dedicated ribbon group. With a single click on think-cell's flexible rounding function you can do much better than standard Excel formatting and Excel rounding.

The following video shows that think-cell can also solve very complex rounding problems. If necessary, the rounding decisions can be controlled on a cell-by-cell basis. In addition, you can select any set of cells to which rounding should be applied, even with links to other Excel sheets.

  • Corporate design (CD) based on style files
  • CD font, color & number format schemes
  • Co-authoring support for Sharepoint
  • One-click manipulation
  • Logical lasso to quickly select similar elements
  • All labels with full PowerPoint functionality
  • Multi-language interface

Works with

Windows

Windows 11
Windows 10 32/64
Windows 8.1 32/64
Windows 8 32/64
Windows 7 32/64

Office 365 Fully Installed
Office 365 Click-to-Run
Office 2021 32/64
Office 2019 32/64
Office 2016 32/64
Office 2013 32/64
Office 2010 32/64

Mac

macOS High Sierra (10.13)
and later

Office 365 Fully Installed
Office 2021 for Mac
Office 2019 for Mac
Office 2016 for Mac

Convinced?

Try for free Order now

Share