Turn your Statista data into PowerPoint charts in just 2 minutes

Try think-cell
the PowerPoint add-in that

  • helps you create complex charts with dozens of visual annotations
  • saves you 70% working time
  • fully integrates into PowerPoint
  • is used by 89 of the Fortune 100
30 days. All features. No credit card needed.

think-cell is the #1 charting add-in for PowerPoint

Just follow this simple process to turn your Statista data
into compelling PowerPoint charts

Export your Statista data to Excel

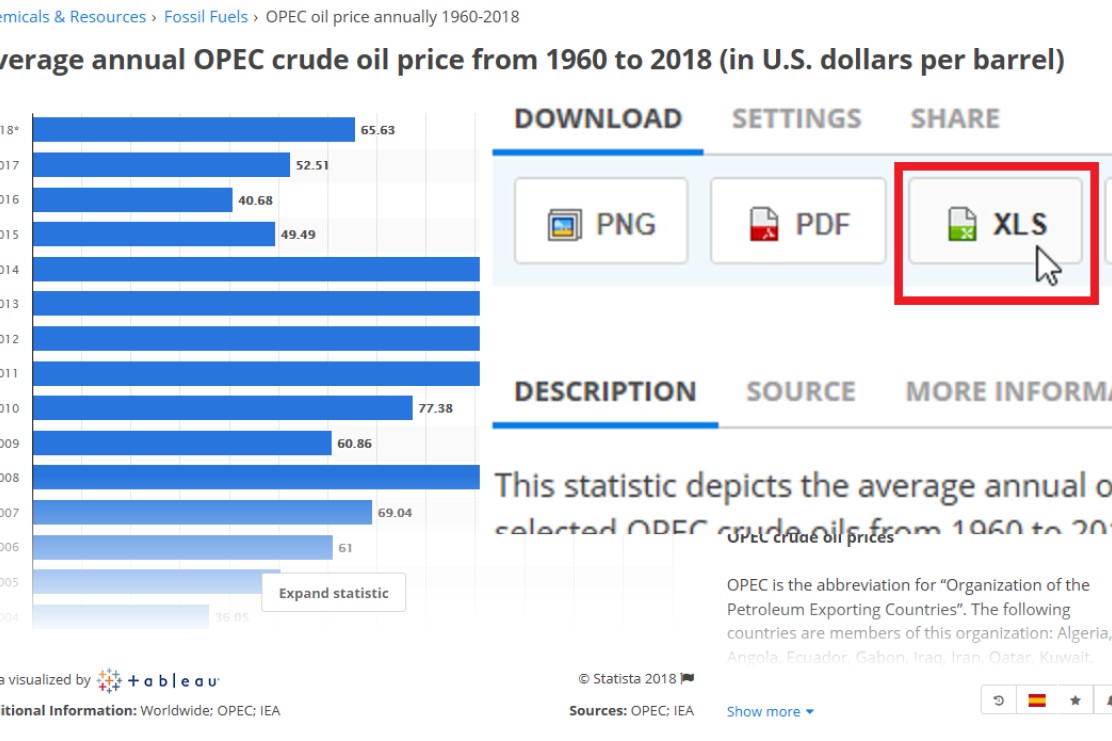
On the Statista web site you can find a button to the right of each chart. You can use this button to export the chart's data to Excel (XLS) and download a corresponding file.

Format your Excel data to match think-cell's data format

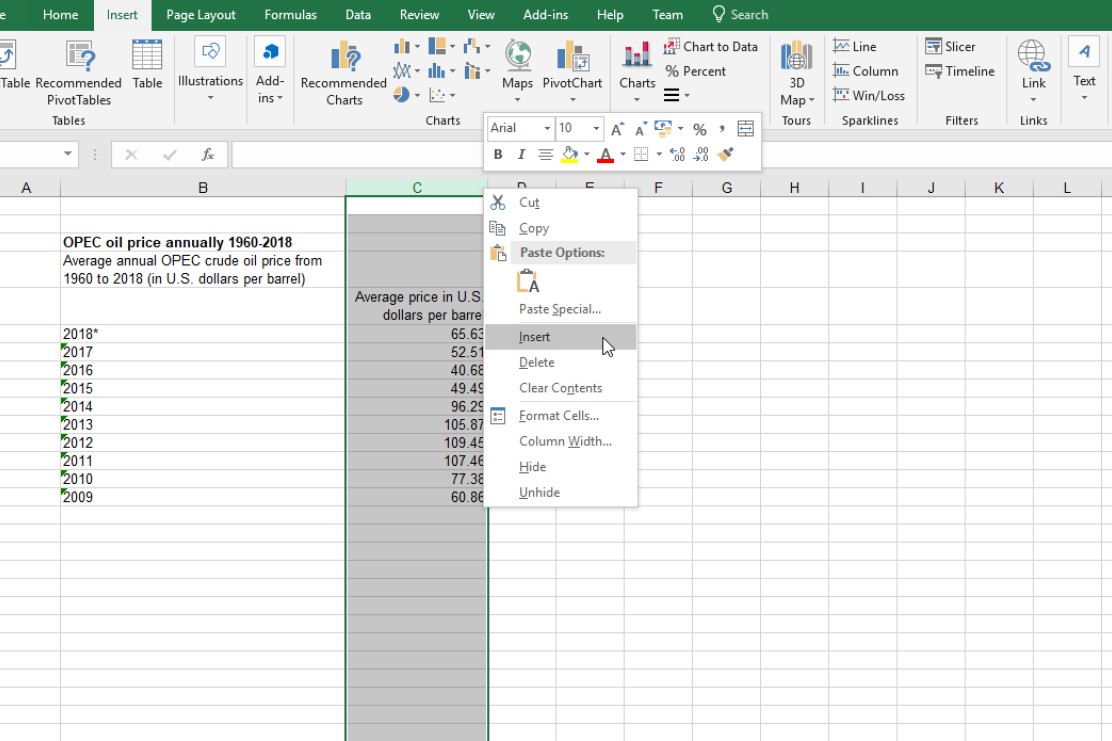
Insert an extra column between the category labels and the first data column. Values in this column are used by think-cell to compute absolute values from percentages. You can safely leave it empty.

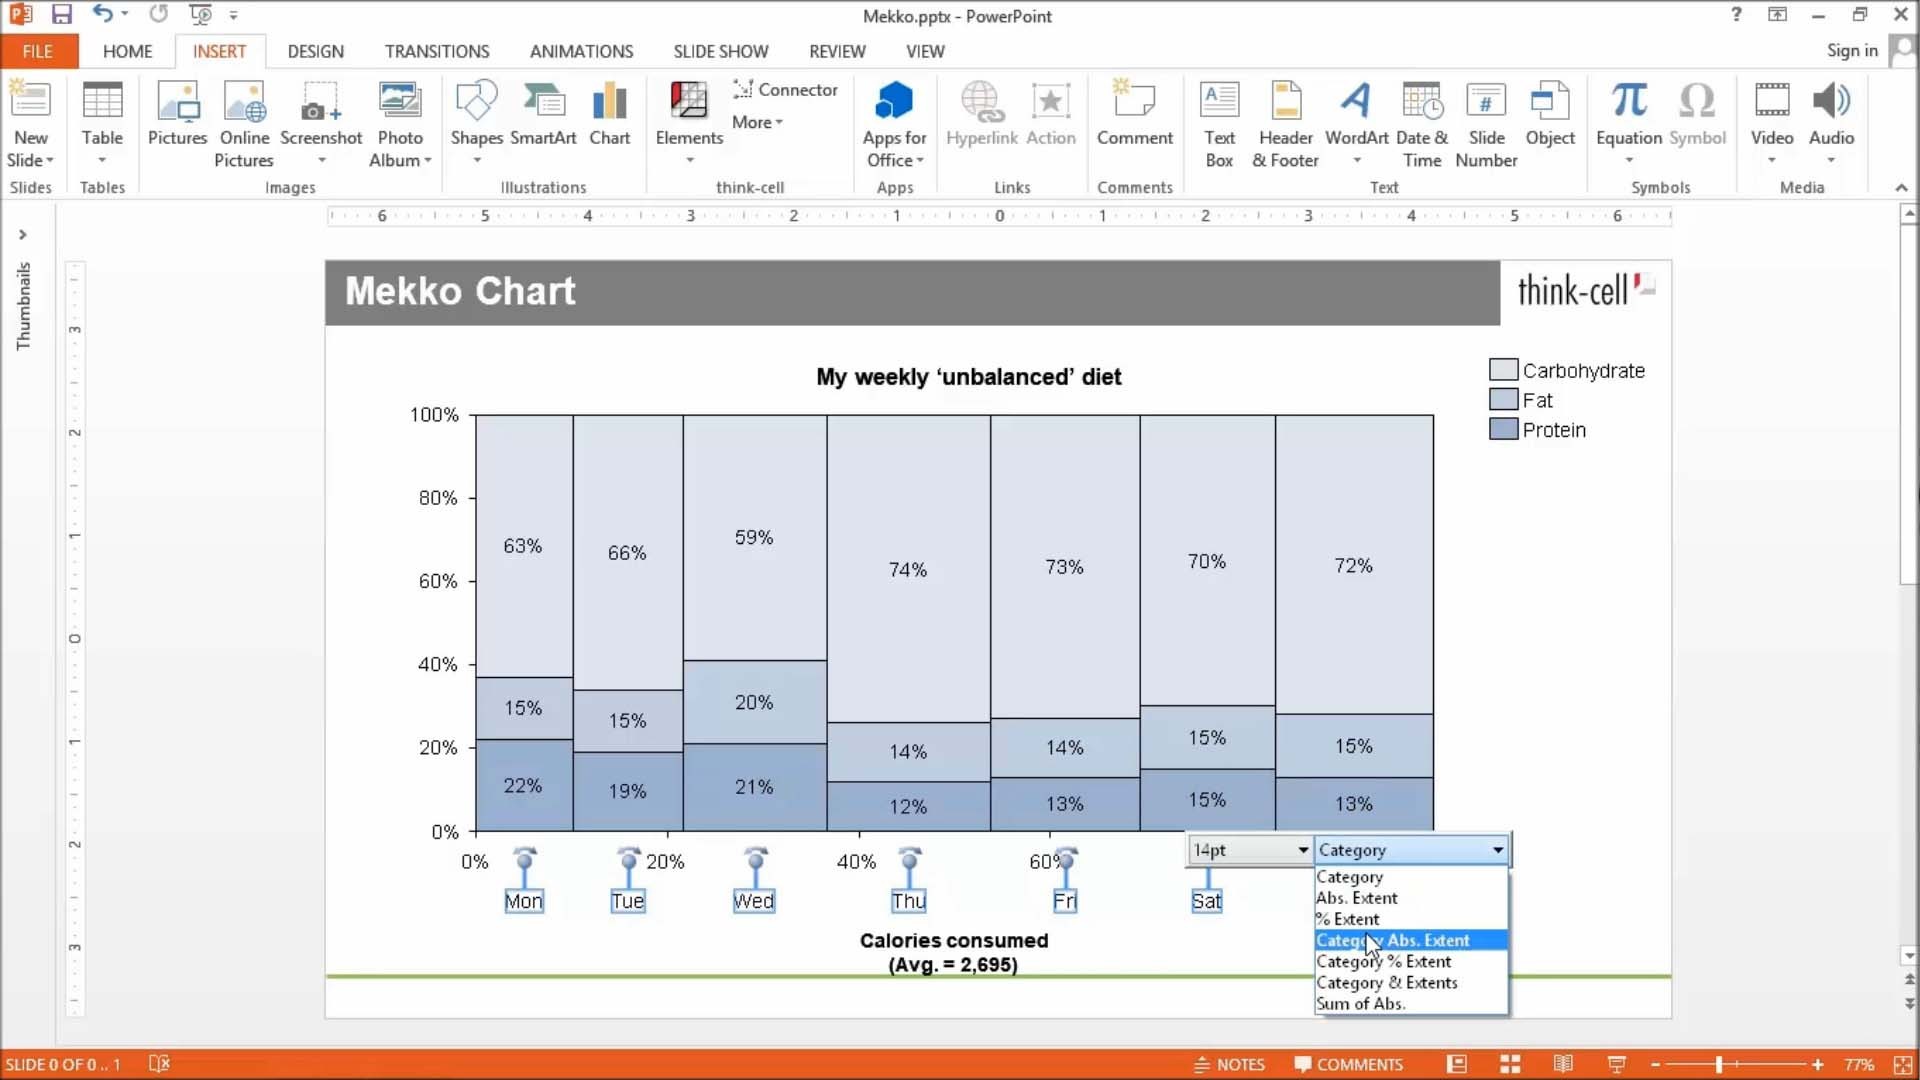
Select the data for your chart

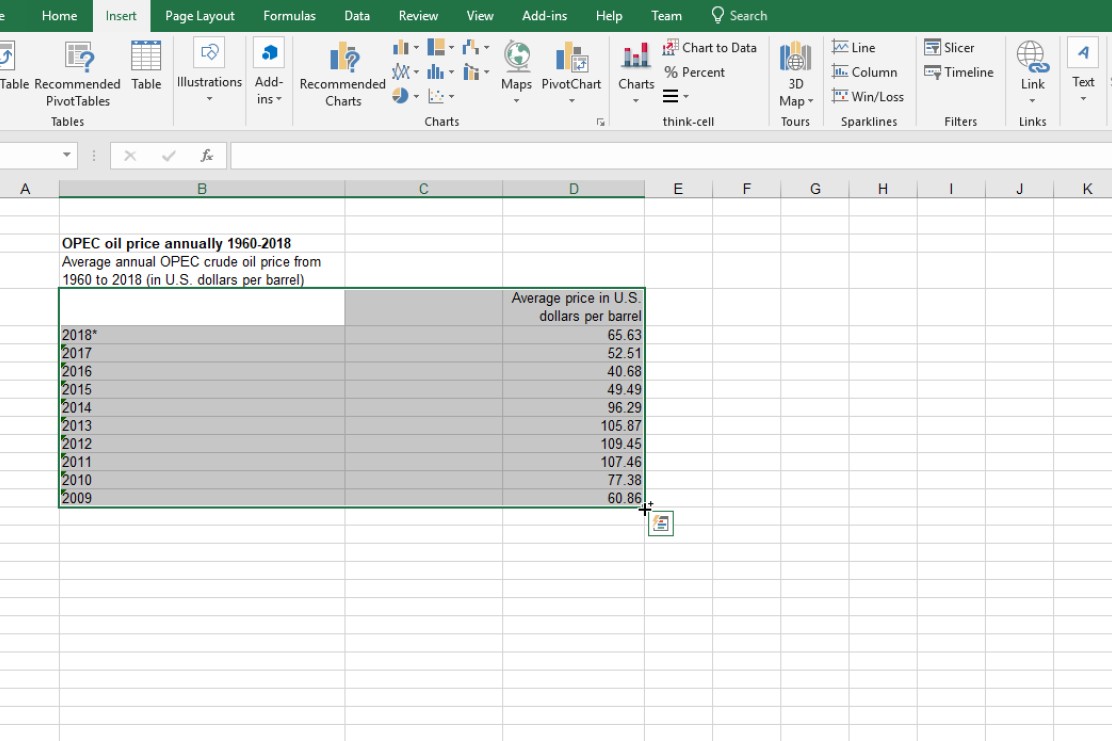
Simply select the Excel data range for the new chart, including category and series labels.
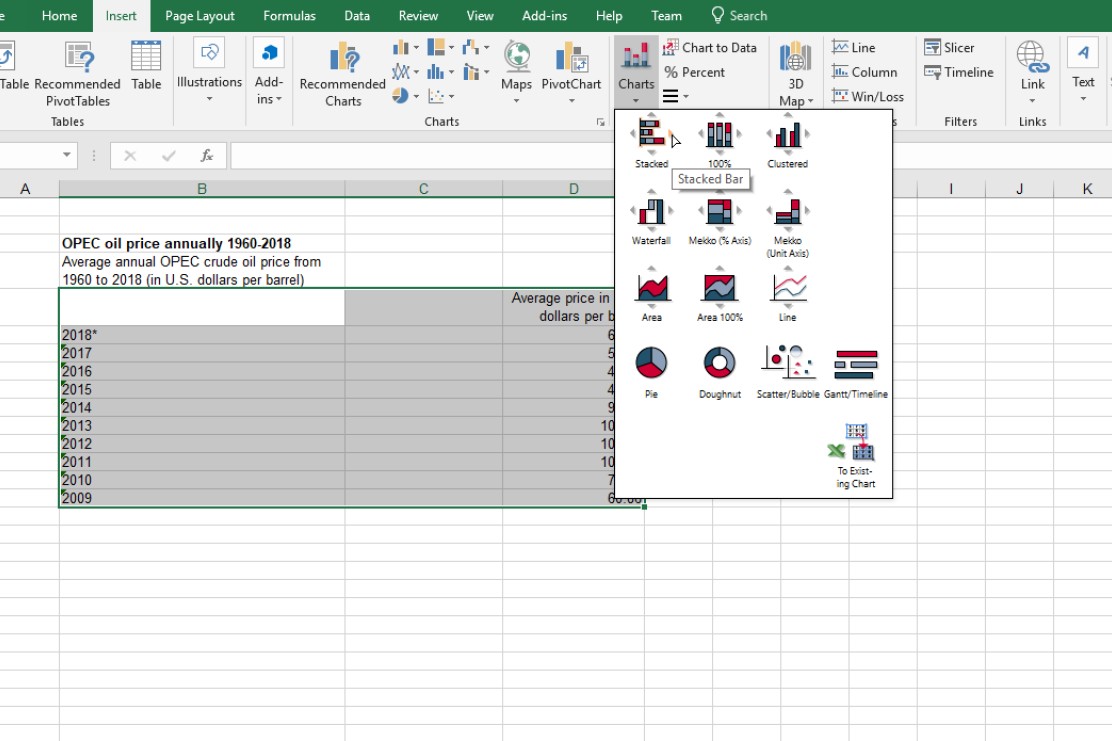
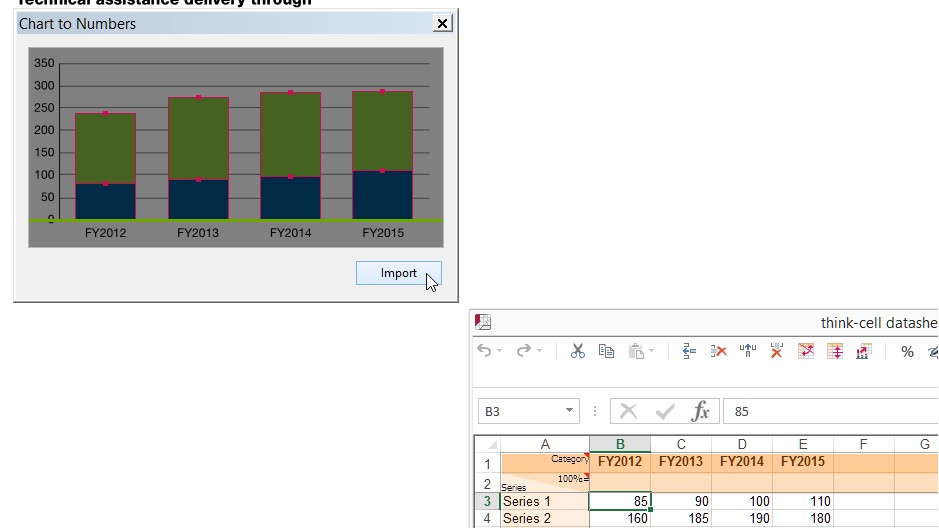
Insert your think-cell chart into PowerPoint

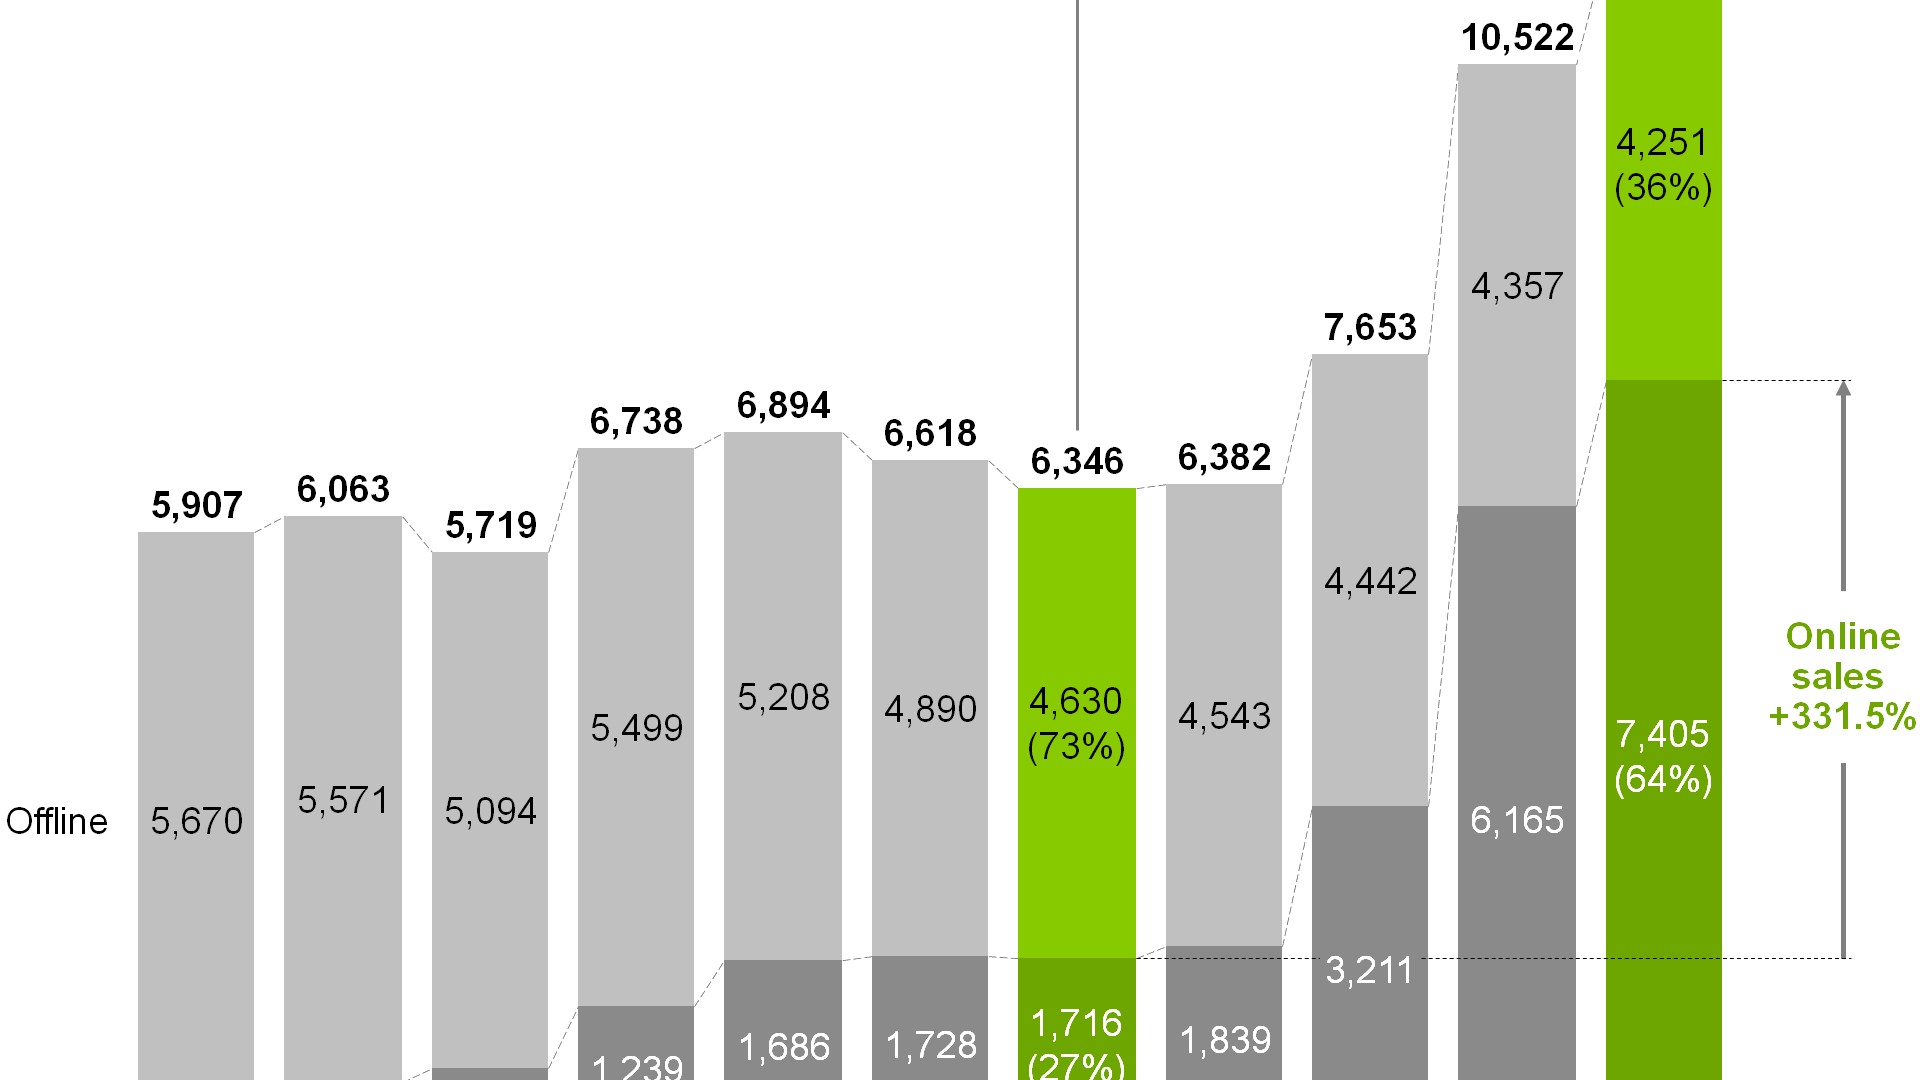
In Excel’s Insert tab, click the button "Charts" in the think-cell ribbon group. Data exported from Statista has the structure for a bar chart. Therefore, use the arrow to the right of the "Stacked" icon to create a stacked bar chart. Later, you can freely rotate the chart in PowerPoint.
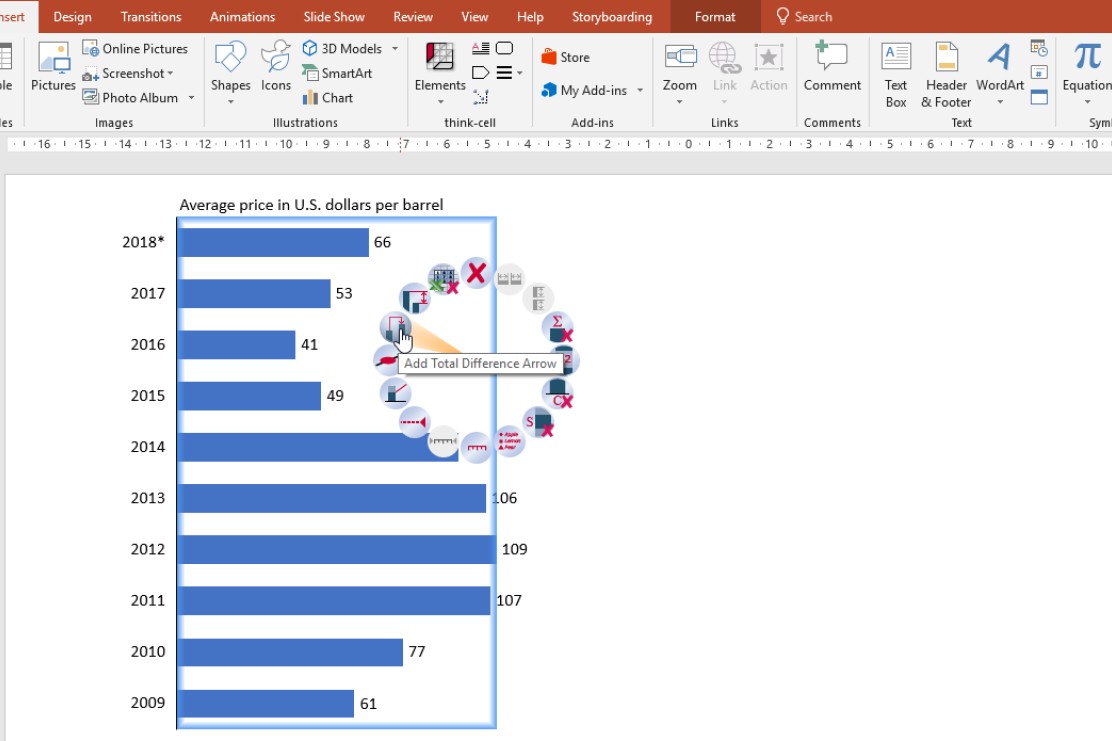
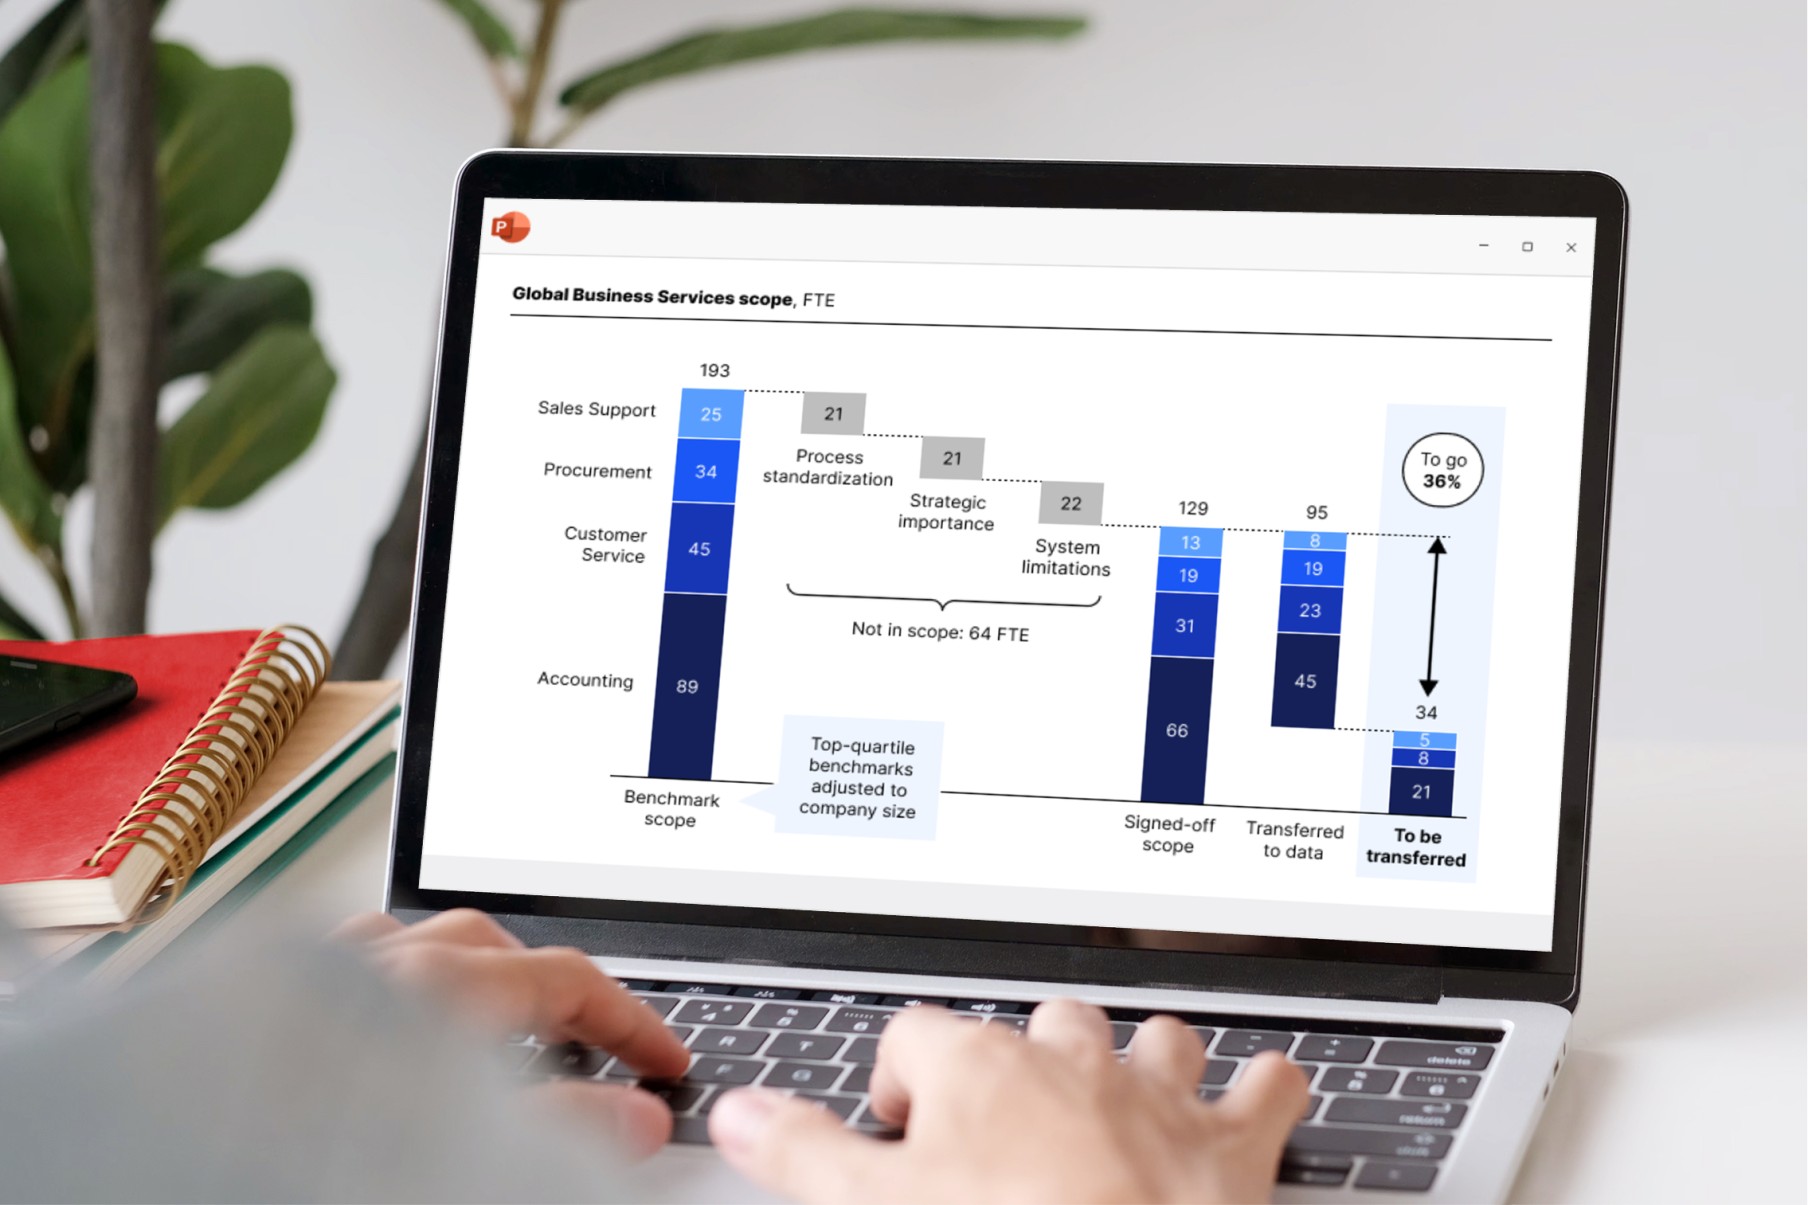
Further highlight your message

That’s it. The new think-cell chart is created in PowerPoint. You can now use think-cell’s powerful features to highlight your chart's message, e.g., by adding difference arrows, axes or value lines.

Bring your statistics to life

think-cell helps you create 40+ stunning chart types in minutes, automates your regular reports and boosts your slide layout. And all this with a single PowerPoint add-in. Here are some of its most awe-inspiring features.

Calendar-based Gantt charts

Ever tried to import a Gantt chart from Microsoft Visio or Project into PowerPoint? If yes, you know that this doesn't work very well. If not, you might still use basic boxes and lines to draw them yourself.

think-cell puts an end to these tedious best practices. You create and update calendar-based Gantt charts directly in PowerPoint. Features such as 5- or 7-day work weeks, remark and responsibility labels or time span brackets make sure that your work time on Gantts reduces to a few minutes instead of hours.

Automatic waterfall charts

Creating waterfalls in PowerPoint is time-consuming and error-prone. You either push basic shapes around or use a hidden data row that supports floating segments. Hence, any data change implies many manual calculations and adjustments.

In think-cell, positive data values in waterfalls build up, negative values build down. This works automatically, even for stacked segments. Segments can cross the baseline and build upon segments in any category – not only the previous one.

Data-driven visual annotations

Whether it be total labels, percentages, averages, breaks, difference arrows or CAGRs – think-cell will help you to tell the story behind your data by offering dozens of data-driven visual annotations.

And what is even better: All calculations and placements are done automatically. Your derived data will always be correct and labels or arrows will never overlap.

Mekko charts for complex analyses

Want to show market share for different competitors and different product categories at the same time? Why not add a second dimension to your data visualization? A Mekko (also known as Marimekko) is the perfect chart for this job.

think-cell's Mekko chart is a two-dimensional 100% chart or stacked chart. Column widths are calculated automatically or can be provided by you. Values can be ordered by size and small values can be hidden in an "other" series.

Smart text boxes

When it comes to slide layout in PowerPoint, all your options entail unsatisfactory compromises: You may use an inflexible PowerPoint table, combine standard text boxes and face many tedious manual adjustments, or you may use a template from PowerPoint's SmartArt or your own library and soon bump into its limitations.

Using think-cell's smart text boxes, you can quickly build up complex slides like this one. When adding text and other elements, the slide layout is continuously optimized automatically. Meaningful actions like snapping together, aligning and moving elements define a smart grid so that you never need to place or resize shapes manually.

Flexible process flows

Have you ever tried building a simple process chain in PowerPoint? Are you still struggling with the right positioning of basic shapes or trying to combine weird SmartArt objects that never align correctly and fall apart after a few interactions?

Then meet our process flow. With it you create and change simple flows in minutes. But since it is based on a powerful generic layout engine, you are completely flexible and can build any conceptual slide based on pentagons, chevrons and text boxes.

Automated data visualization

You spend hours and hours on updating charts in your reports every month? Cut down these hours to a few minutes!

With think-cell's data links, every chart in your presentation can be linked to Excel and updated either manually or automatically. think-cell programmatic interfaces offer even more automation. Once set up, they will create entire slide decks from your chart templates and designated data. Periodic reporting couldn't be easier.

Data extraction from any column chart image

Have you recently seen a chart on a web site or in a PDF report that you would have liked to use in your presentation? Using copy & paste in this situation yields good visual results, but makes changes impossible. On the other hand, guessing and retyping the data underlying the chart is time-consuming and error-prone.

Using think-cell, you simply drag a transparent window over any image of a column chart on your screen, hit the import button and let our software do the rest. It will not only correctly extract the data, but also the category labels and put them into your Excel sheet. From there, a think-cell chart in PowerPoint is only one click away.

1,000,000 users at 25,000
rely on think-cell every day

10 of the top 10 consulting firms
According to vault.com

Seven of these firms provide our software to all their consultants.

89 of the top 100 US blue chip companies
According to Fortune 500

9 of the top 10 business schools
According to U.S. News & World Report

All of them provide our software to all their students and faculty members.

Create beautiful slides in minutes with think-cell

Get started now!

Share