Build Gantt charts in no time
Ever tried to create a Gantt chart in PowerPoint? Use think-cell and benefit from:
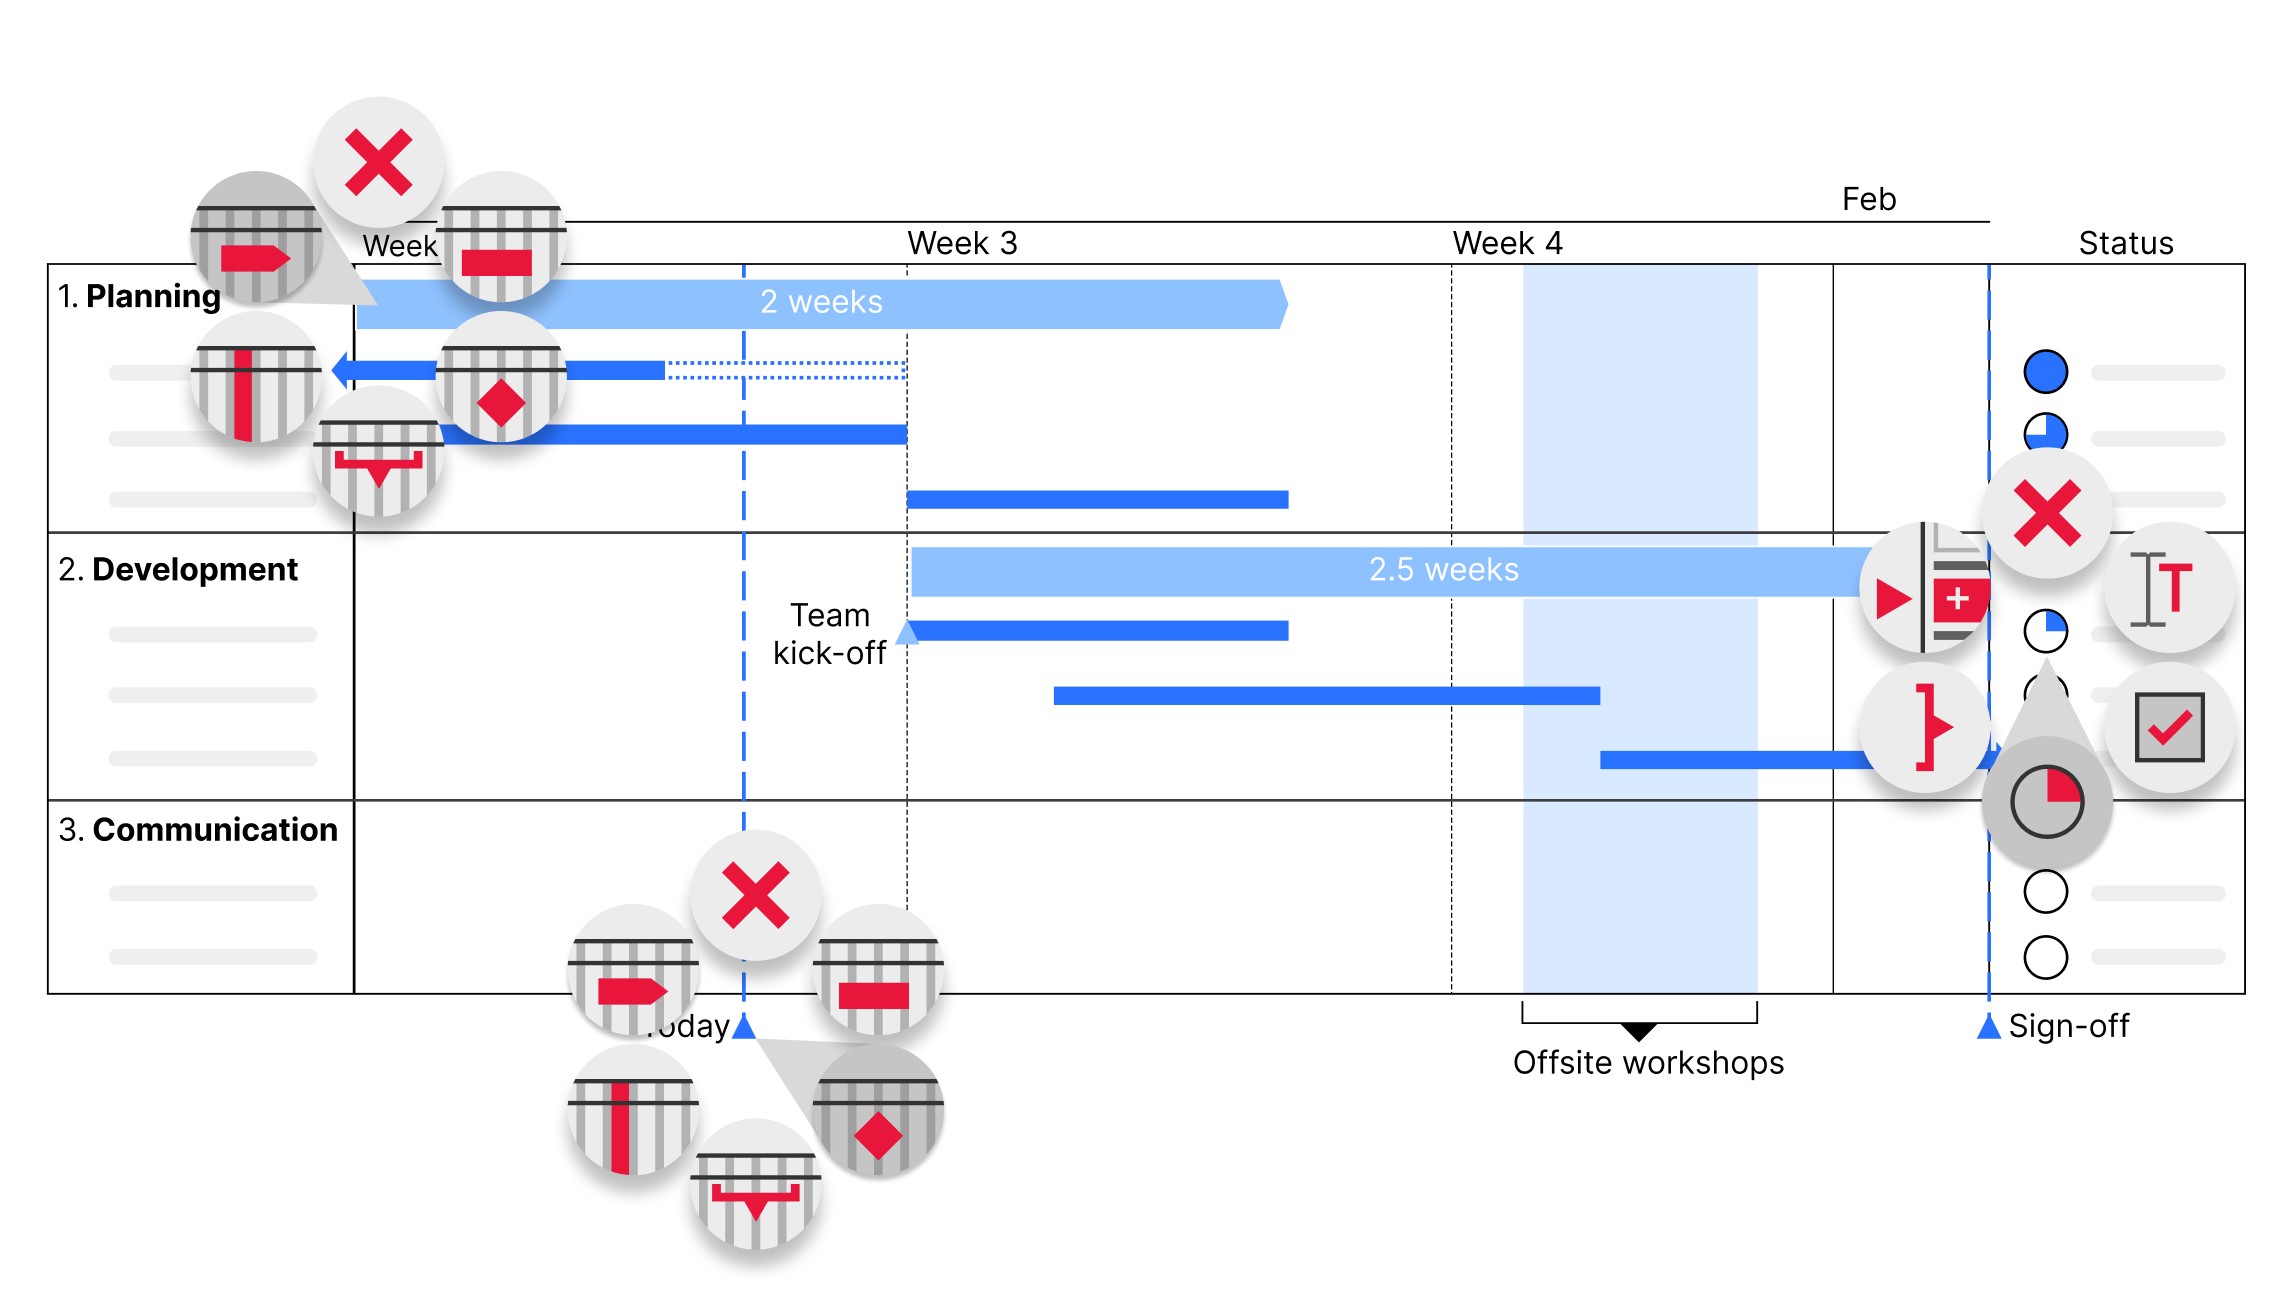
- Dependencies and milestones that just work: add arrows, move a bar, everything realigns.
- Progress and phases at a glance: % fill, phases/subtasks, consistent status colors.
- Calendar-true timelines: day/week/month/quarter, date-snap, Today line, Excel updates.
Why think-cell makes the difference
less working time
end users worldwide
compatible with Windows and macOS
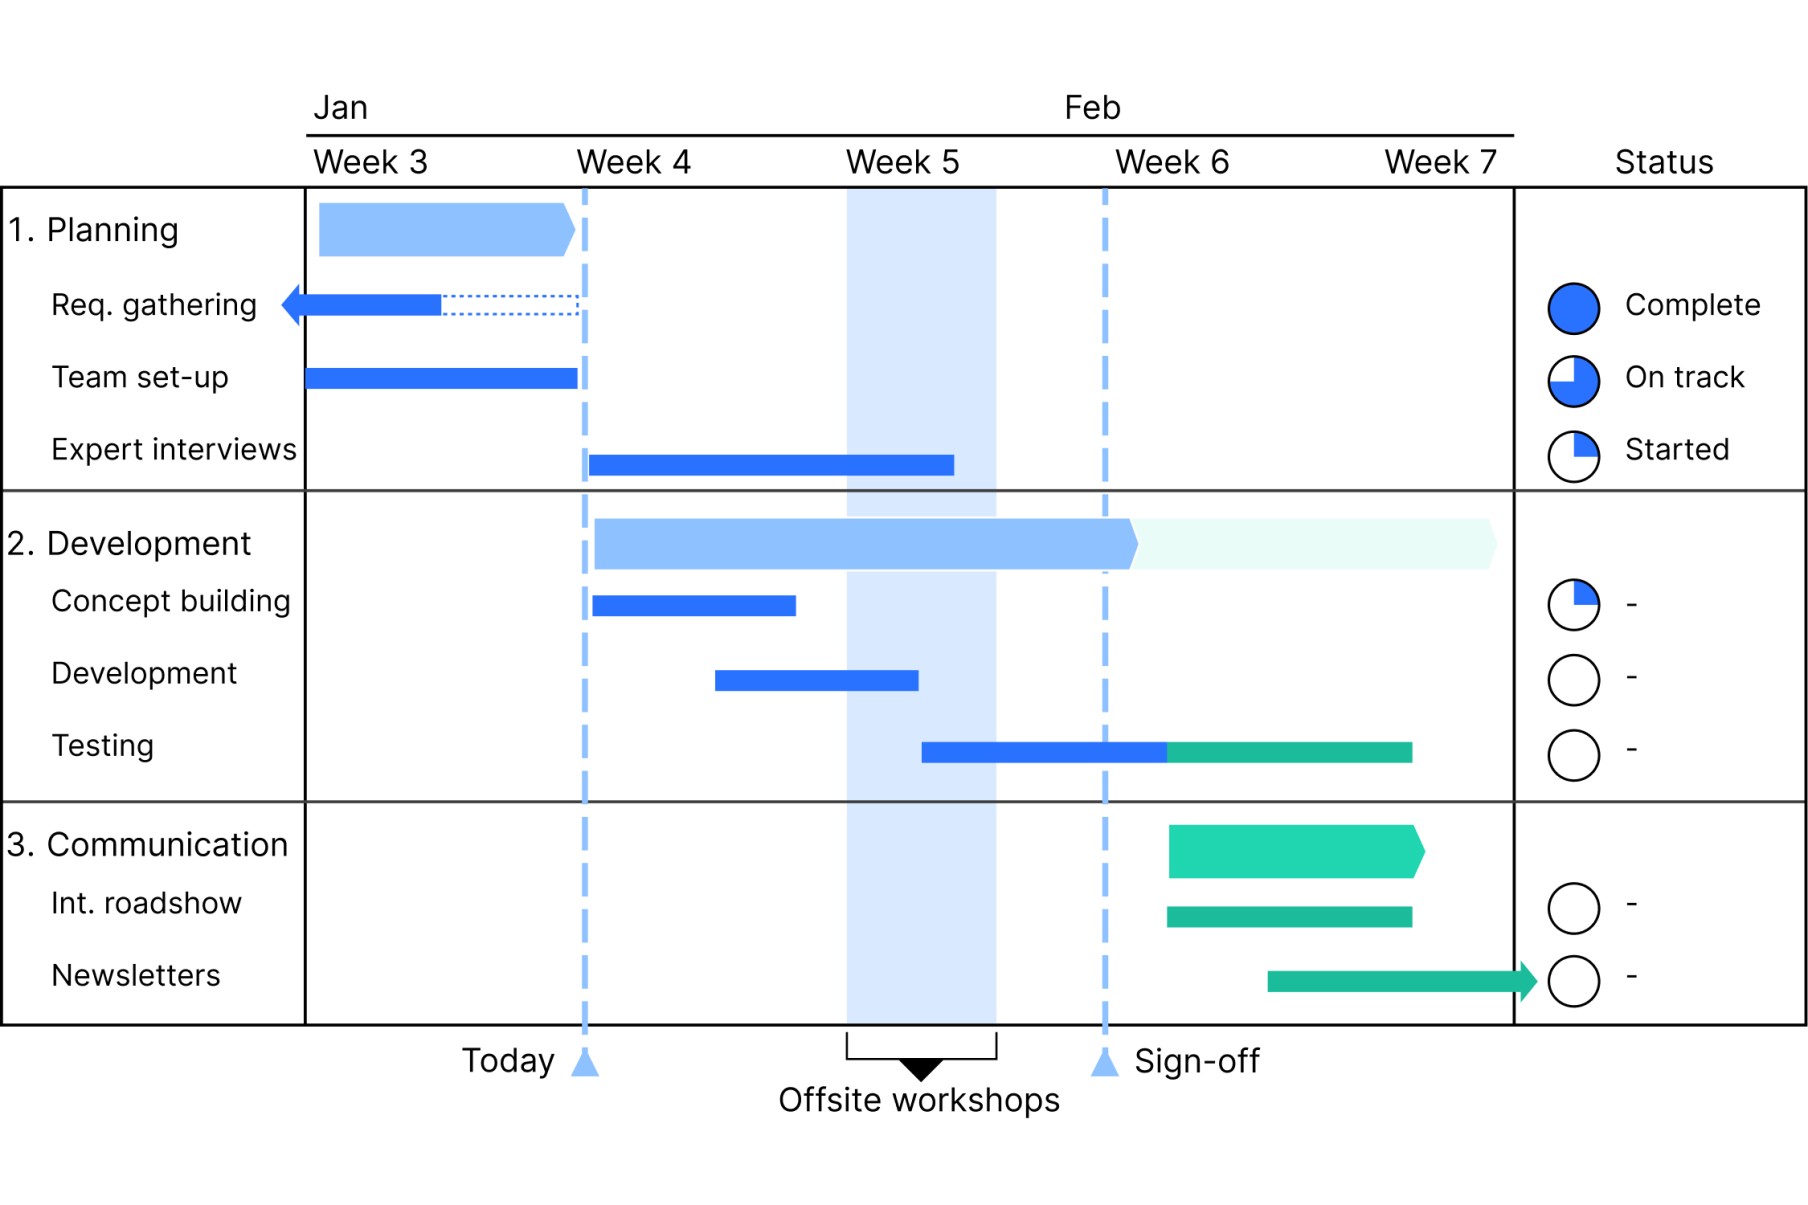
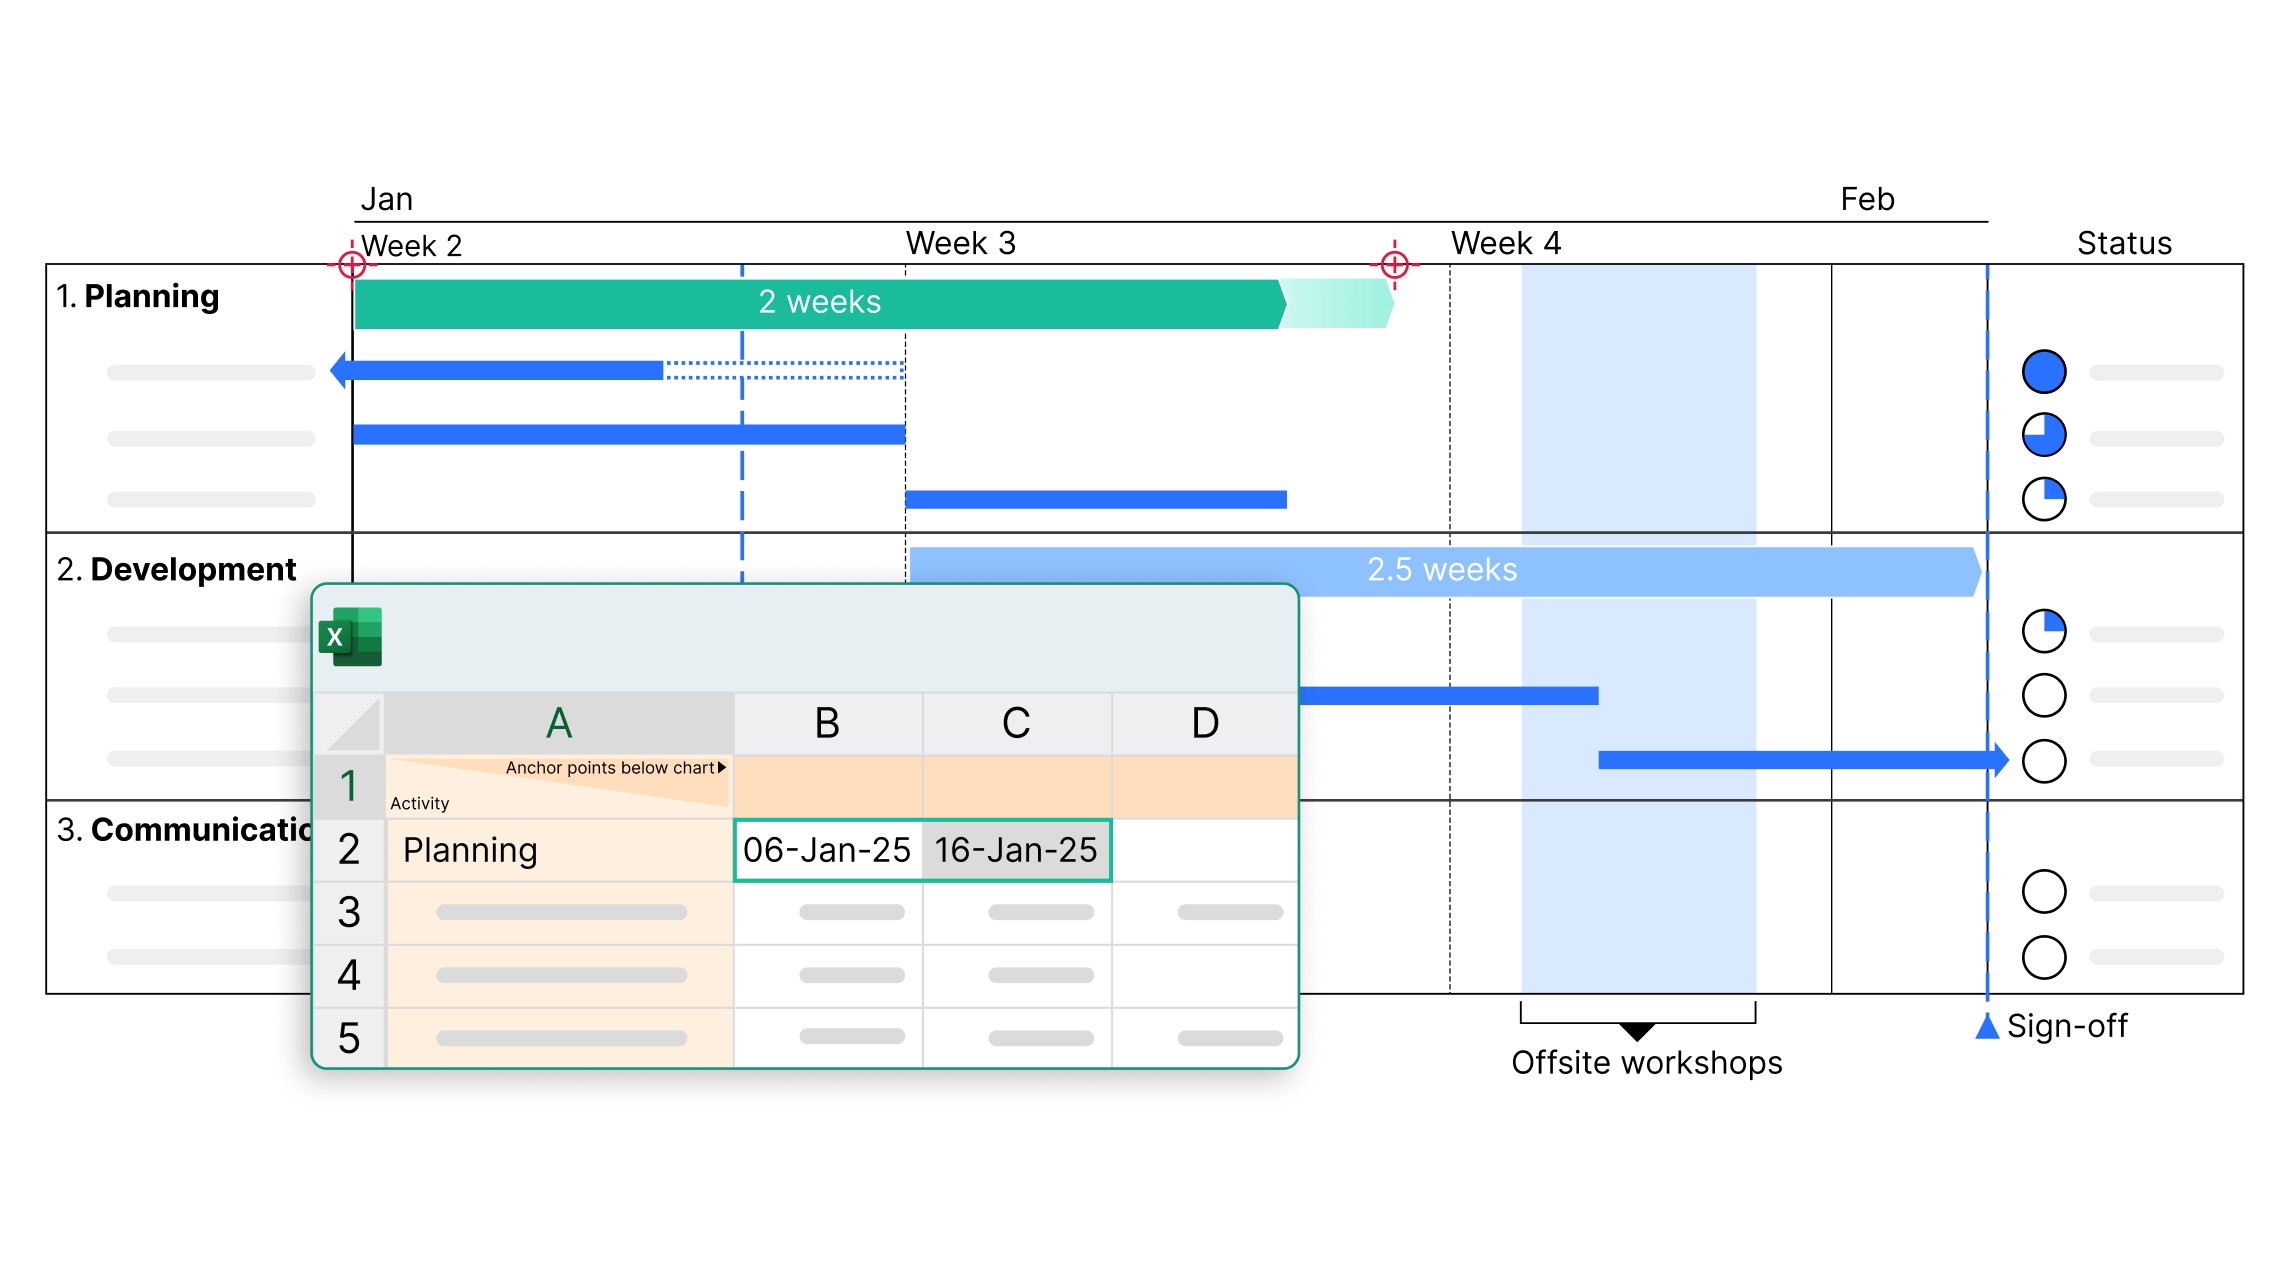
Create Gantt charts directly in PowerPoint
Overcome PowerPoint's weaknesses with think-cell's automatic Gantt charts.
Add flexible columns containing data-driven elements like Harvey balls and checkboxes to show project status and completed initiatives.
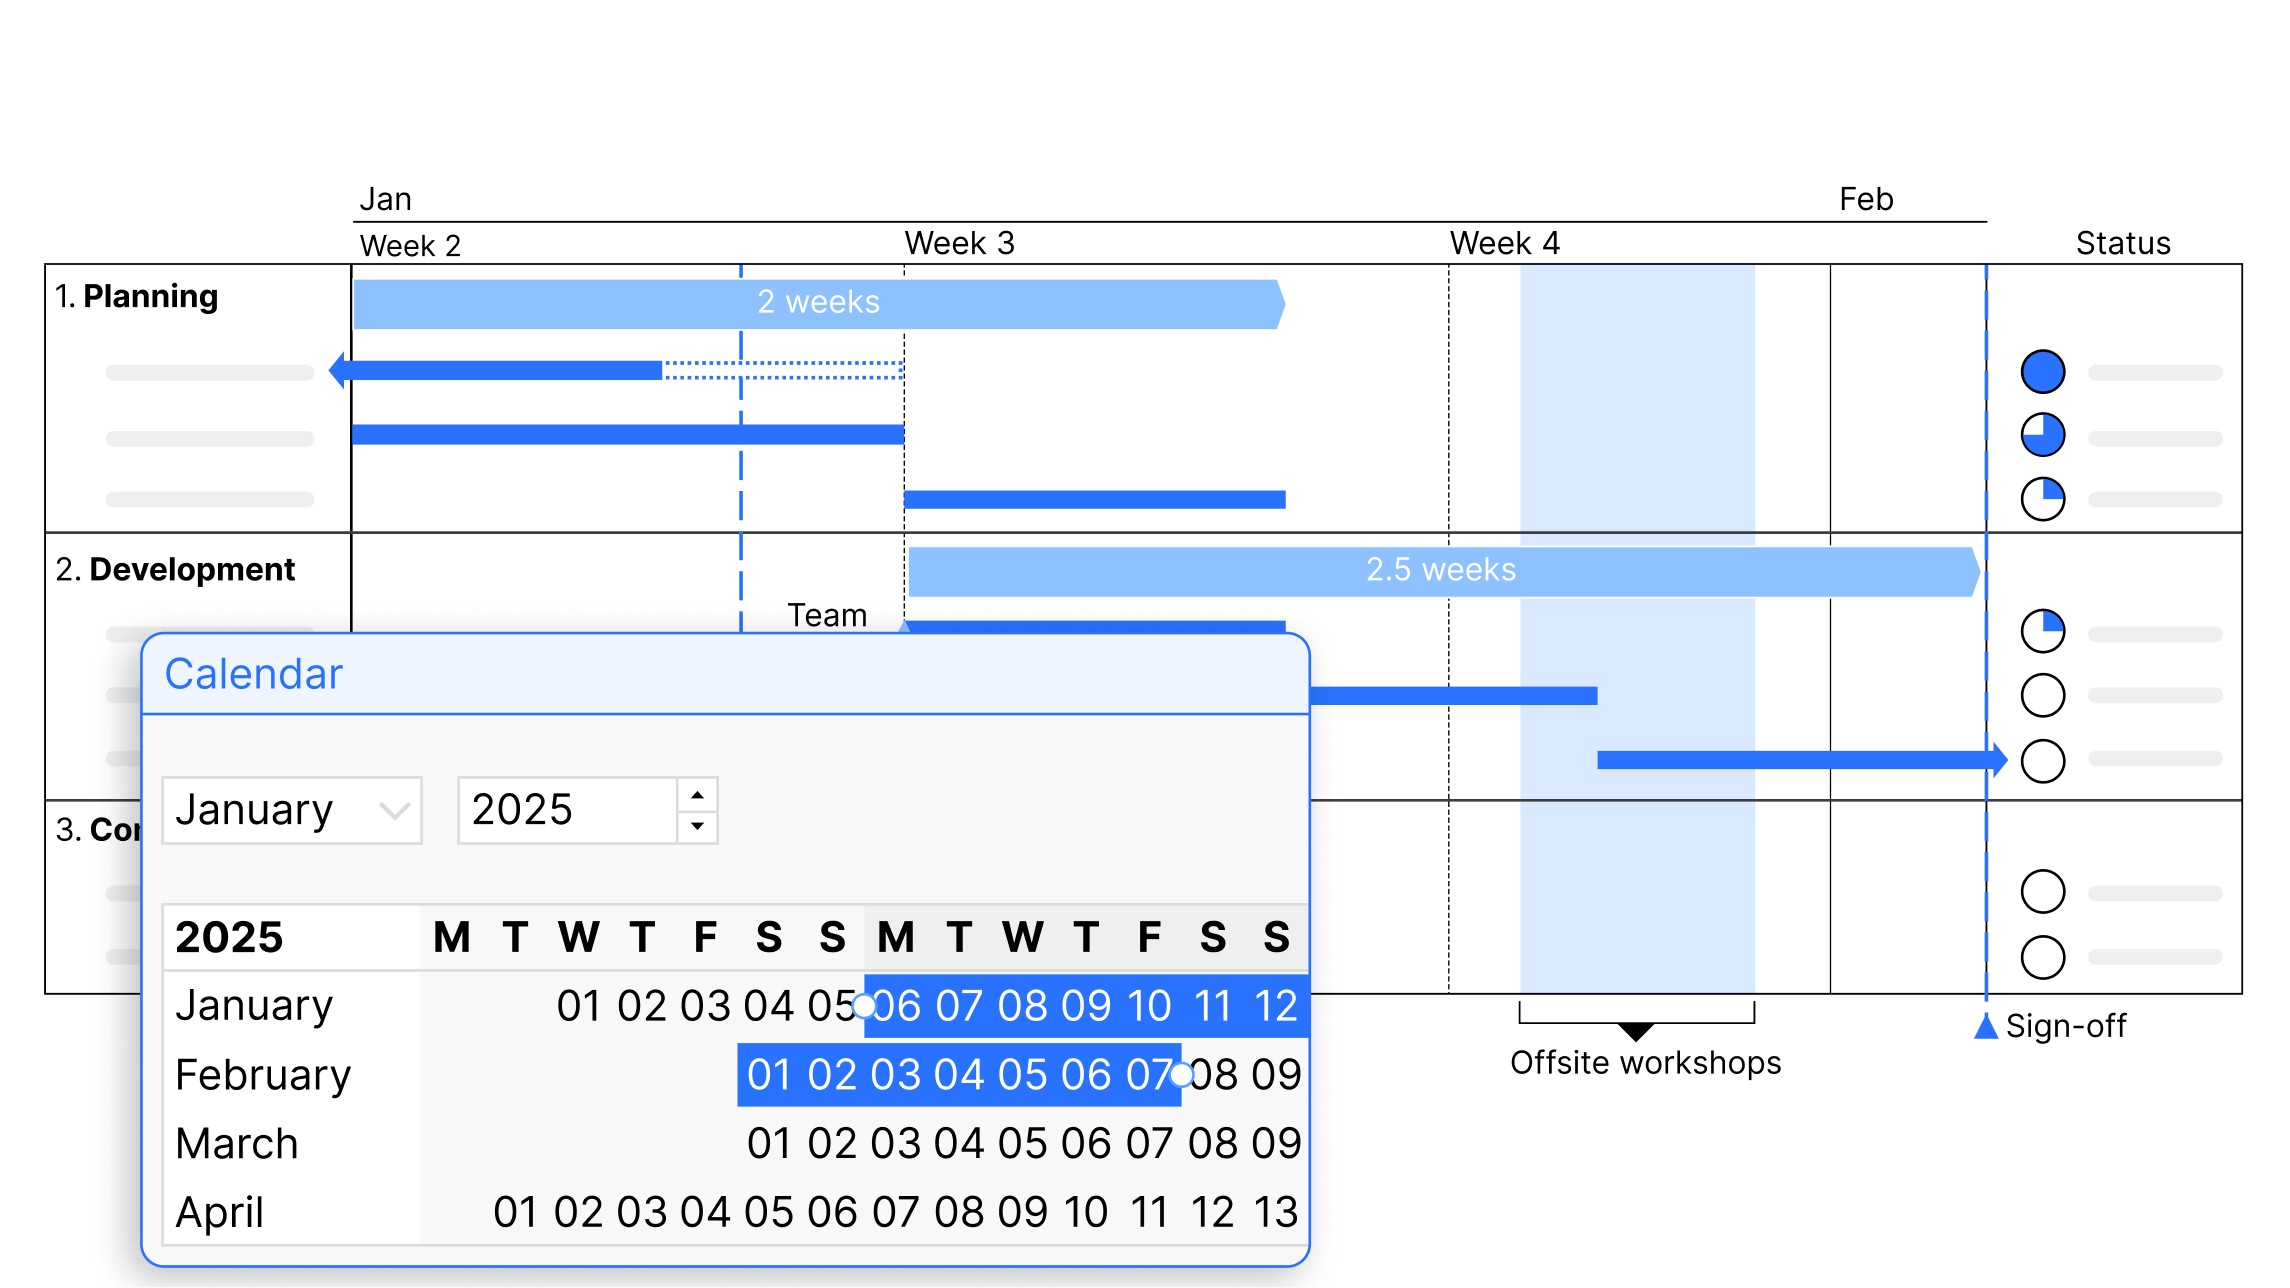
Choose your scale from day, week, month, quarter, or calendar and fiscal years, and add activity bars and milestones that connect directly to the calendar.
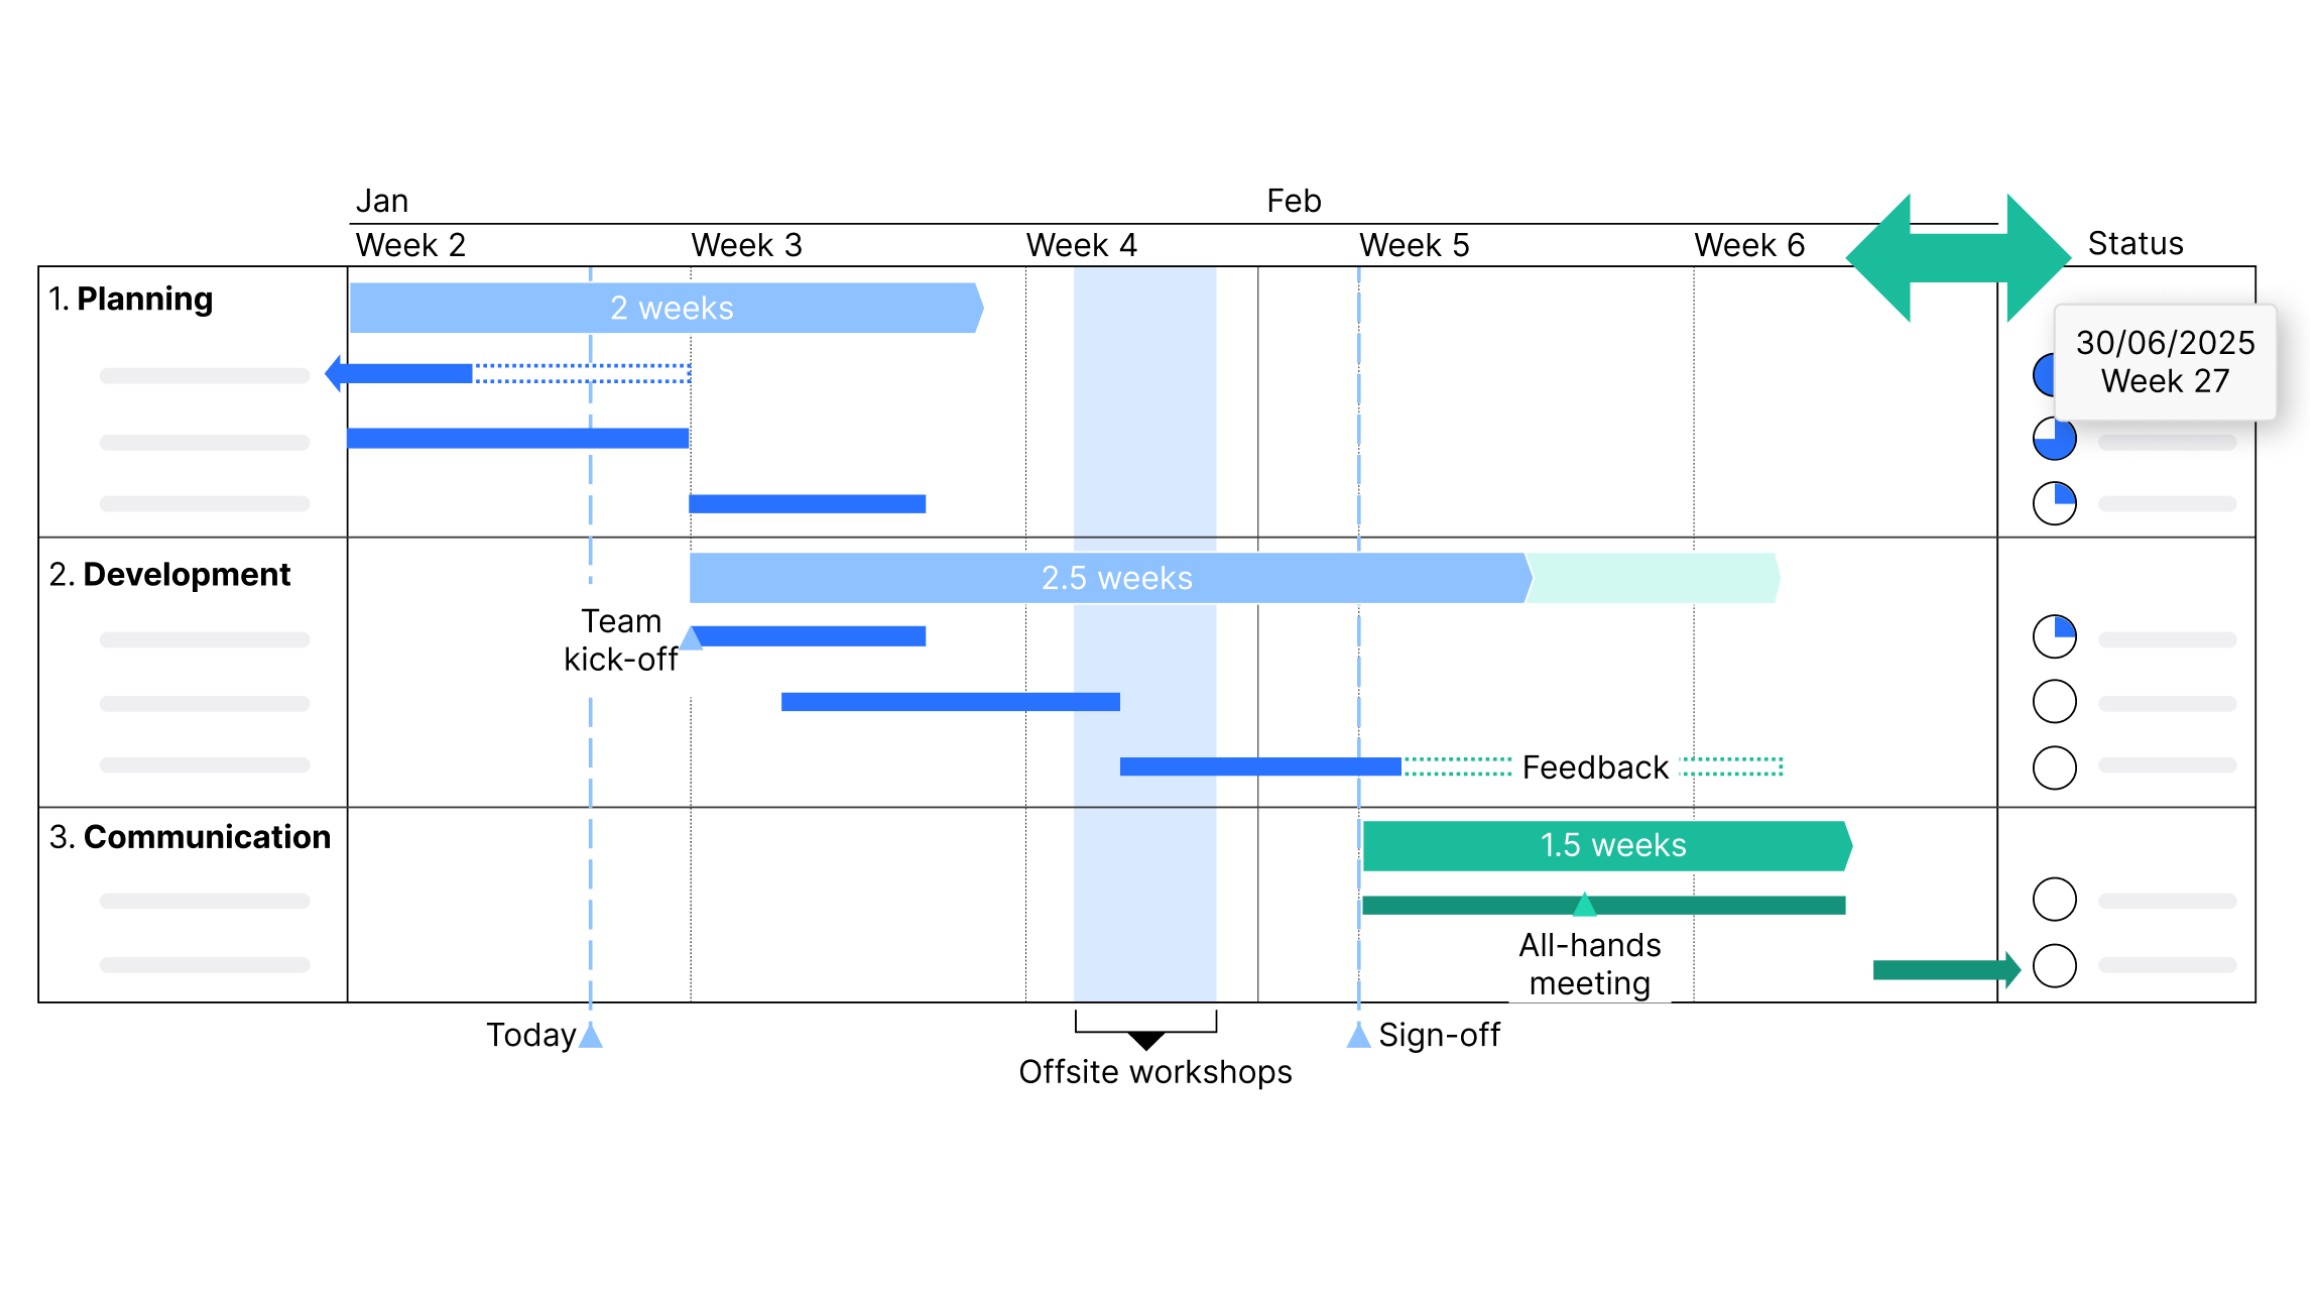
Edit your content, not your row heights and column widths. The Gantt chart adjusts automatically to maintain readability when you add or remove items.
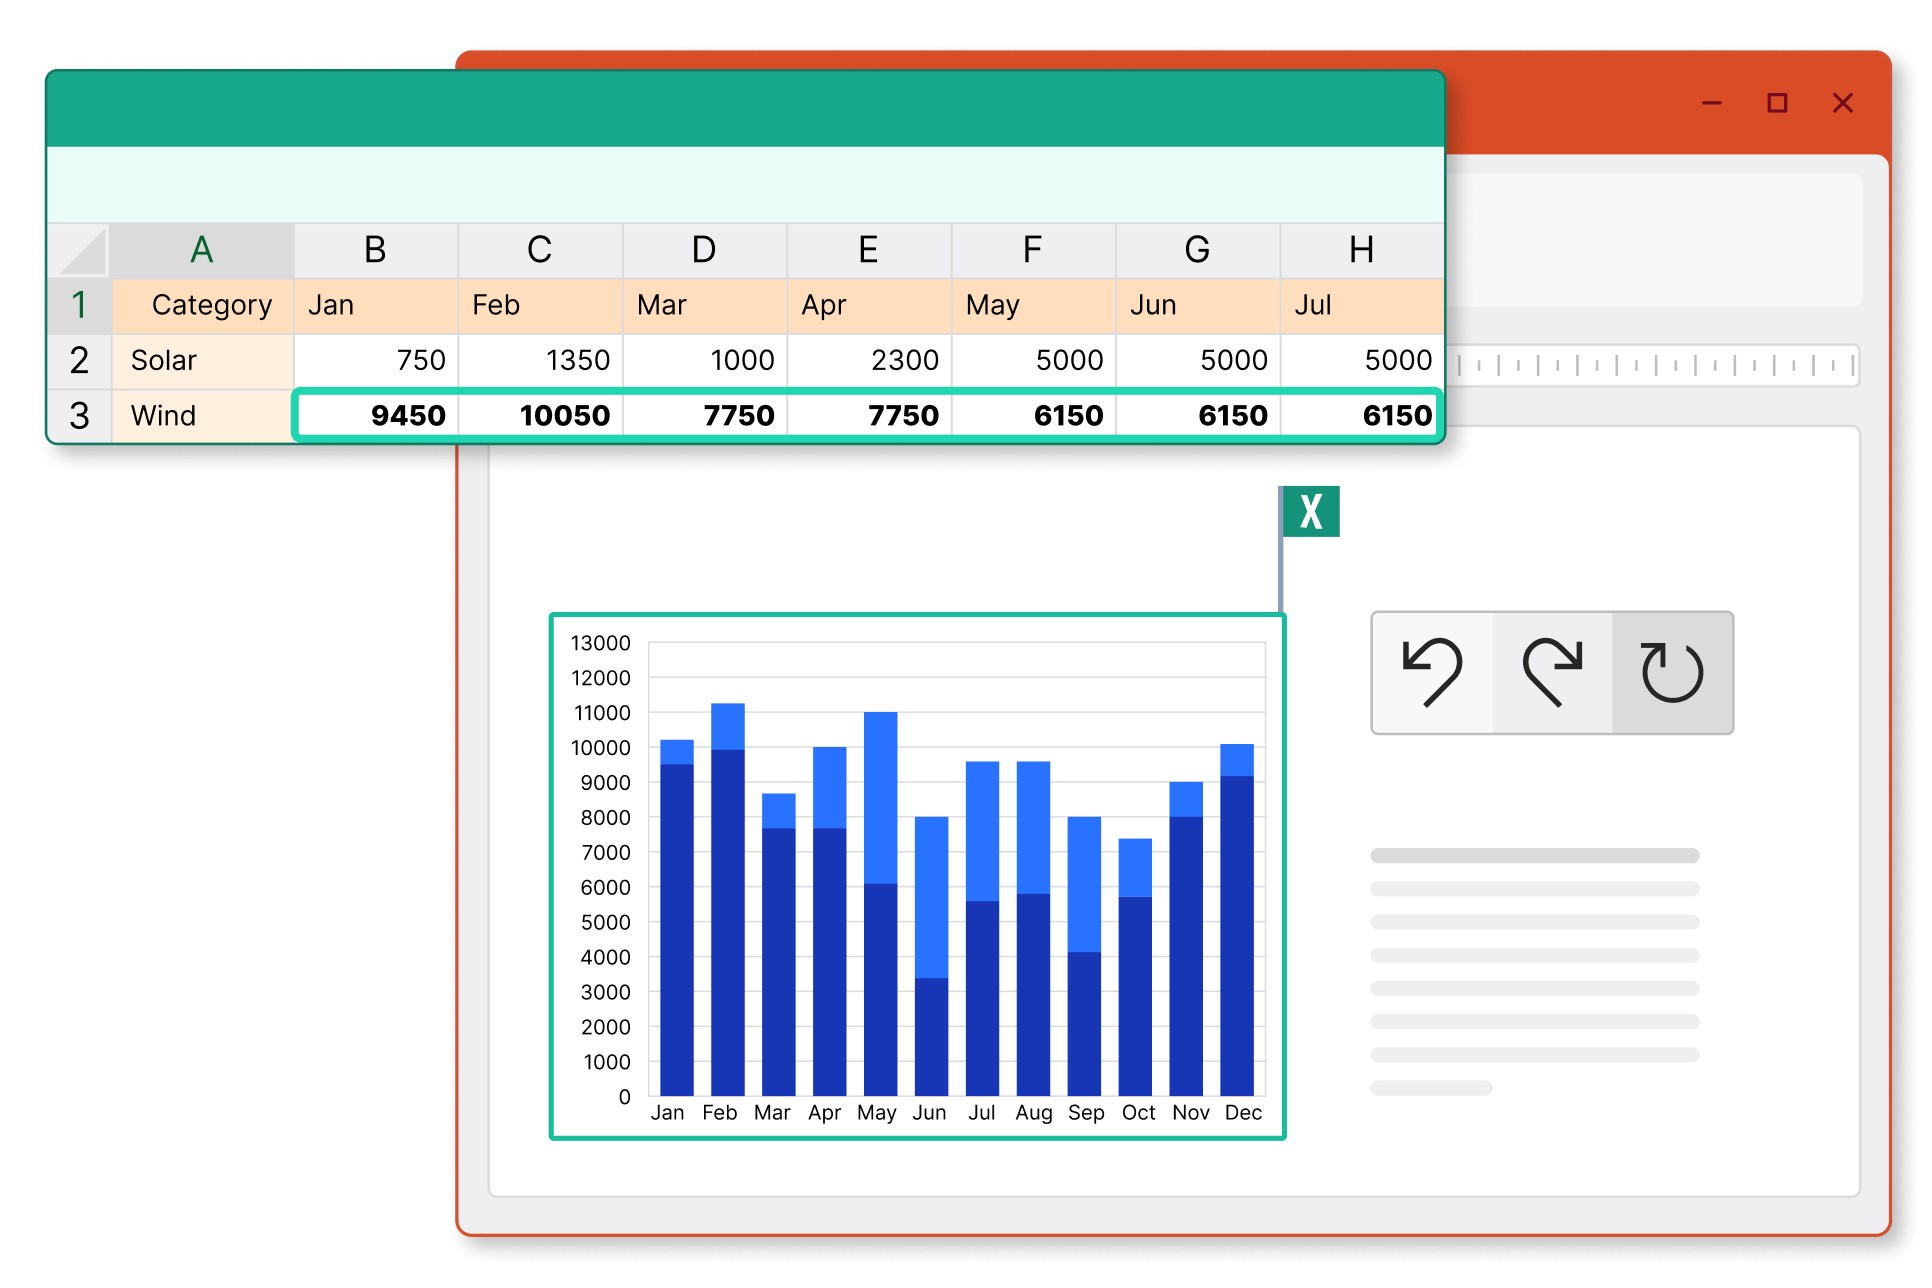
Connect Gantt charts with your Excel and enable automatic data updates. Ideal for large projects and frequent data changes.
Trusted by over 35,000 companies worldwide
People know exceptional software when they see it.

The ability to create Gantt charts quickly to manage project timelines and align cross-functional teams is a game-changer.

We automate our reports by establishing links not just to chart data ranges, but to every single cell that contains a value. In this way, think-cell’s Excel links helps us generate our reports faster, while also guaranteeing 100% accuracy.

Automating chart creation and updates cuts the time spent on presentations by half, allowing the team to focus more on analysis and less on formatting.

If I need 10 minutes to create a chart natively in PowerPoint, think-cell reduces this to just 3-5 minutes.
Get started with think-cell
- Create professional charts and data-driven tables.
- Deliver impactful presentations faster.
- Try for 30 days, no credit card required and no cancellation necessary.
Link your Gantt chart with your excel
Control how you manage updates to ensure your presentations maintain full data consistency. Completely automatic.
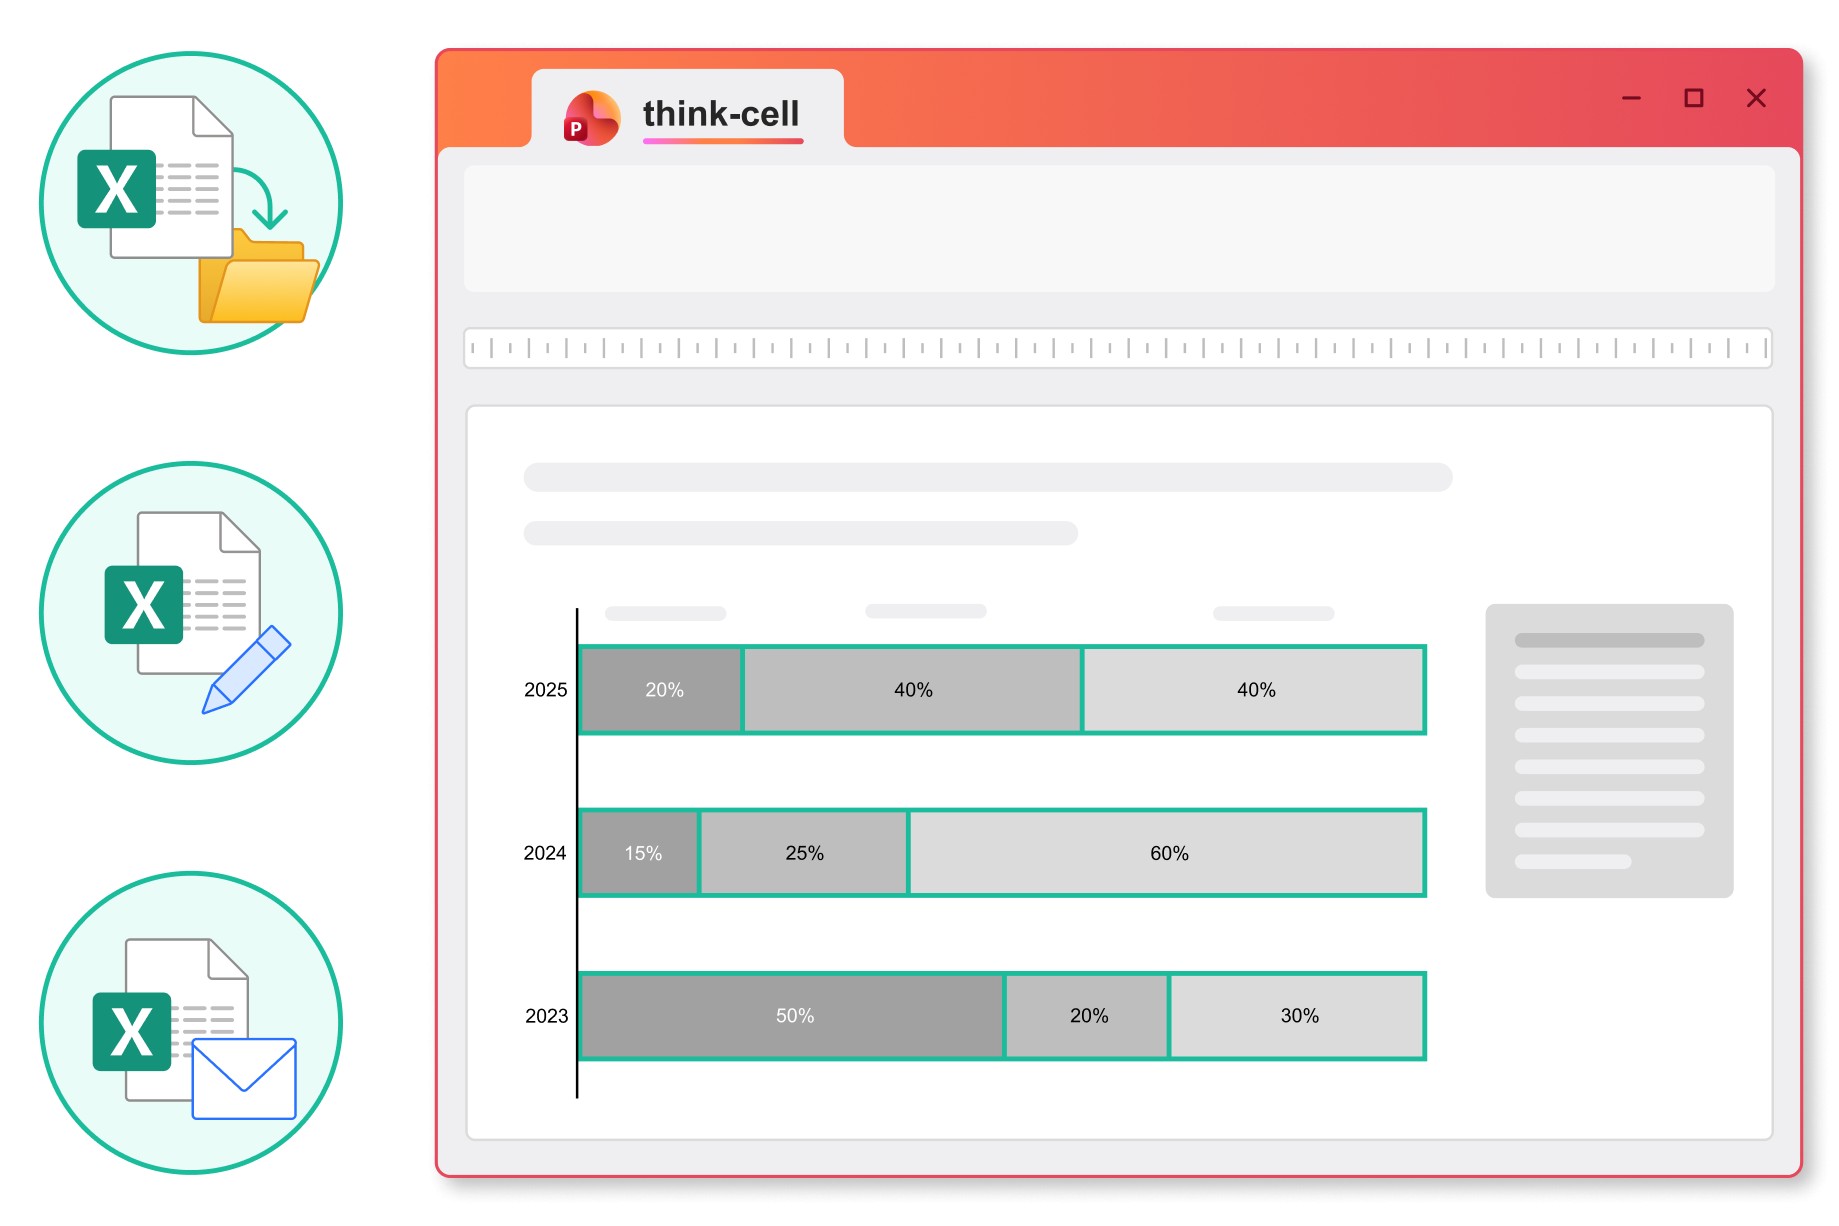
Choose between automatic and manual updates, and see when files are moved or renamed to stay in control of the data you share.
Link any content from a cell in your Excel spreadsheet to charts, tables, in-line text or any other object in your PowerPoint presentation.
Insert tables into PowerPoint and choose to link just the data, also link the formatting, or to add an image that is synced to your Excel range.
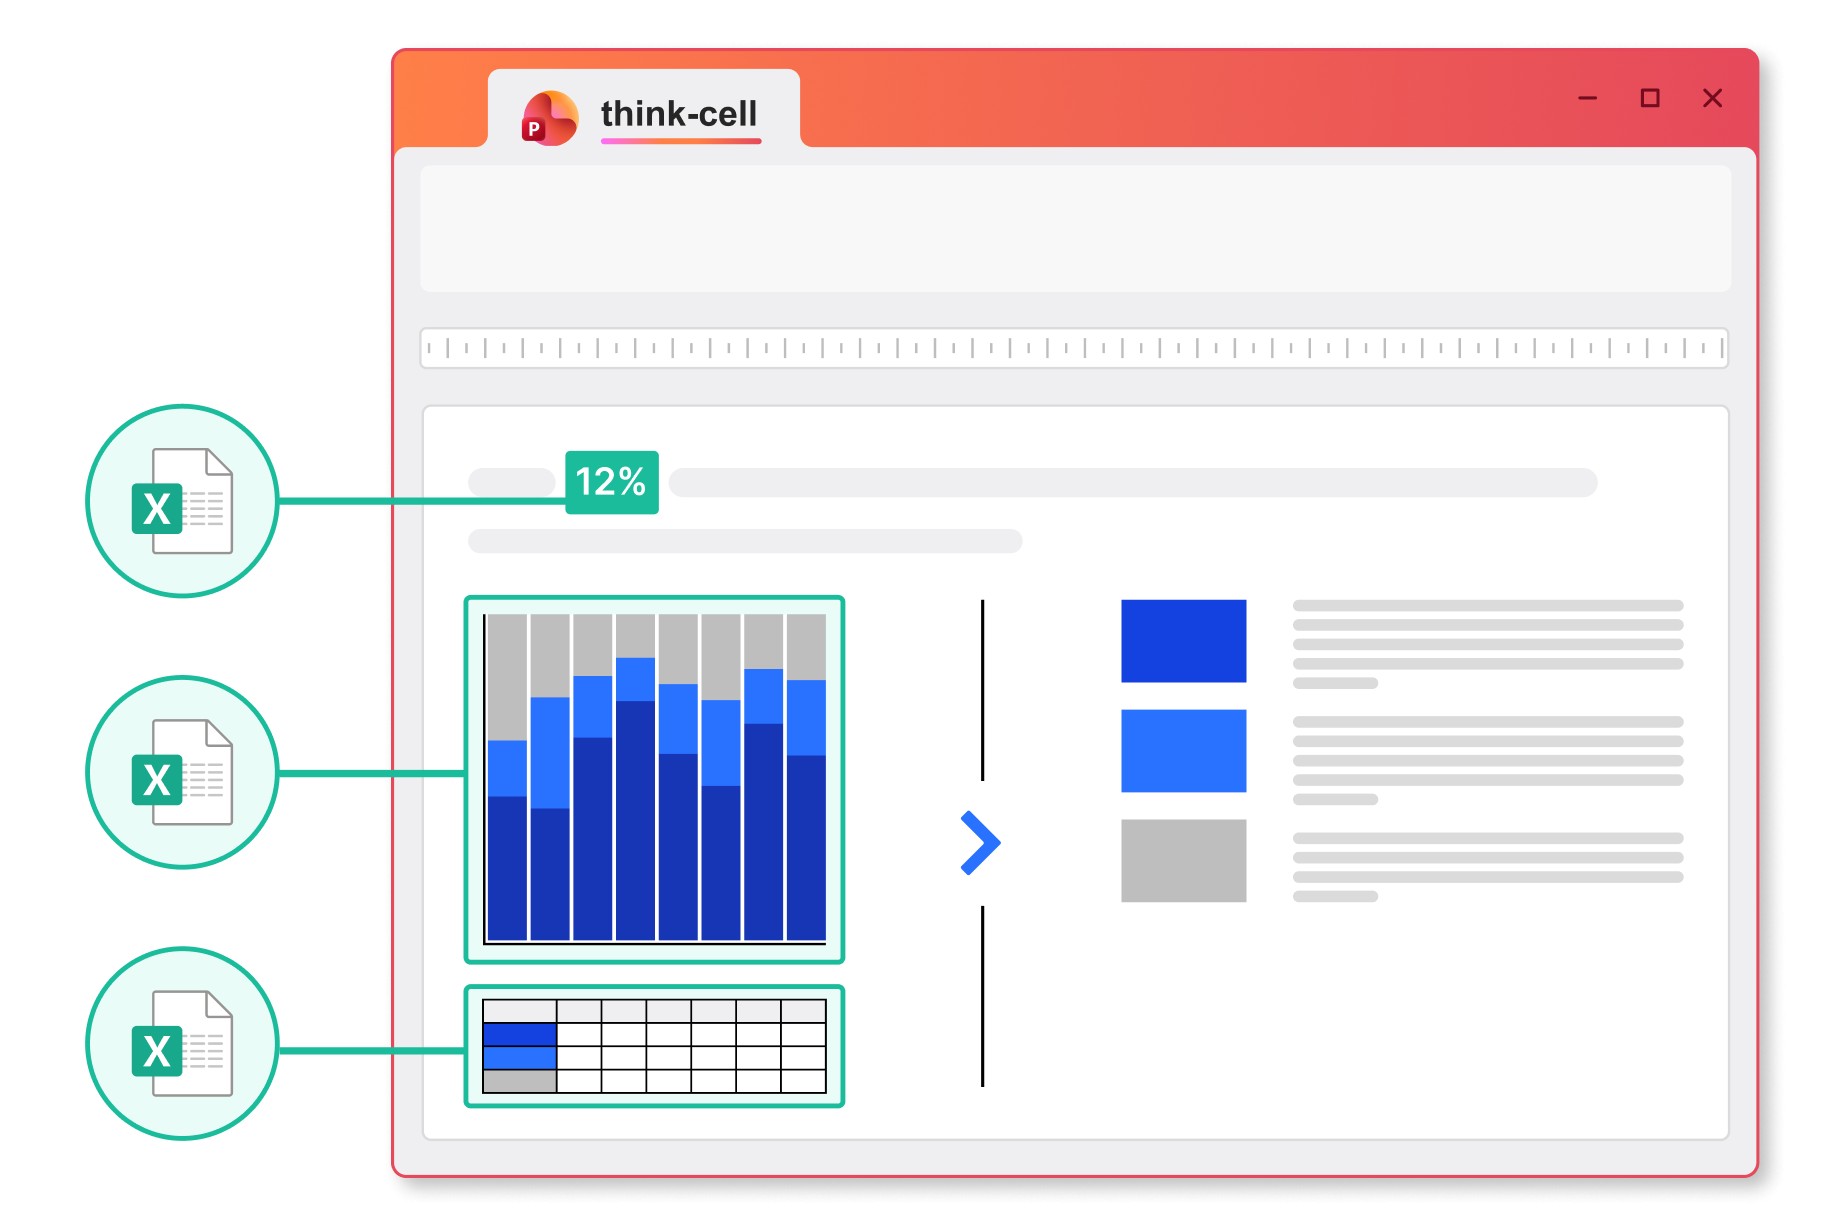
Link and manage data from any source to automate your Gantt charts
Advanced users can link to Tableau or use think-cell’s API to populate templates with charts, tables, text boxes, or in-line data fields.

Connect charts and tables to Tableau. Easily integrate data from your online dashboards.

Link individual elements or entire presentation templates via API. Works with any source that supports JSON exports.

Highlight all the data links on a slide. Set update scope to objects, slides or entire presentations.