Export
Export your Statista data to Excel
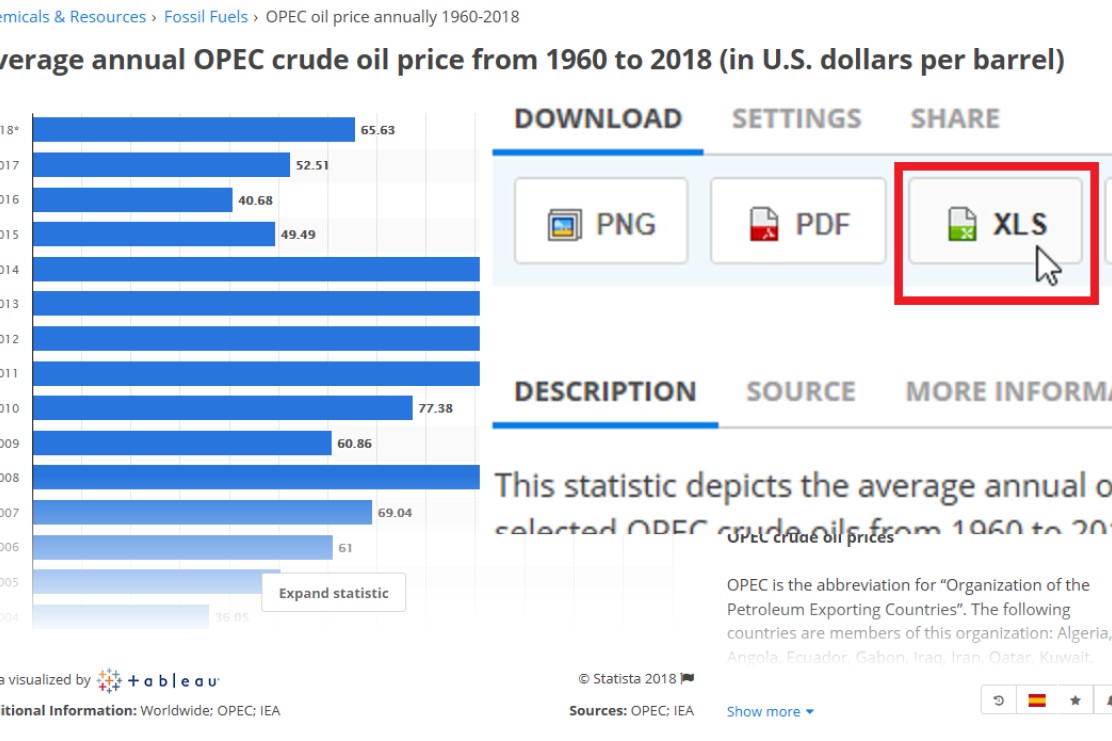
On the Statista web site you can find a button to the right of each chart. You can use this button to export the chart's data to Excel (XLS) and download a corresponding file.
Format
Format your Excel data to match think-cell's data format
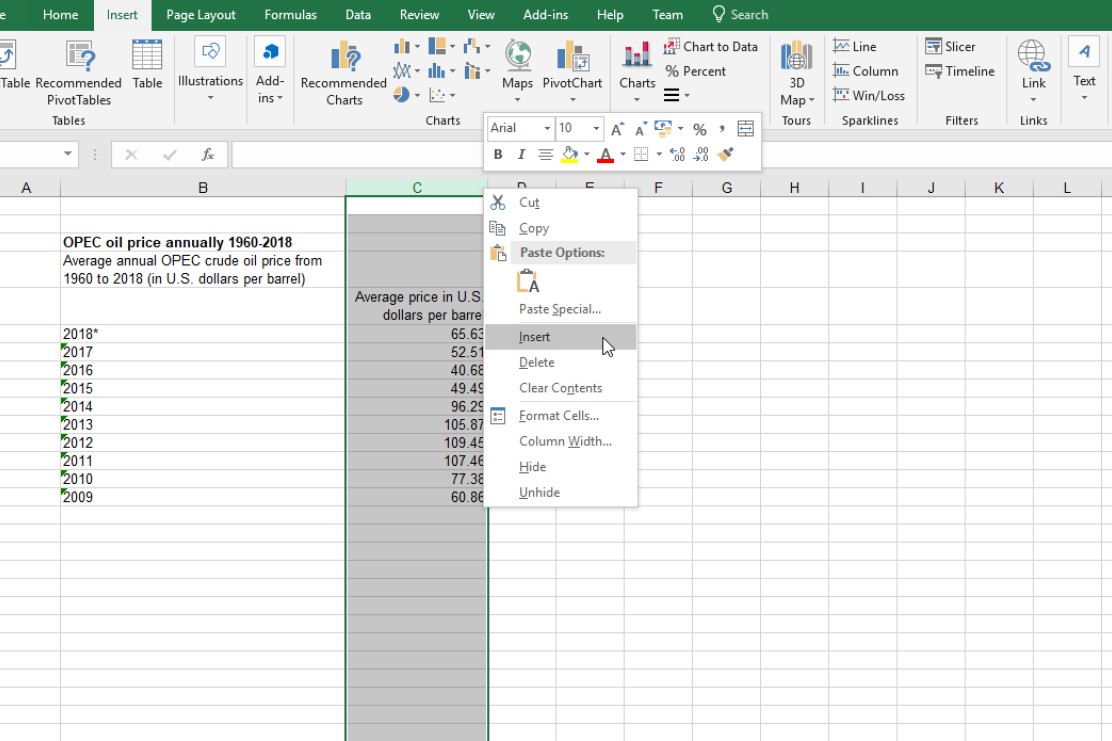
Insert an extra column between the category labels and the first data column. Values in this column are used by think-cell to compute absolute values from percentages. You can safely leave it empty.
Select
Select the data for your chart
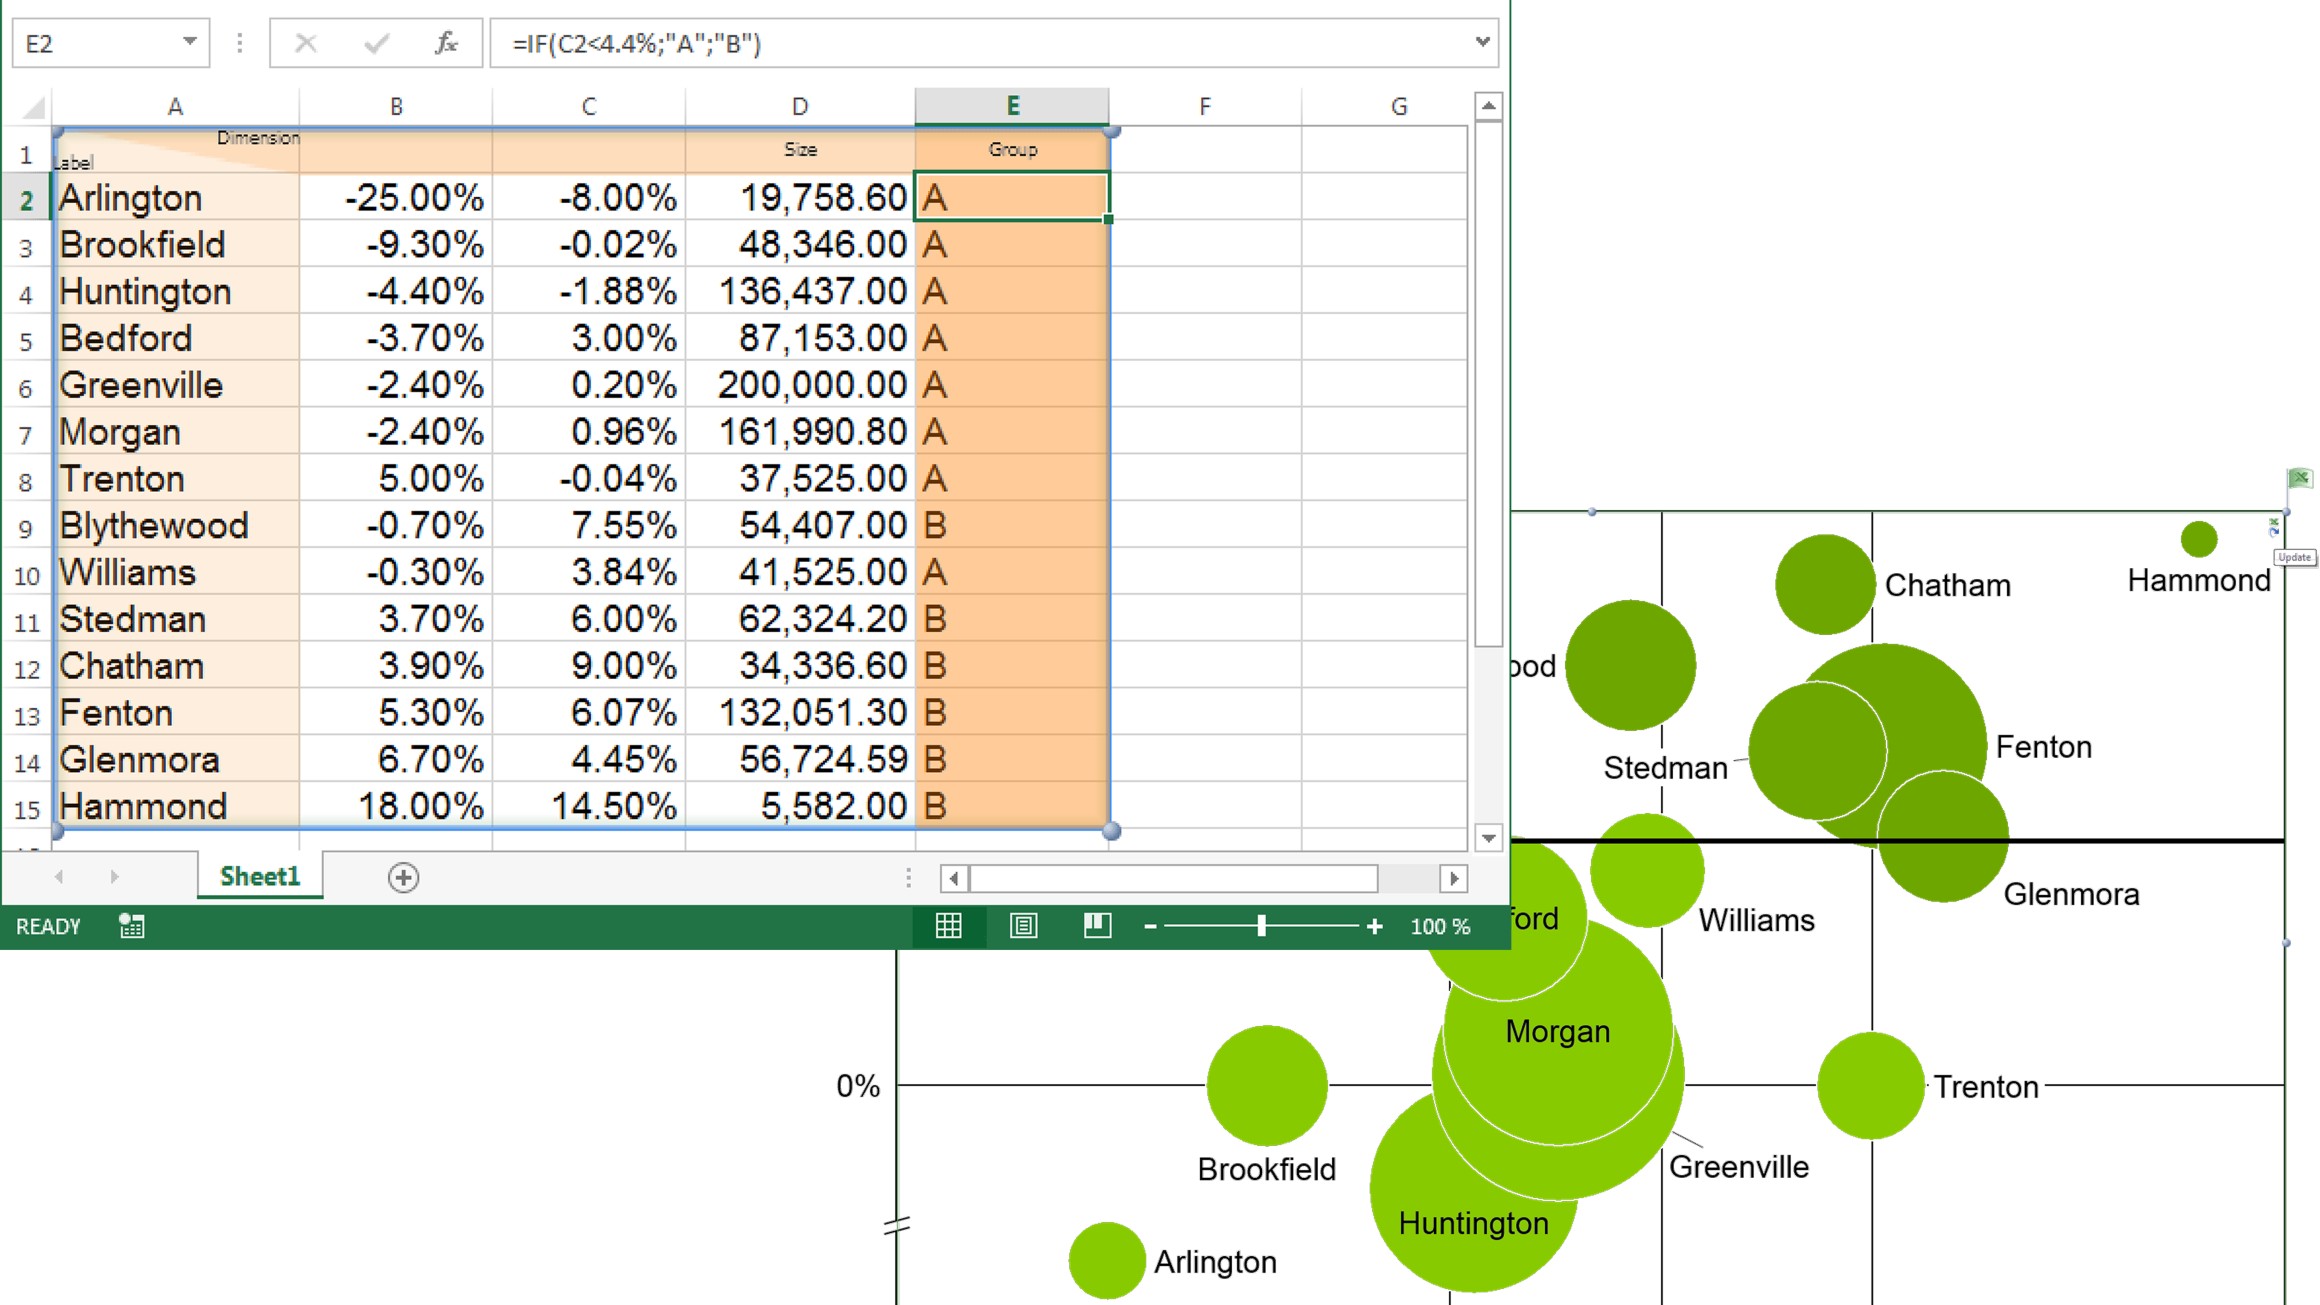
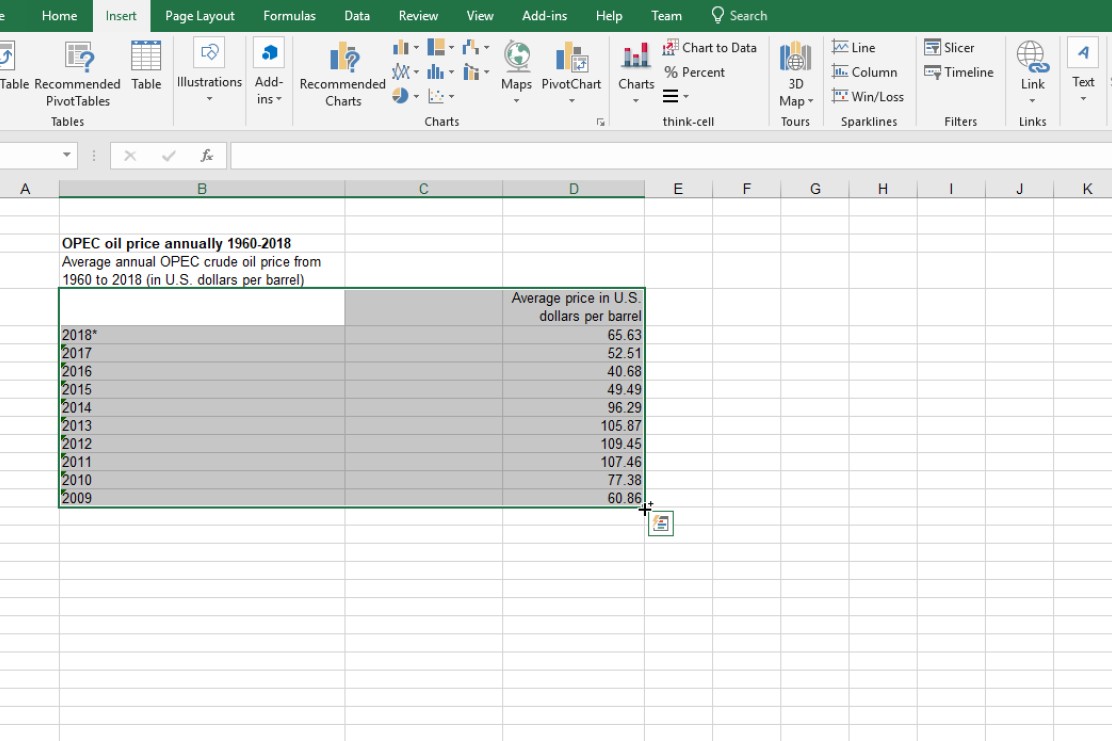
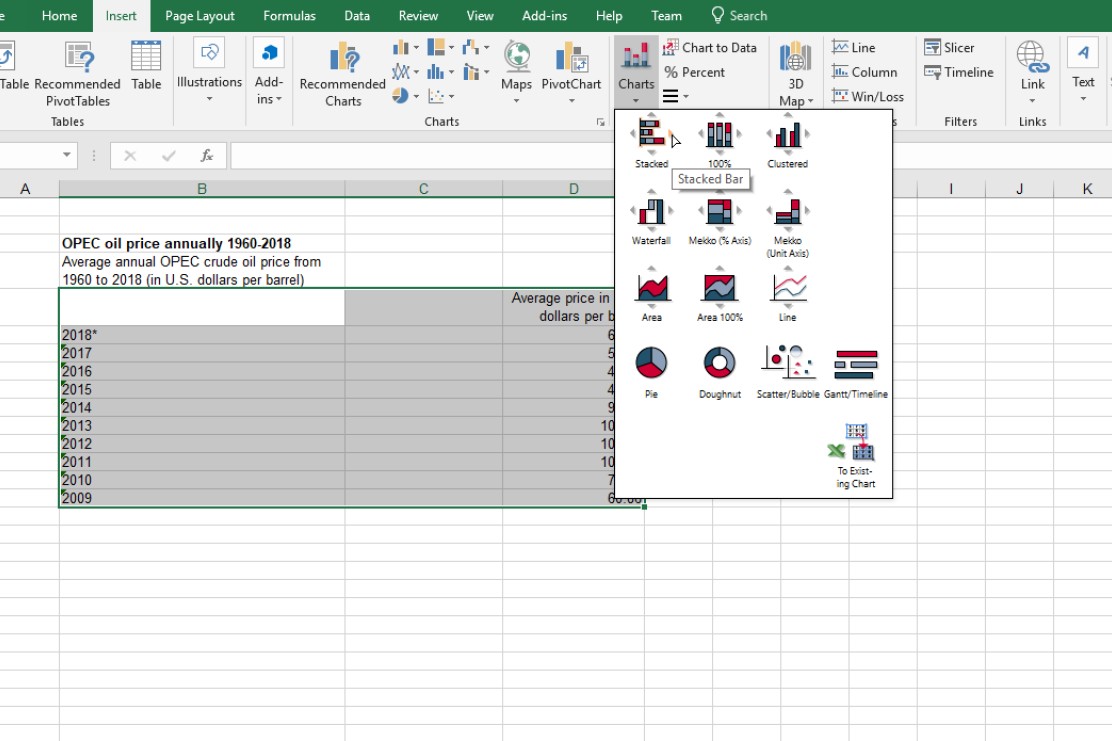
Simply select the Excel data range for the new chart, including category and series labels.
Insert
Insert your think-cell chart into PowerPoint
In Excel’s Insert tab, click the button "Charts" in the think-cell ribbon group. Data exported from Statista has the structure for a bar chart. Therefore, use the arrow to the right of the "Stacked" icon to create a stacked bar chart. Later, you can freely rotate the chart in PowerPoint.
Highlight
Further highlight your message
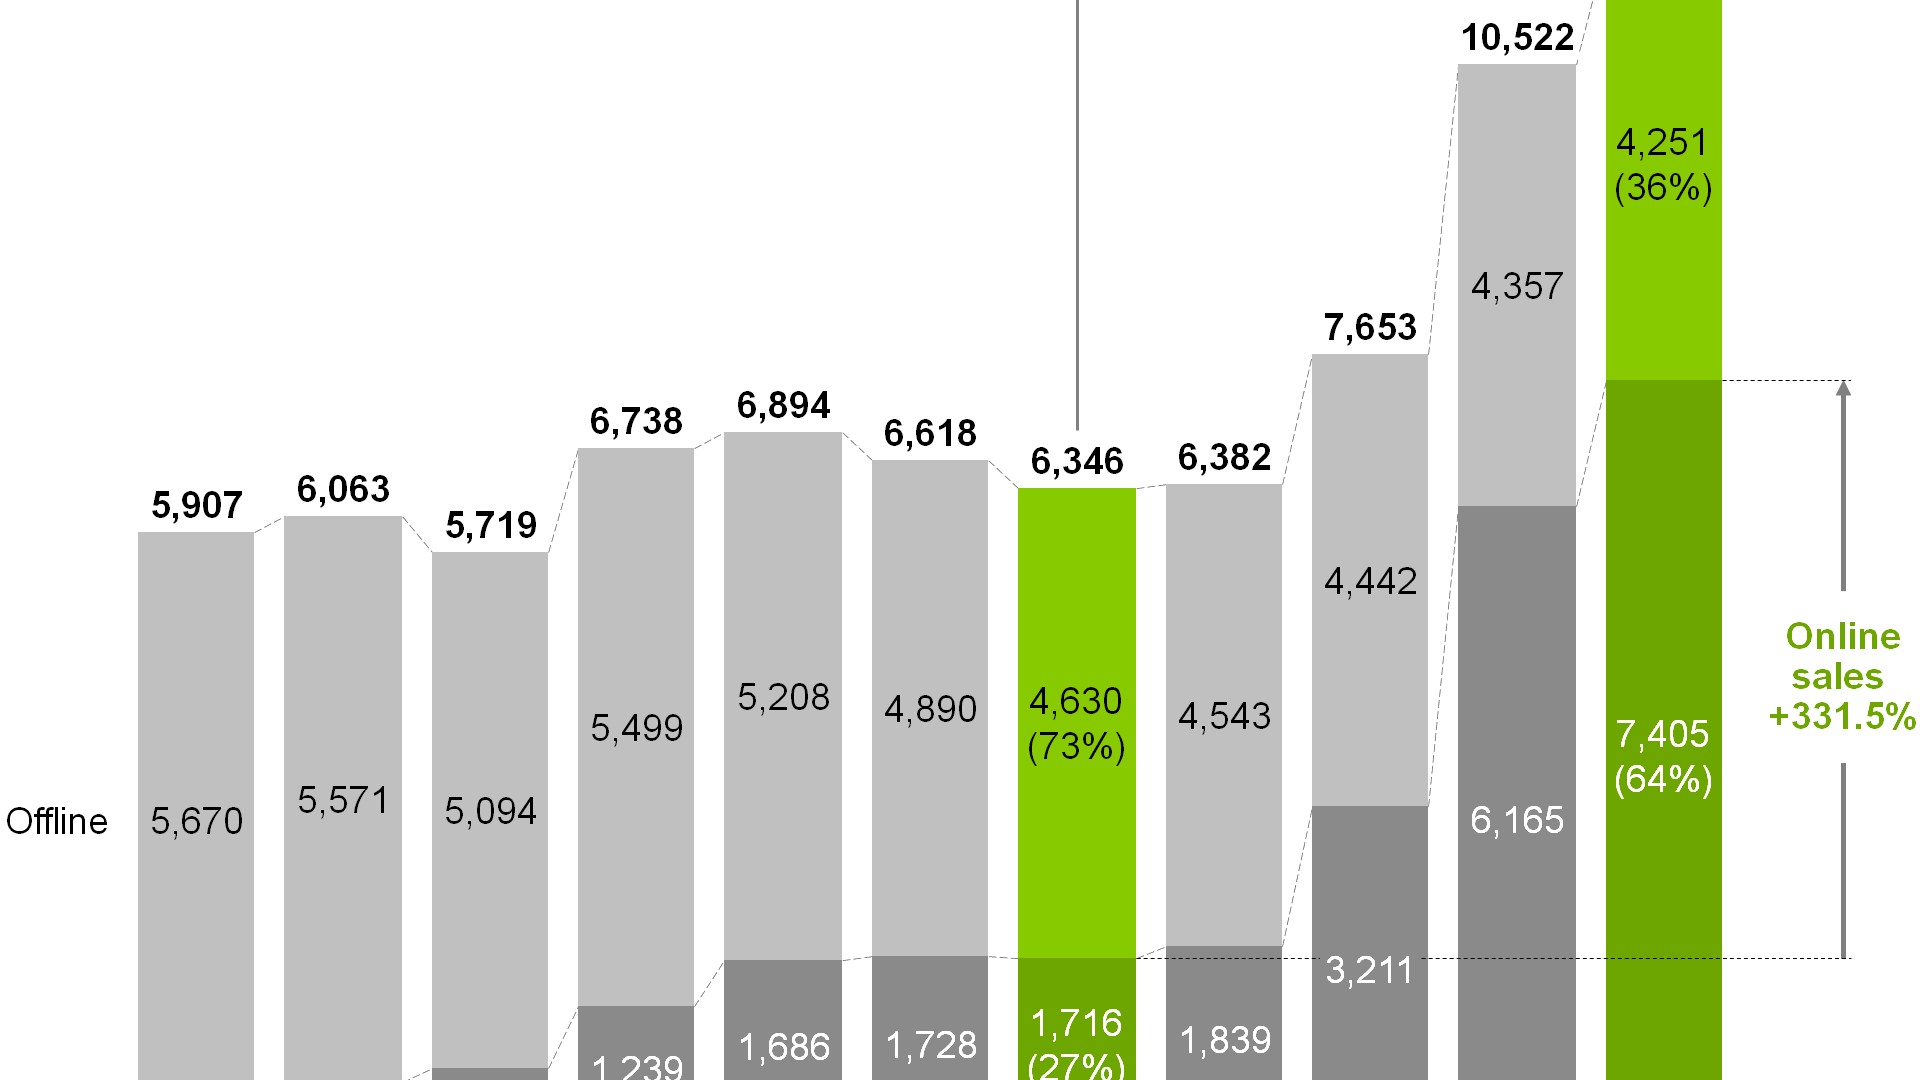
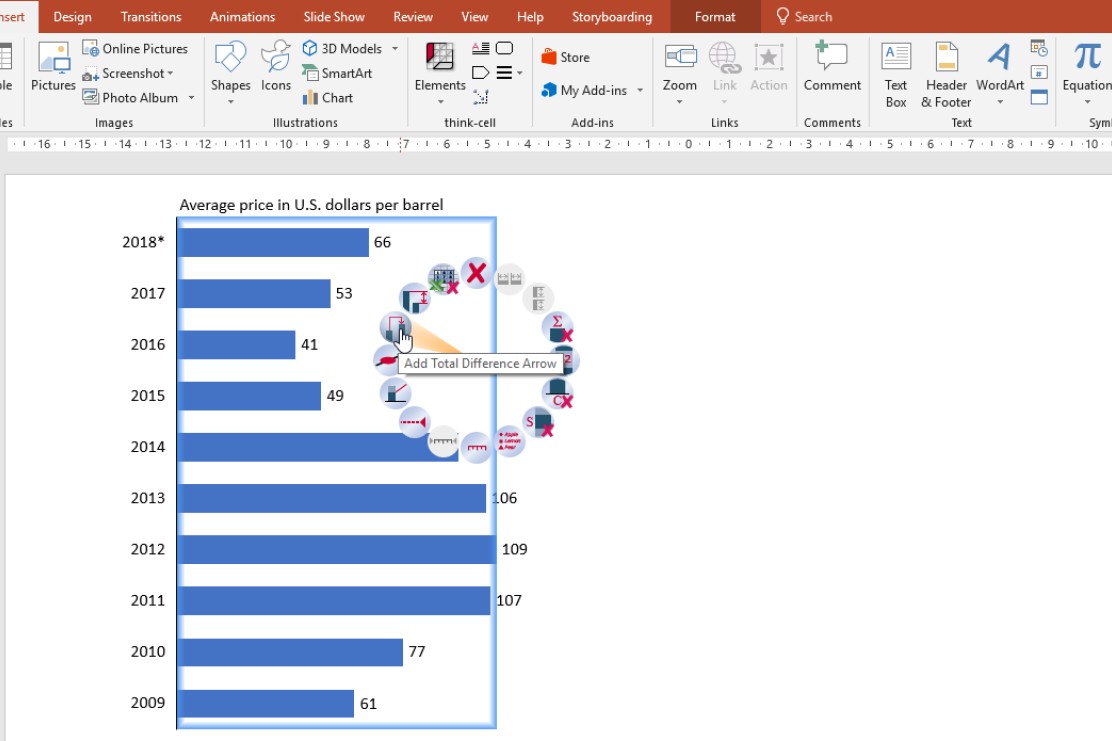
That’s it. The new think-cell chart is created in PowerPoint. You can now use think-cell’s powerful features to highlight your chart's message, e.g., by adding difference arrows, axes or value lines.
