Create better presentations, faster
Stop spending hours on slides that should take minutes. think-cell works inside PowerPoint and handles the layout, the formatting, charts, and data updates.
- 40+ chart types, to turn any data into a powerful narrative
- 250+ professional slide templates, so you never start from a blank slide.
- Your Excel data, always in sync with your slides.

think-cell in numbers
end users worldwide
customers
Fortune 100 companies
3 tools that make PowerPoint actually work for you.
Pick a chart type, enter your data, or link it to Excel and you are done. Labels, spacing, and layout adjust automatically. Change a number and the chart updates itself.

Use a ready-made template, find a company slide, or search millions of images and icons. The Library puts everything in one place, right inside PowerPoint.
Align elements in one click. Update fonts across your whole deck at once. Keep agenda slides in sync automatically. Share slides without worrying about sensitive data.
Get started with think-cell
- Create professional charts and data-driven tables.
- Deliver impactful presentations faster.
- Try for free, no credit card required and no cancellation necessary.
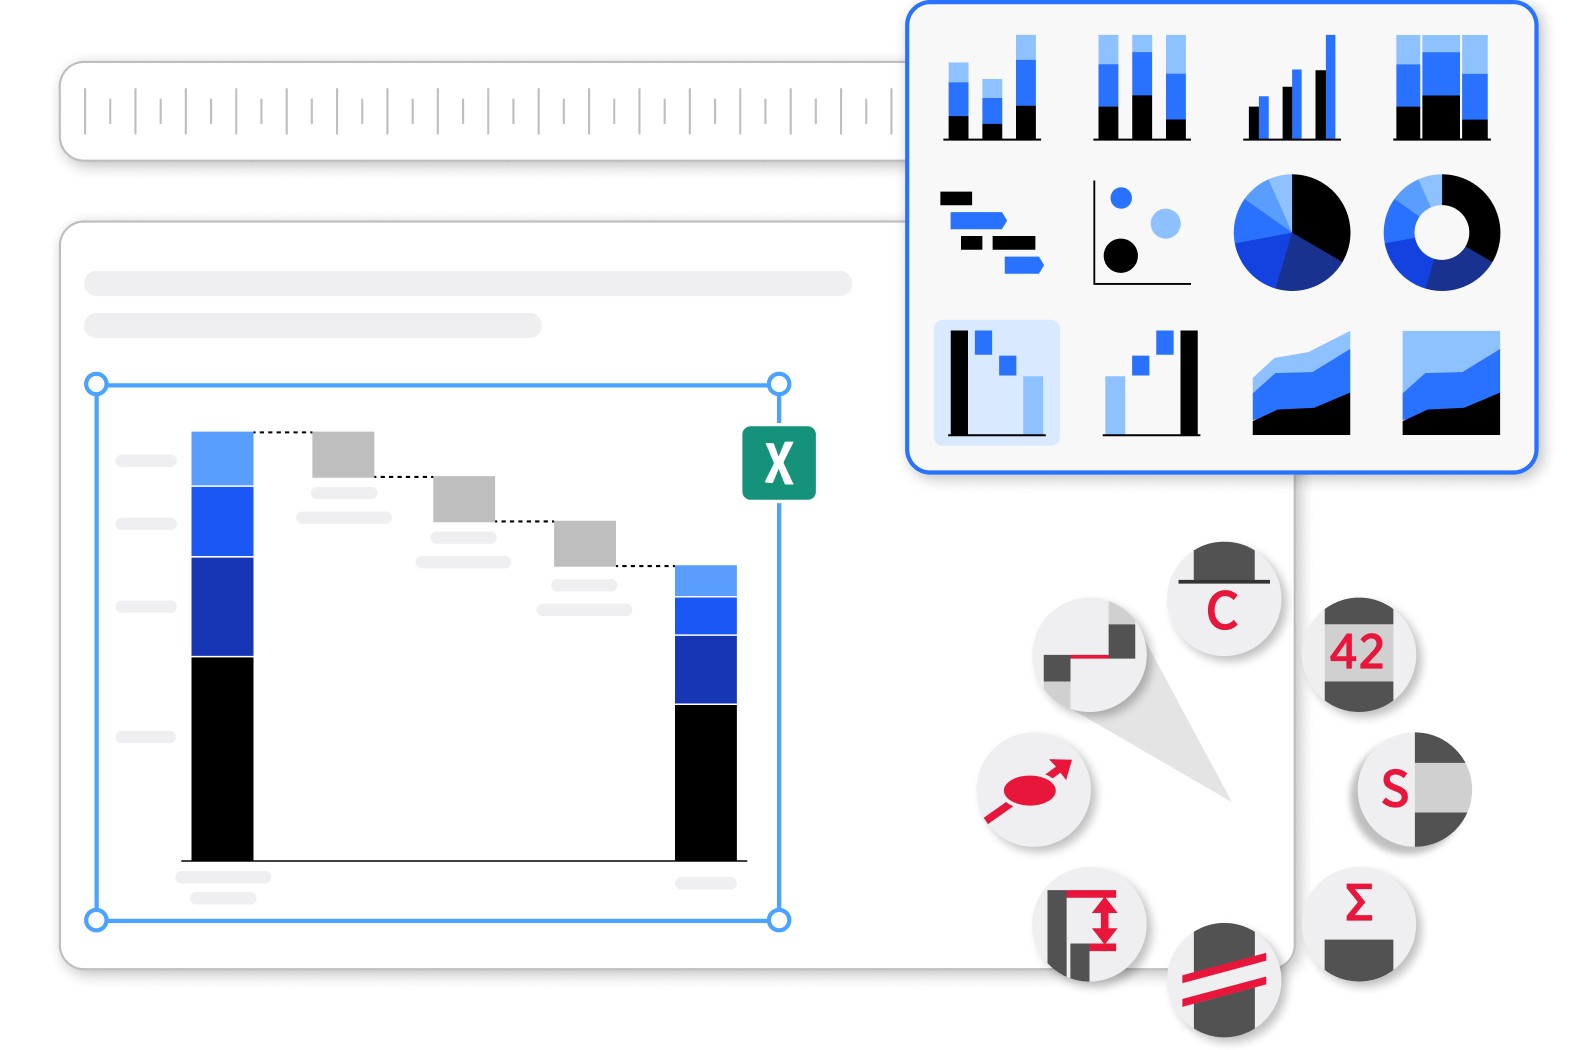
40+ charts to transform any data into business insights
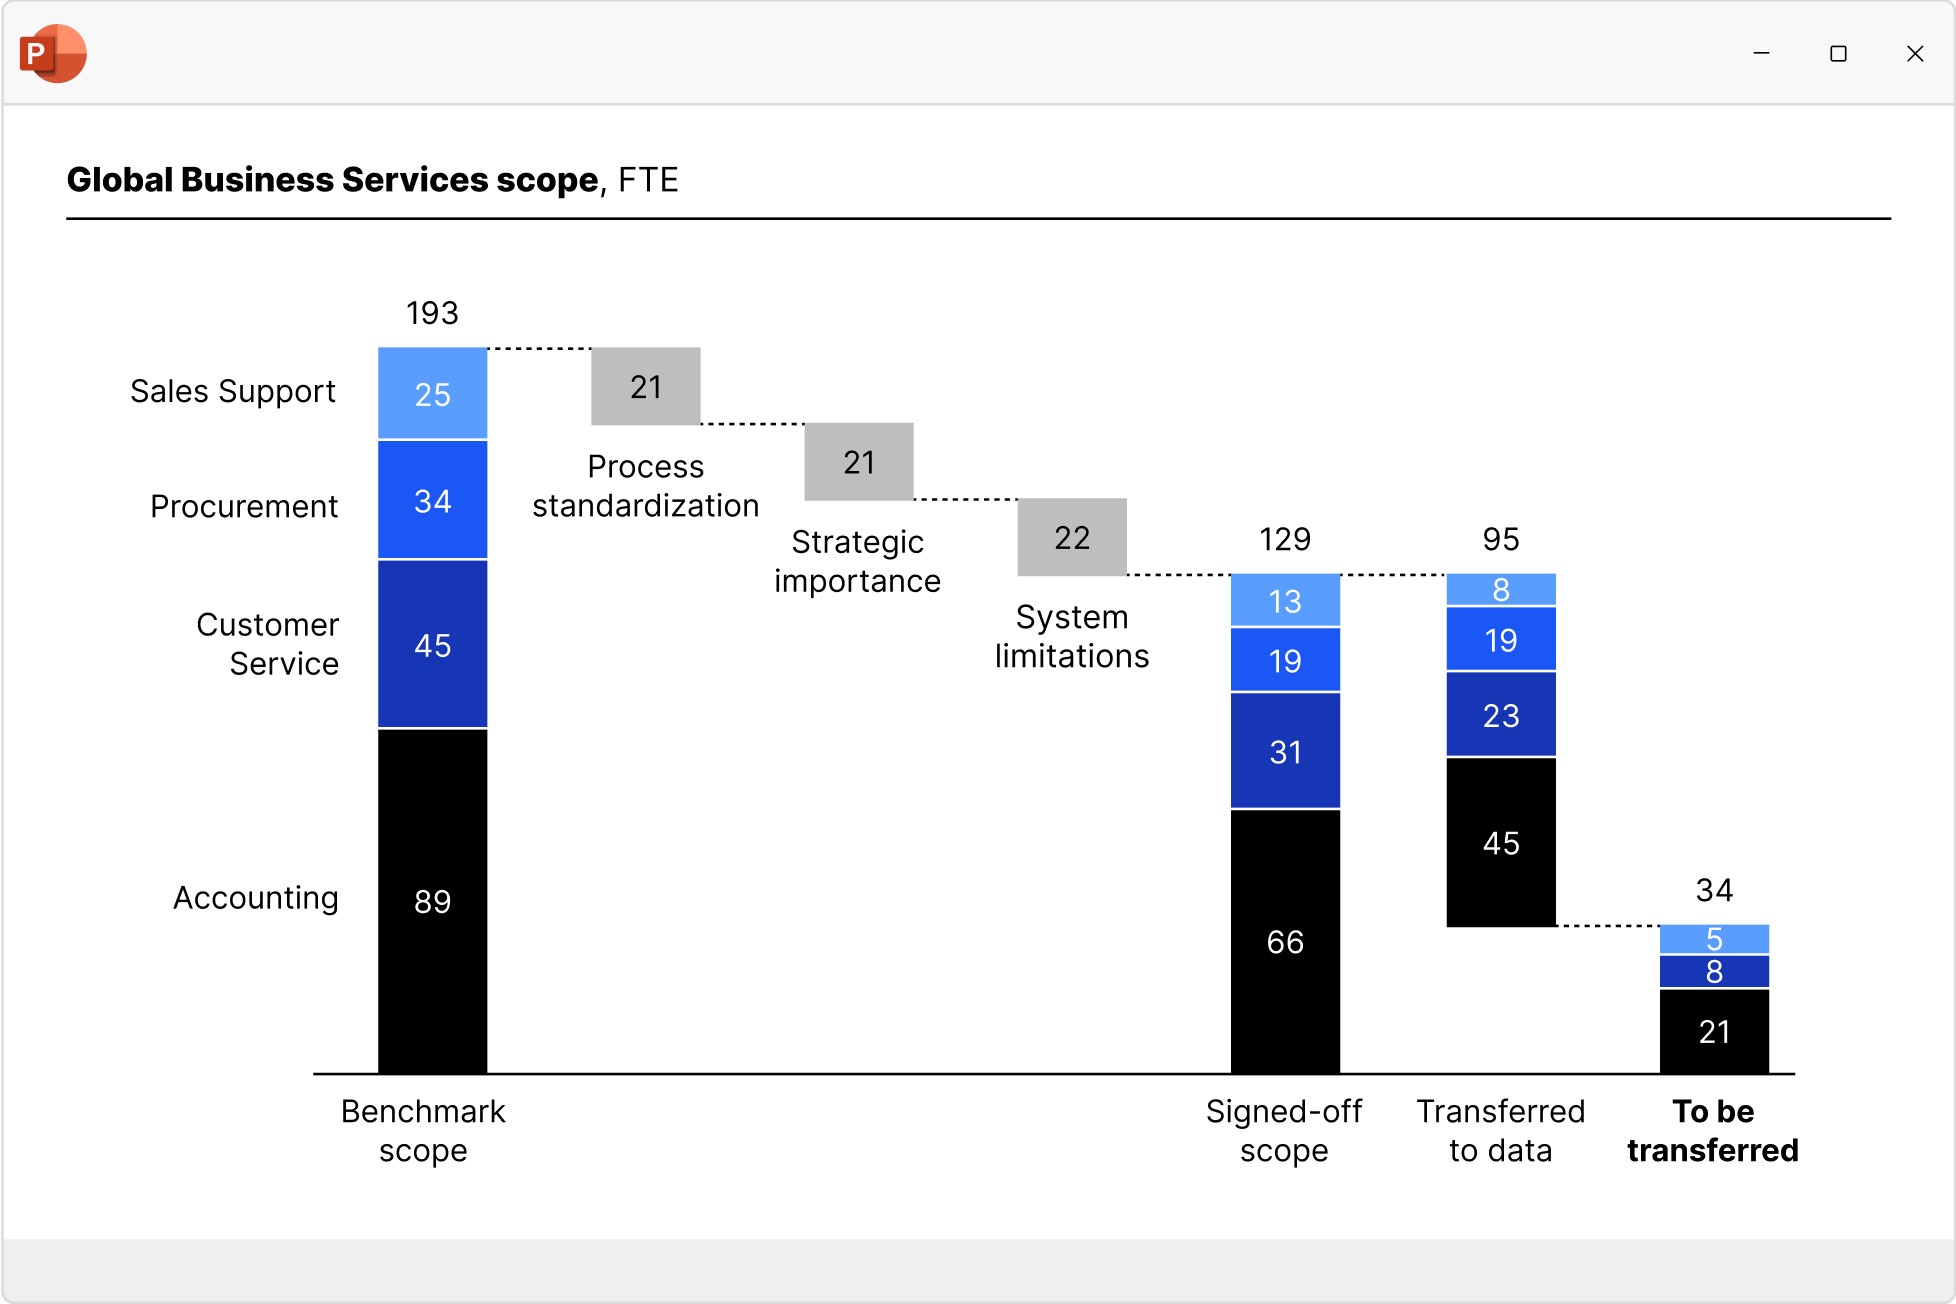
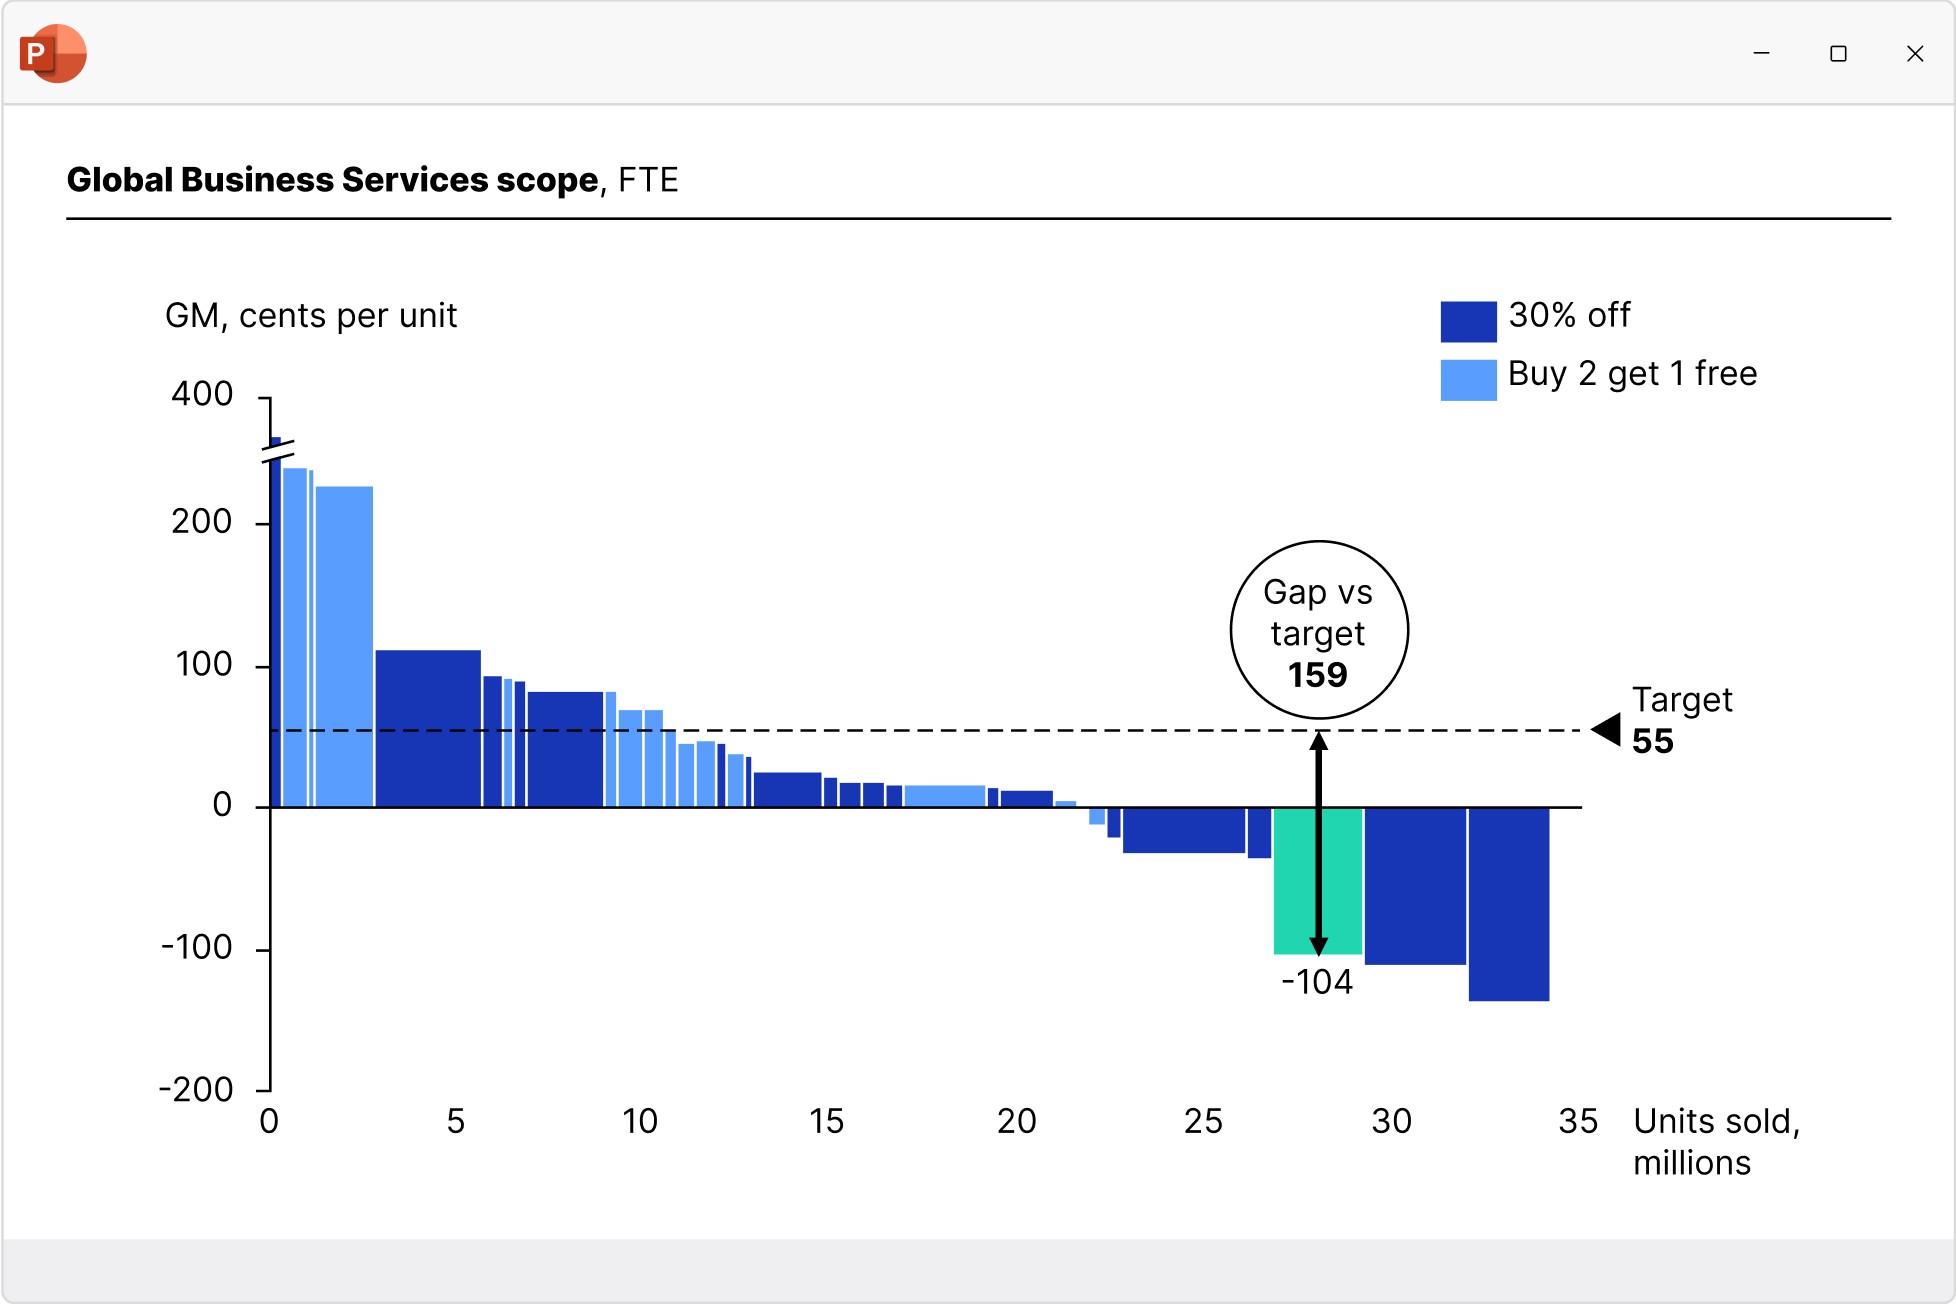
Waterfall charts
Create waterfall charts to show how different drivers contribute to an overall change. Industry standard for EBITDA bridge and P&L statements.
- Display multiple series with stacked segments.
- Include totals and subtotals that calculate automatically.
- Add segments that cross below the baseline.
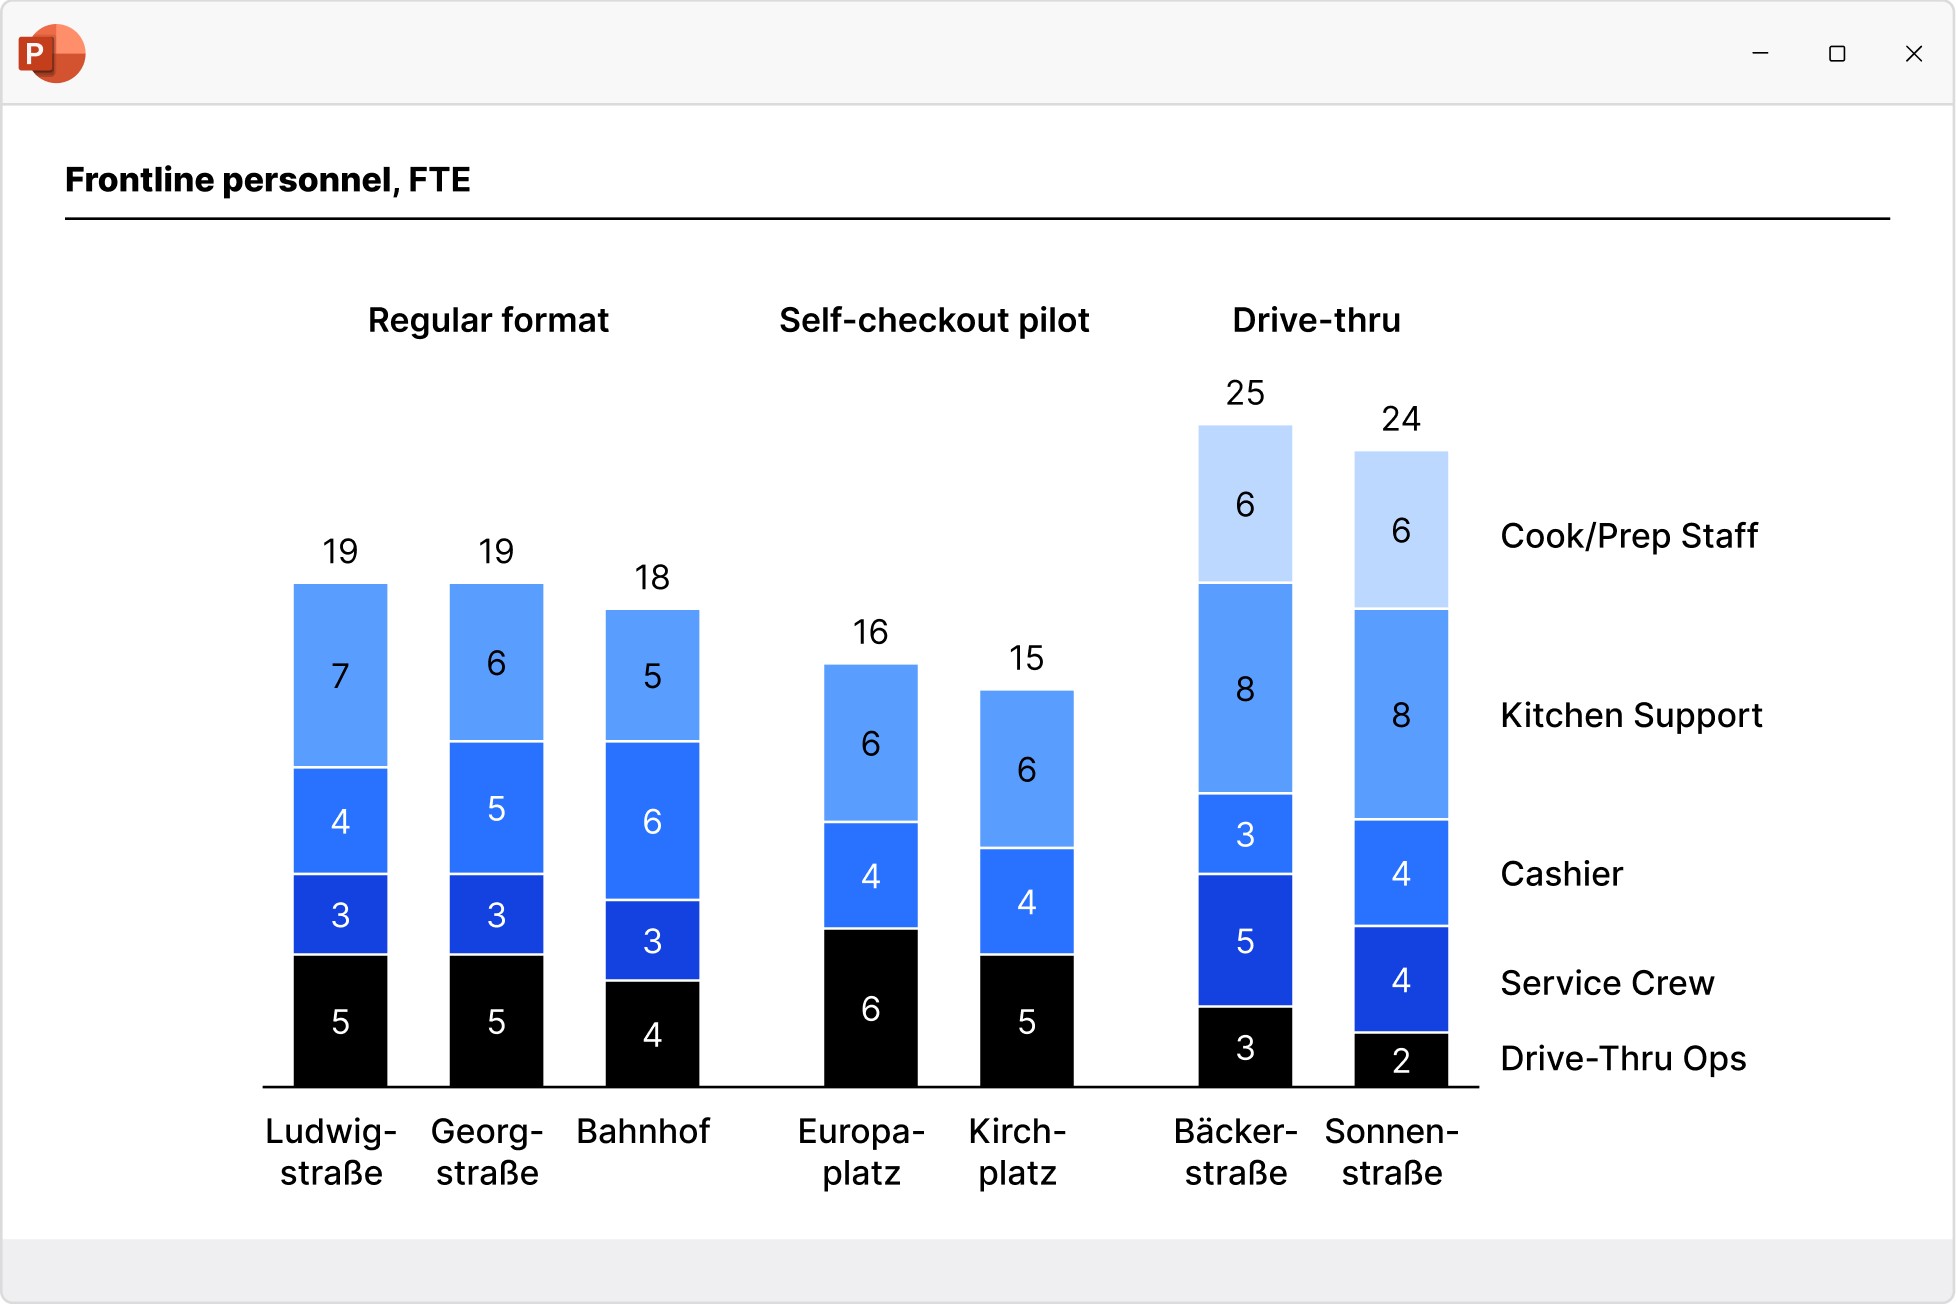
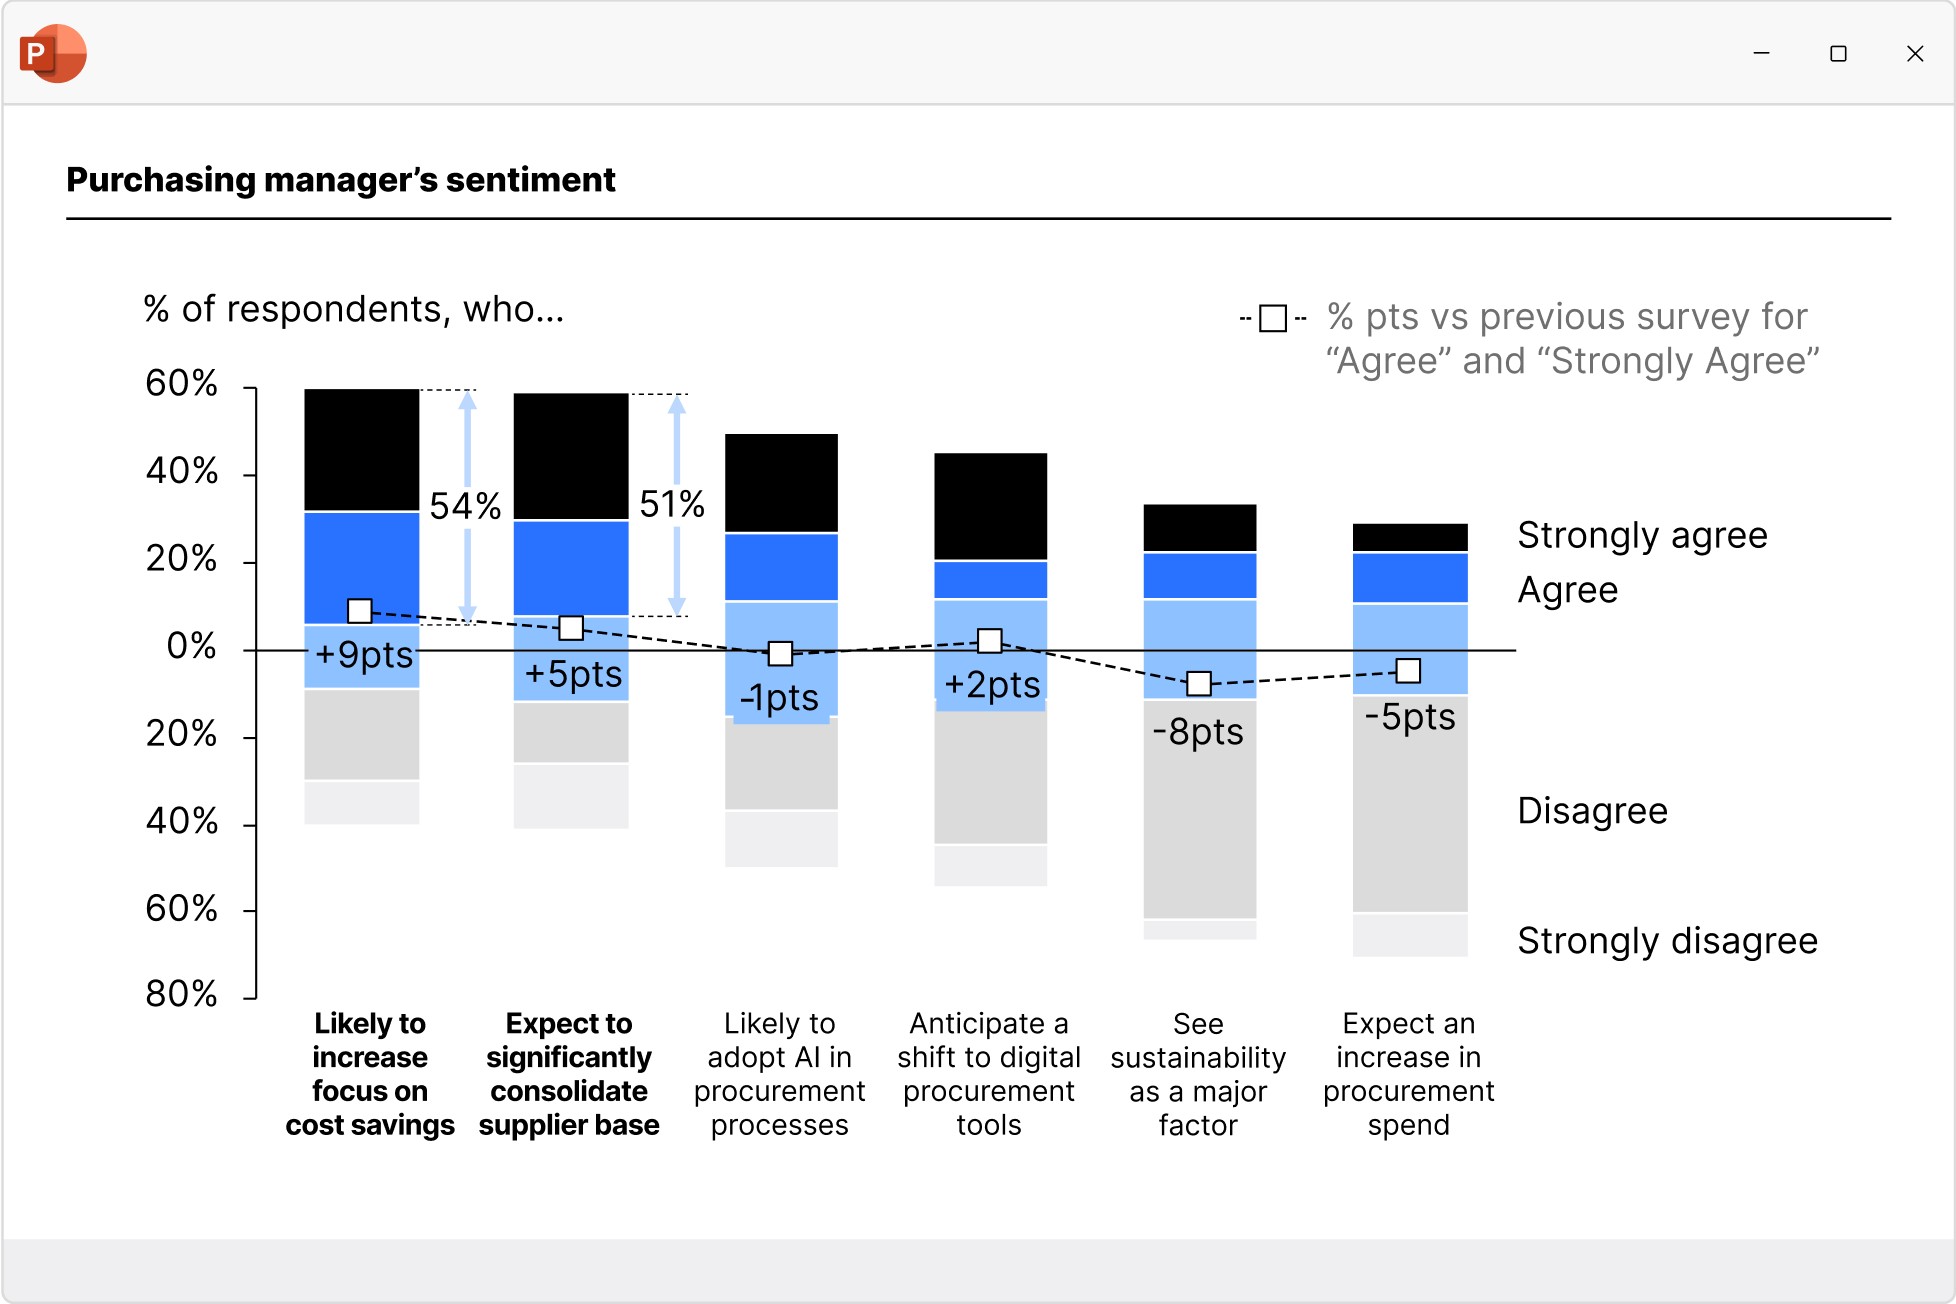
Column and bar charts
Use column and bar charts to present your data in a clear, digestible form anyone can recognize. Easily modified to create butterfly/tornado charts.
- Choose from stacked, clustered and 100% charts.
- Insert axis breaks to make best use of the slide space.
- Extract a series and show it perfectly aligned in an accompanying data table.
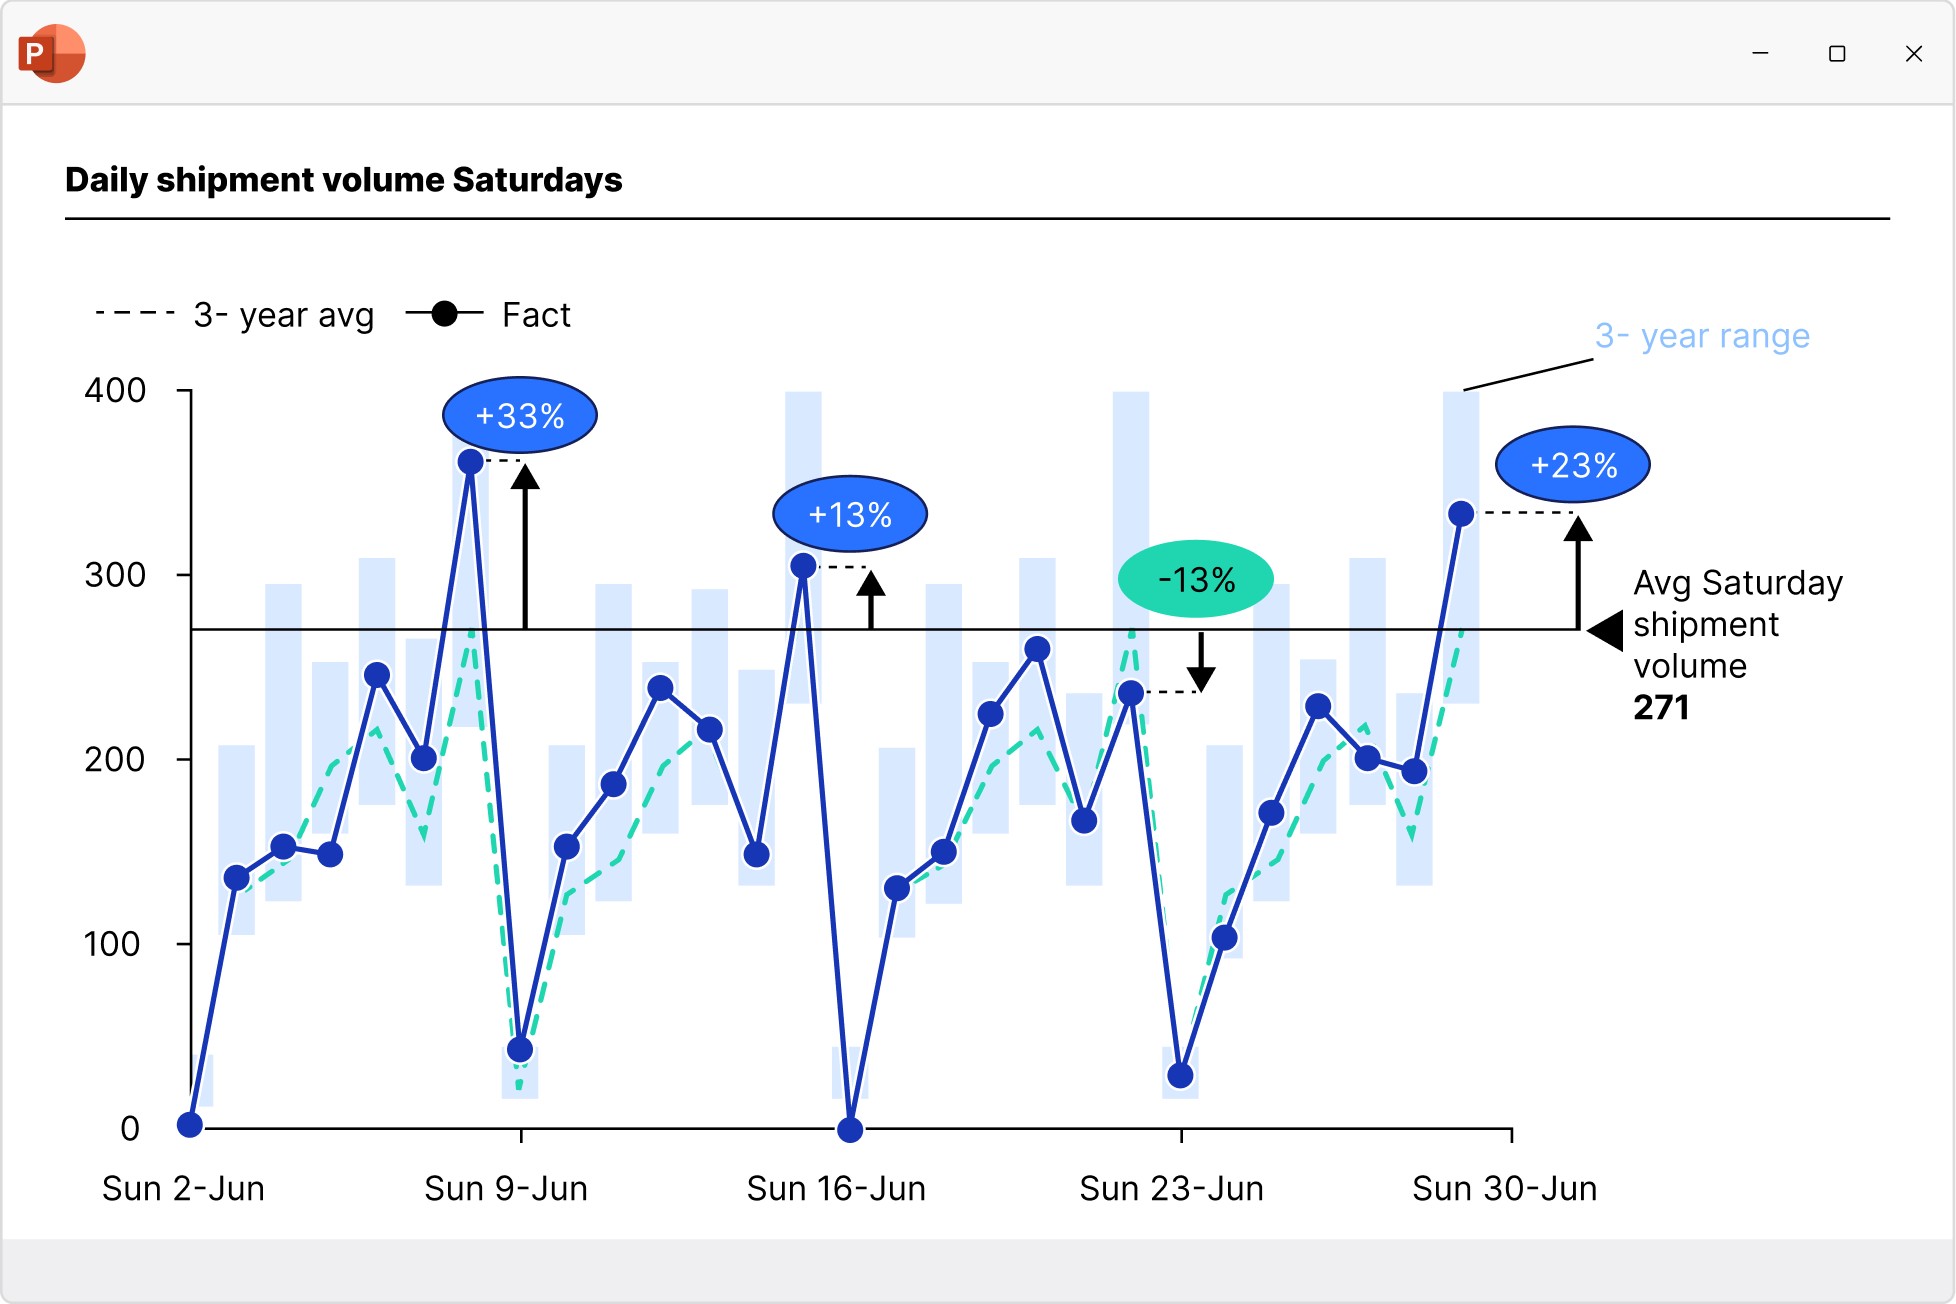
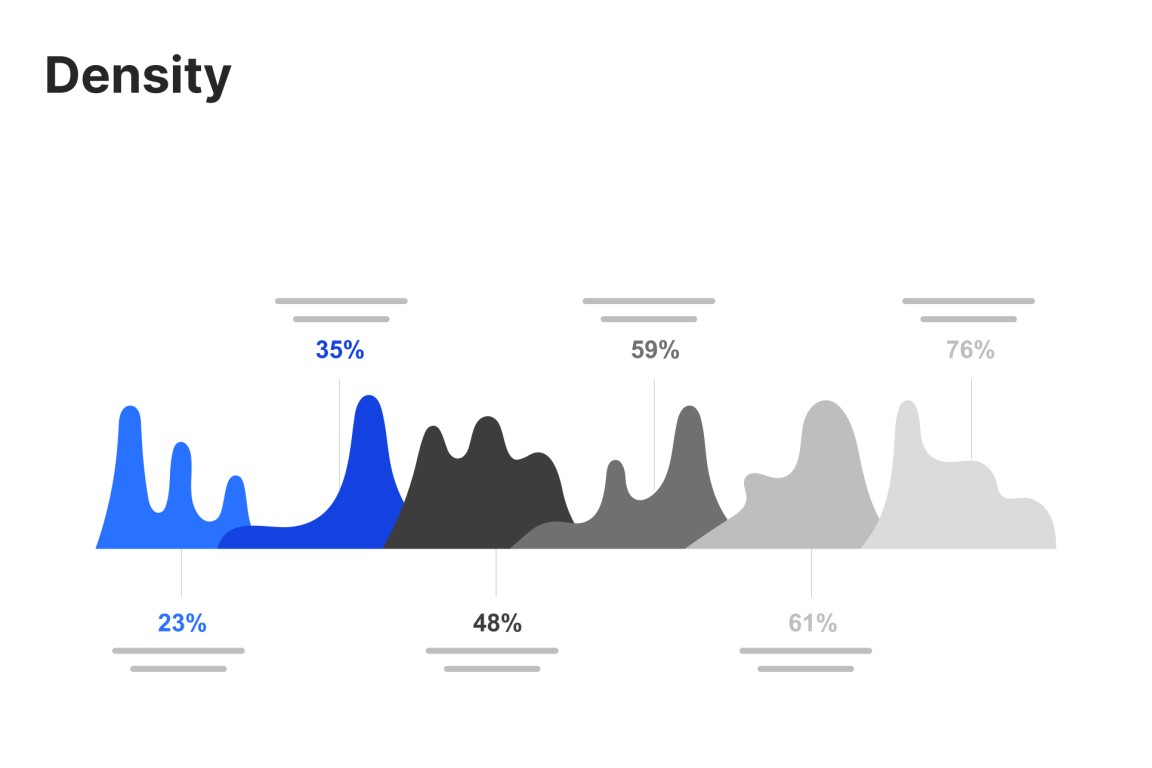
Line and area charts
Build line, area, and area 100% charts to communicate data trends over time. Versatile use as candlestick charts for stock prices or football field charts.
- Add a secondary value axis to better compare metrics.
- Add linear interpolation for any missing values.
- Use error bars to show confidence intervals.
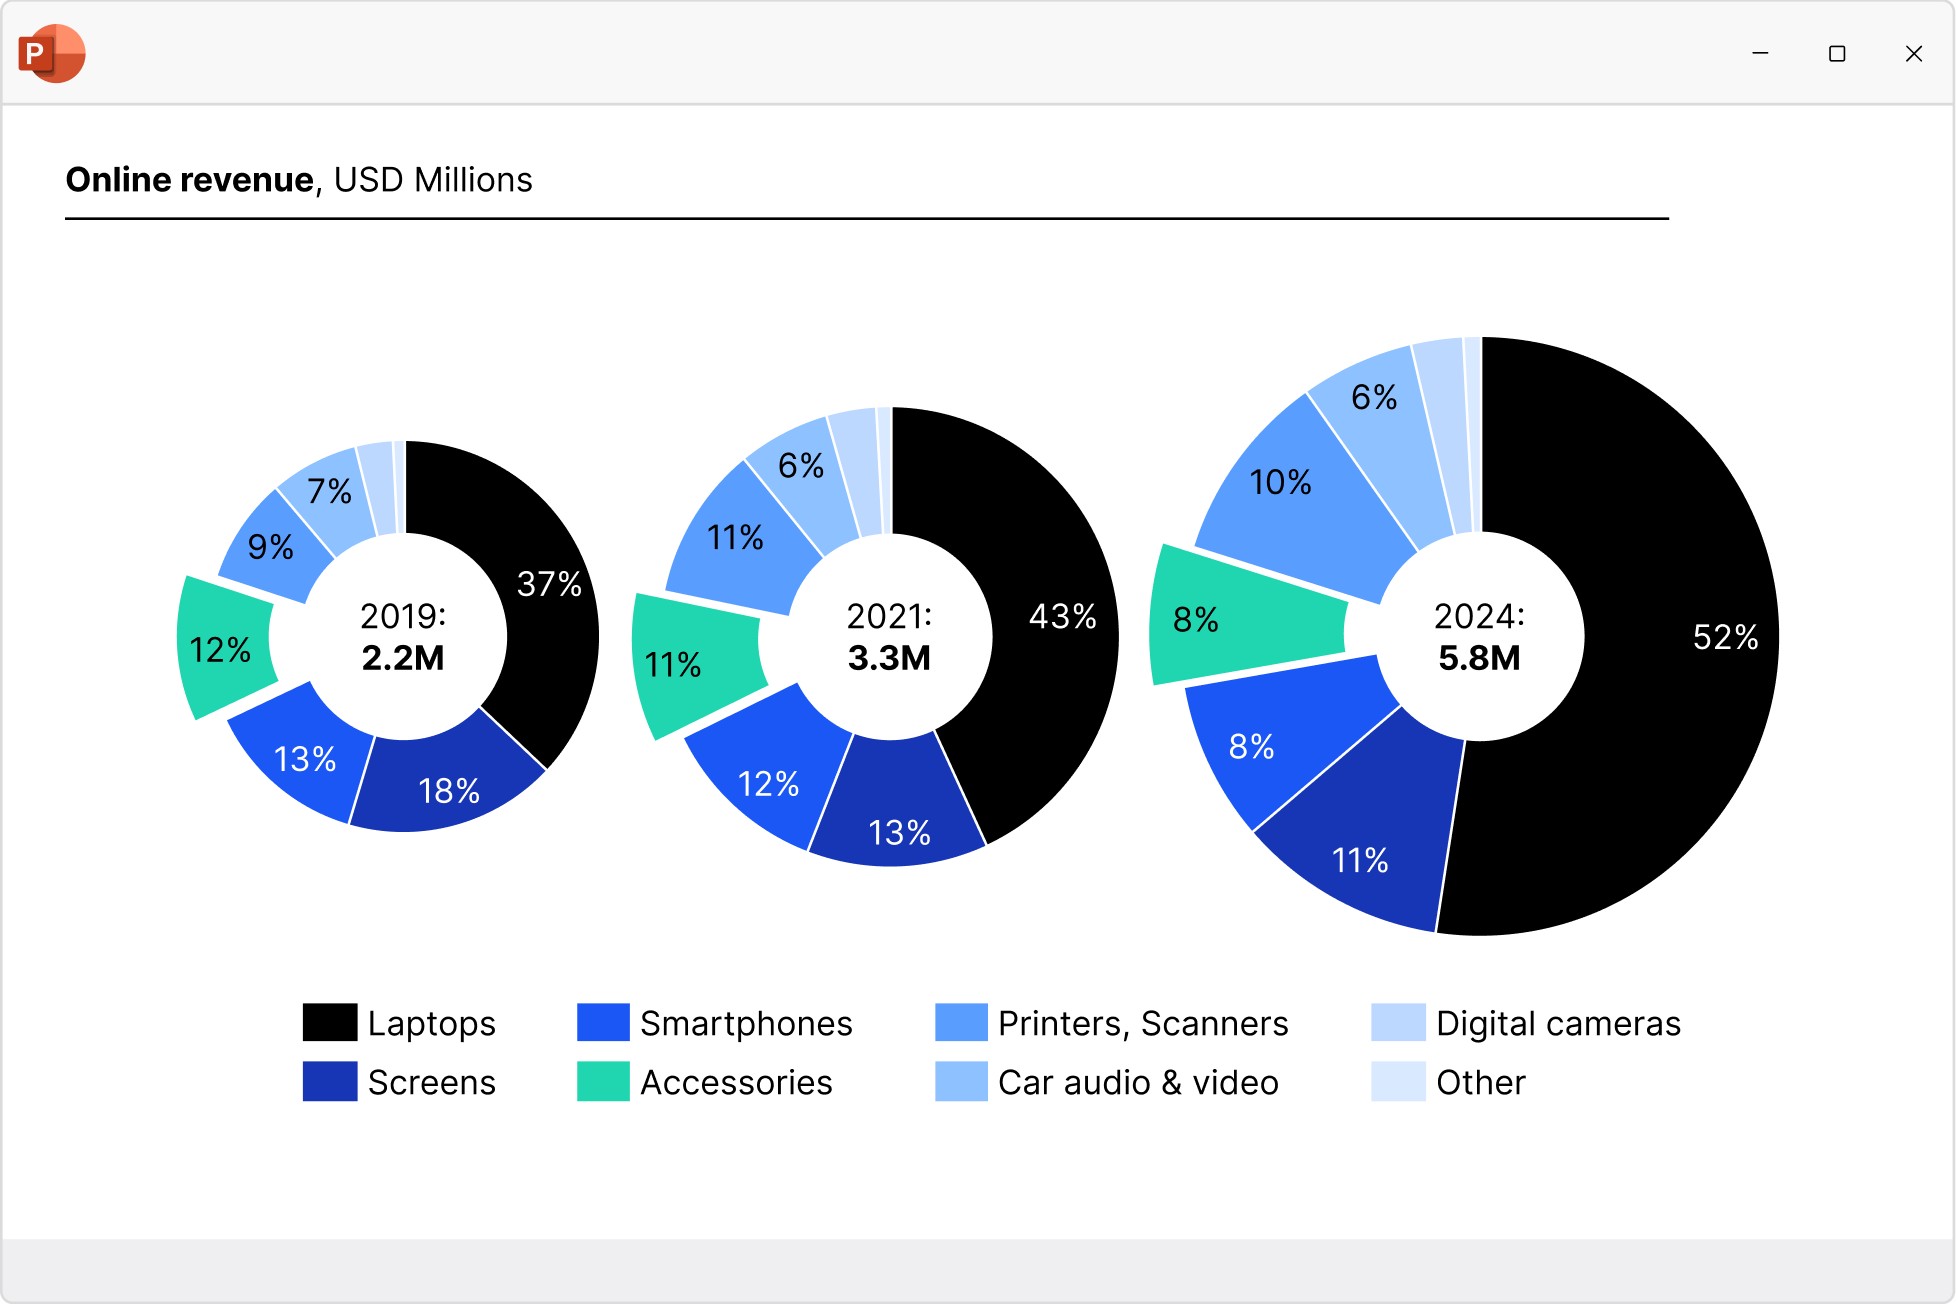
Pie and doughnut charts
Start building faster with the perfect foundation for your business presentations.
- Quickly access all your favorite slides, images and presentation resources.
- Draw on over 250 business templates so you never start from a blank slide.
- Find exactly what you need with slide-level search and powerful filters.
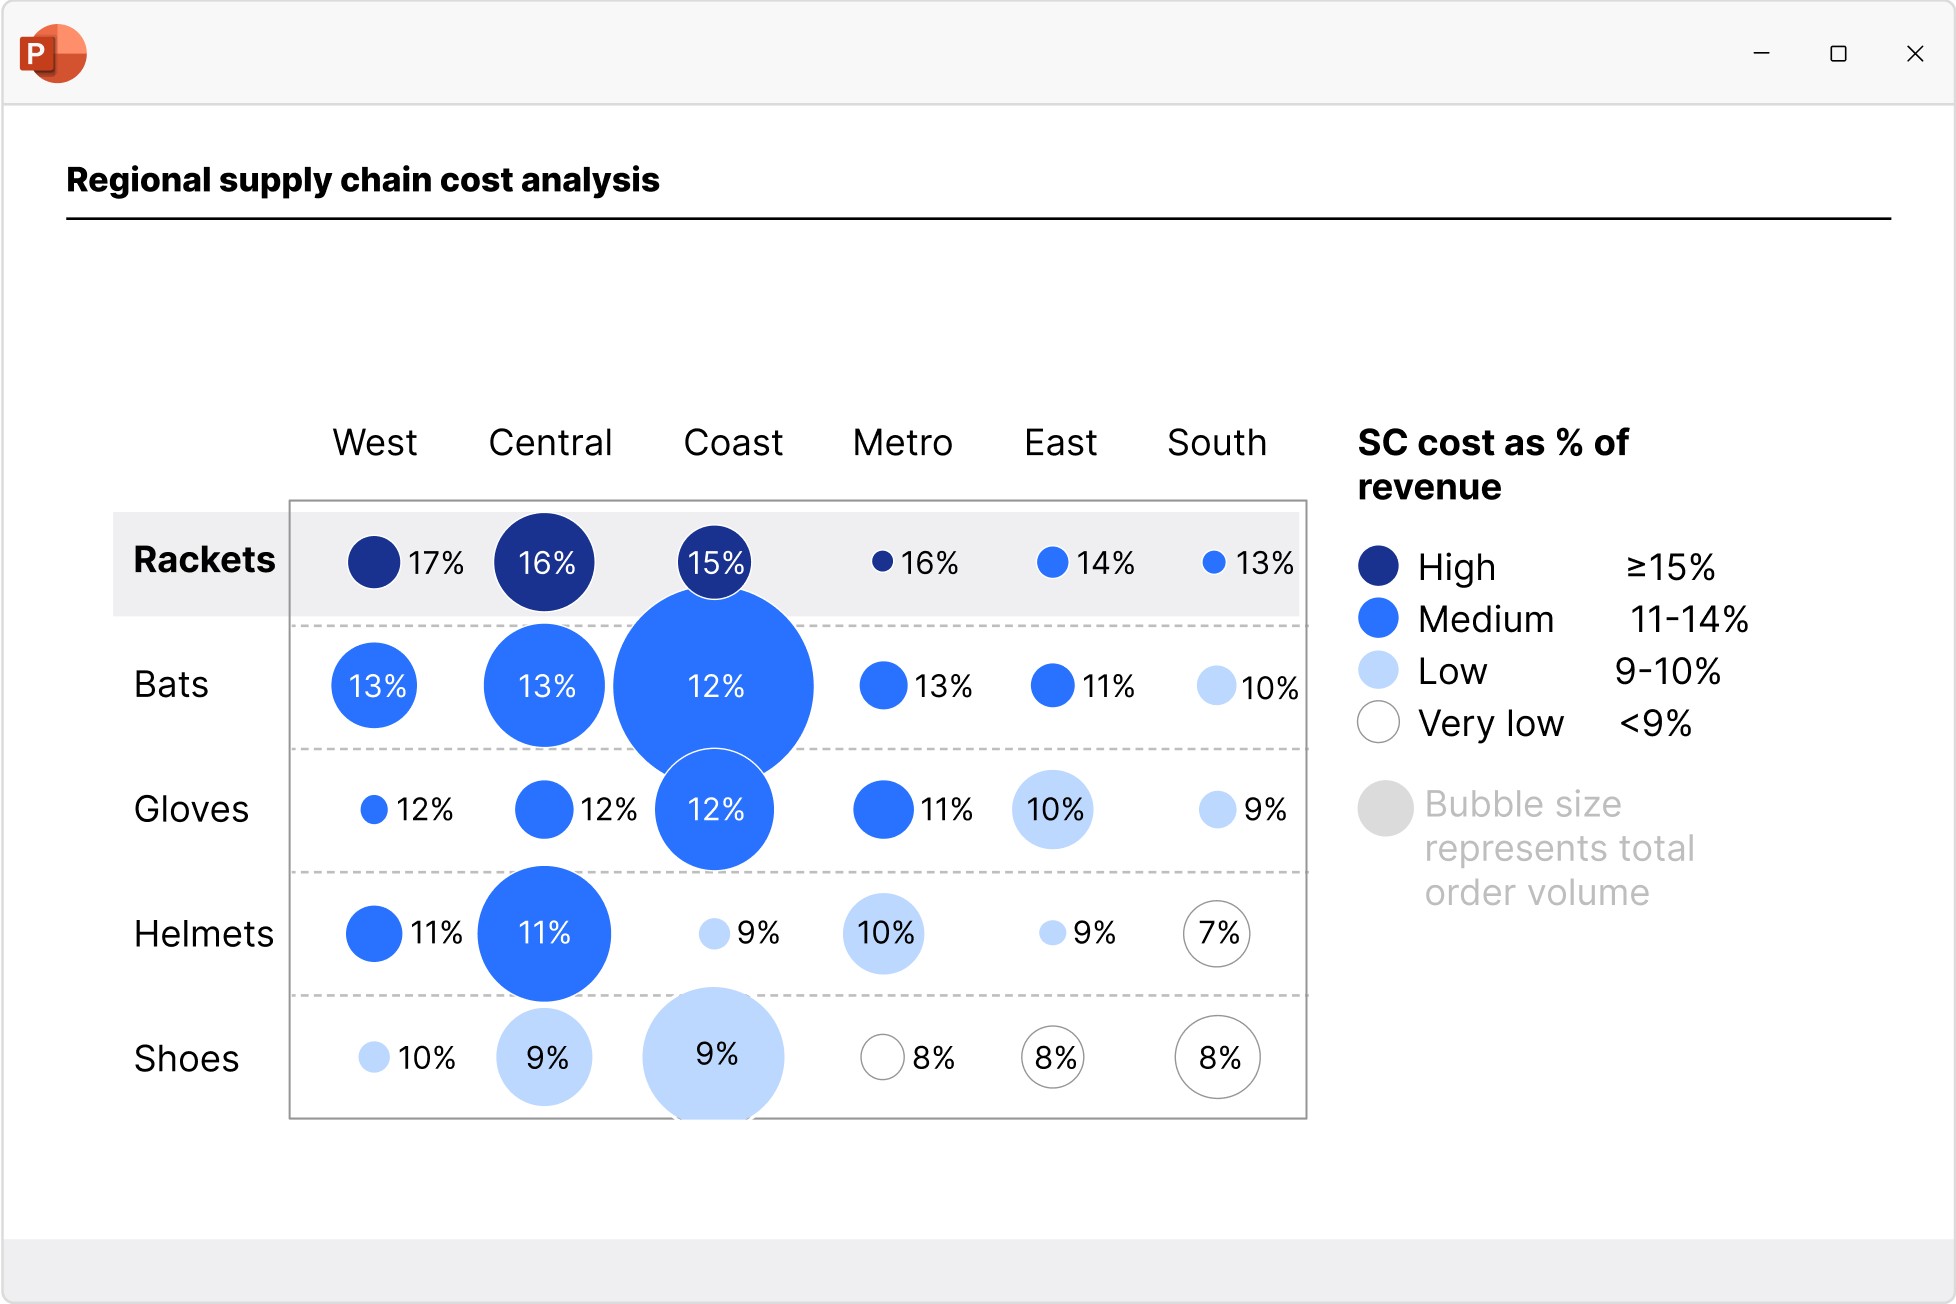
Scatter and bubble charts
Create scatter and bubble charts to show the relationship between two variables, reveal patterns in categorized data, and uncover outliers.
- Ensure maximum readability with automated point labels.
- Use bubble sizes and group colors to communicate more information.
- Shade or color partitions to highlight segments in scenarios, heat maps, etc.
Mekko charts
Build Mekko charts to show data in two dimensions, using column width for total category sizes and height for proportions. Ideal for market shares.
- Choose from unit axis or percentage axis.
- Avoid manual workarounds as column widths are calculated automatically.
- Combine smaller segments to ‘Other’ to reduce noise.
Combination charts
Create combination charts to show trends and relationships between data series, bringing column/bar and line charts together in a single visualization.
- Use one or two axes and set each series flexibly to be displayed as a column/bar or line.
- Display series as net lines to represent targets or benchmark values.
- Sort columns in descending order to create insightful Pareto charts.
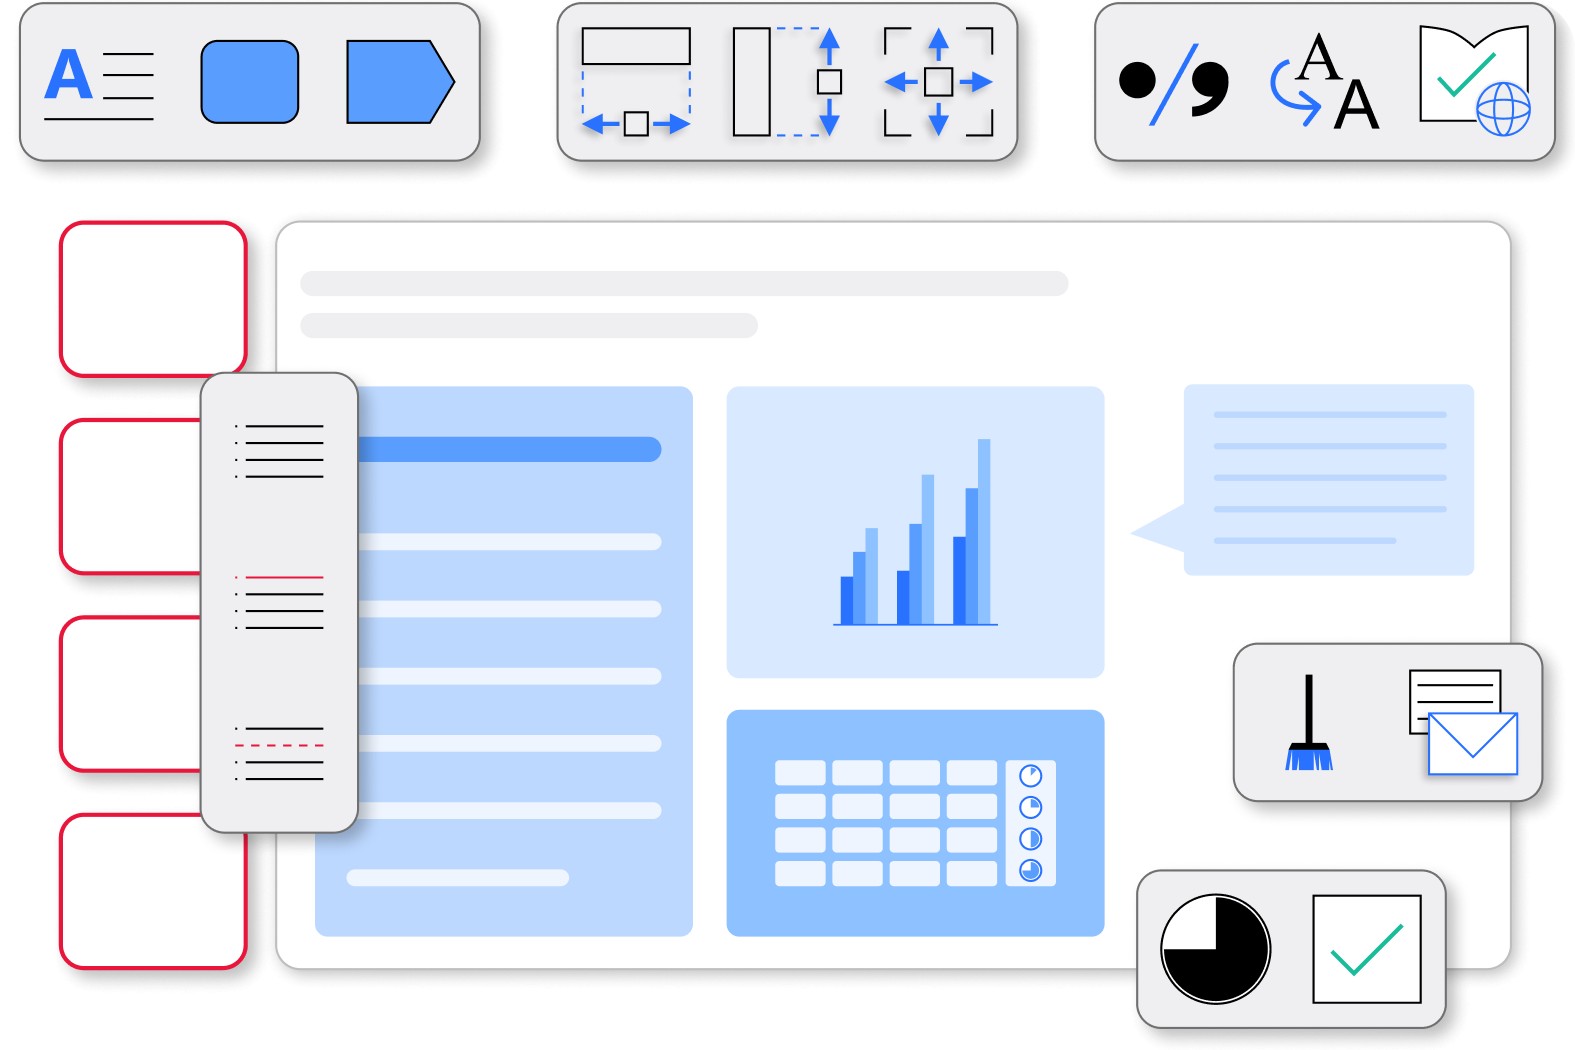
World-class design baked in
Explore 250+ slide templates developed in collaboration with top management consultancies.
Trusted by over 35,000 companies worldwide
People know exceptional software when they see it.

With think-cell, I’m able to work almost three times faster compared to using standard PowerPoint features. It’s a massive time-saver.

I set myself high standards when it comes to the consistency and quality of how my data is presented, and think-cell is an integral part of my daily work to fulfill this goal.

If I need 10 minutes to create a chart natively in PowerPoint, think-cell reduces this to just 3-5 minutes.

The increased efficiency and clearer communication have allowed product owners to present data and findings better, leading to improved decision-making and business results.

If think-cell were to be described in another way, it would be “the time-creating tool.” I think think-cell is not just a convenient add-on tool for PowerPoint, but a solution that reduces the time you spend moving your hands while creating meaningful time for you to use your brain.