Get started with think-cell for free
The world's leading student consulting clubs partner with think-cell to get access to the #1 consulting too.
- Free licenses: For all members
- Exclusive trainings and early access to new features
- Core career skills: Turning data into decisions

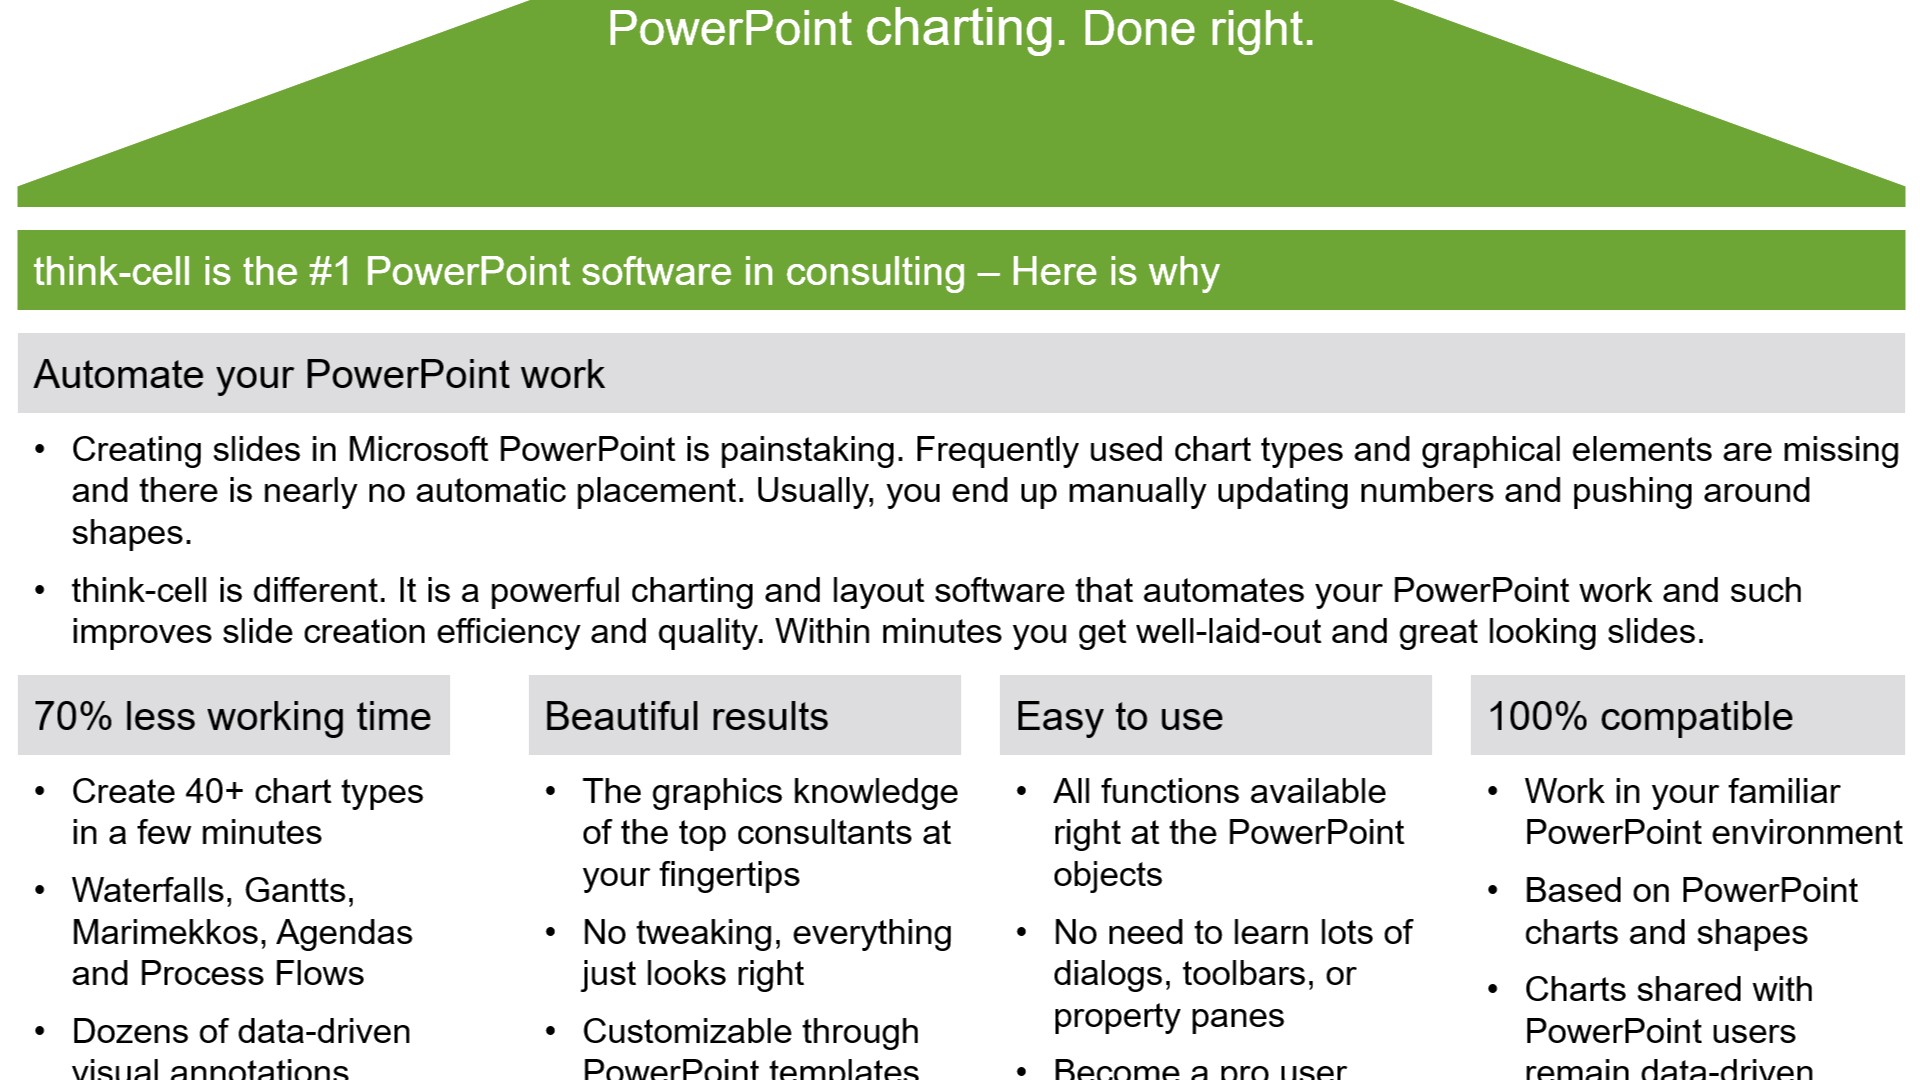
See how think-cell addresses your typical PowerPoint pain points
think-cell helps you create stunning charts in minutes, boosts your slide layout and automates your regular reports. And all this with a single PowerPoint add-in. Here are its most awe-inspiring features.
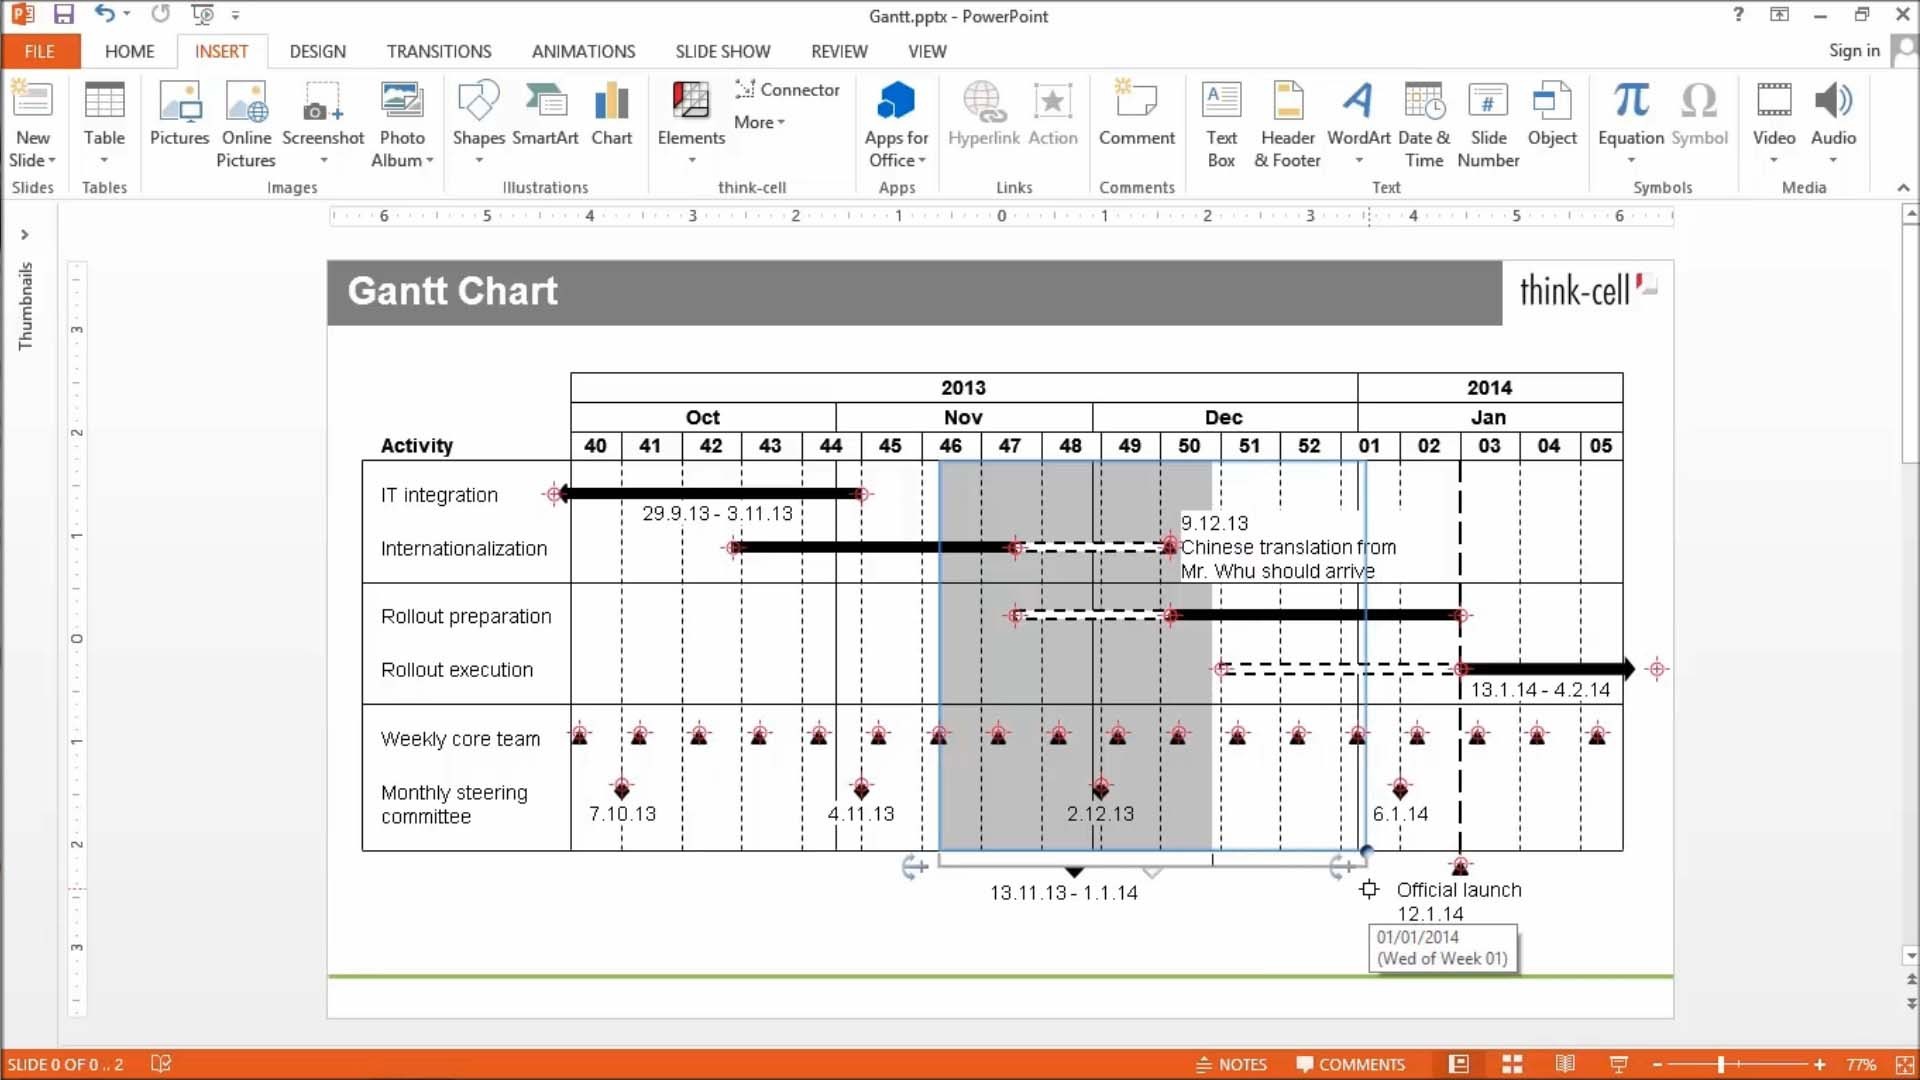
Gantt charts you can create in PowerPoint
Ensure maximum clarity in your project management reporting.
- Show project status with data-driven elements like Harvey balls and checkboxes.
- Choose your timescale and add activity bars and milestones that connect directly to the calendar.
- Add or remove items and the chart adapts automatically to maintain readability.
Waterfall charts without workarounds
Create waterfall charts to show how different drivers contribute to an overall change. Industry standard for EBITDA bridge and P&L statements.
- Display multiple series with stacked segments.
- Include totals and subtotals that calculate automatically.
- Add segments that cross below the baseline.
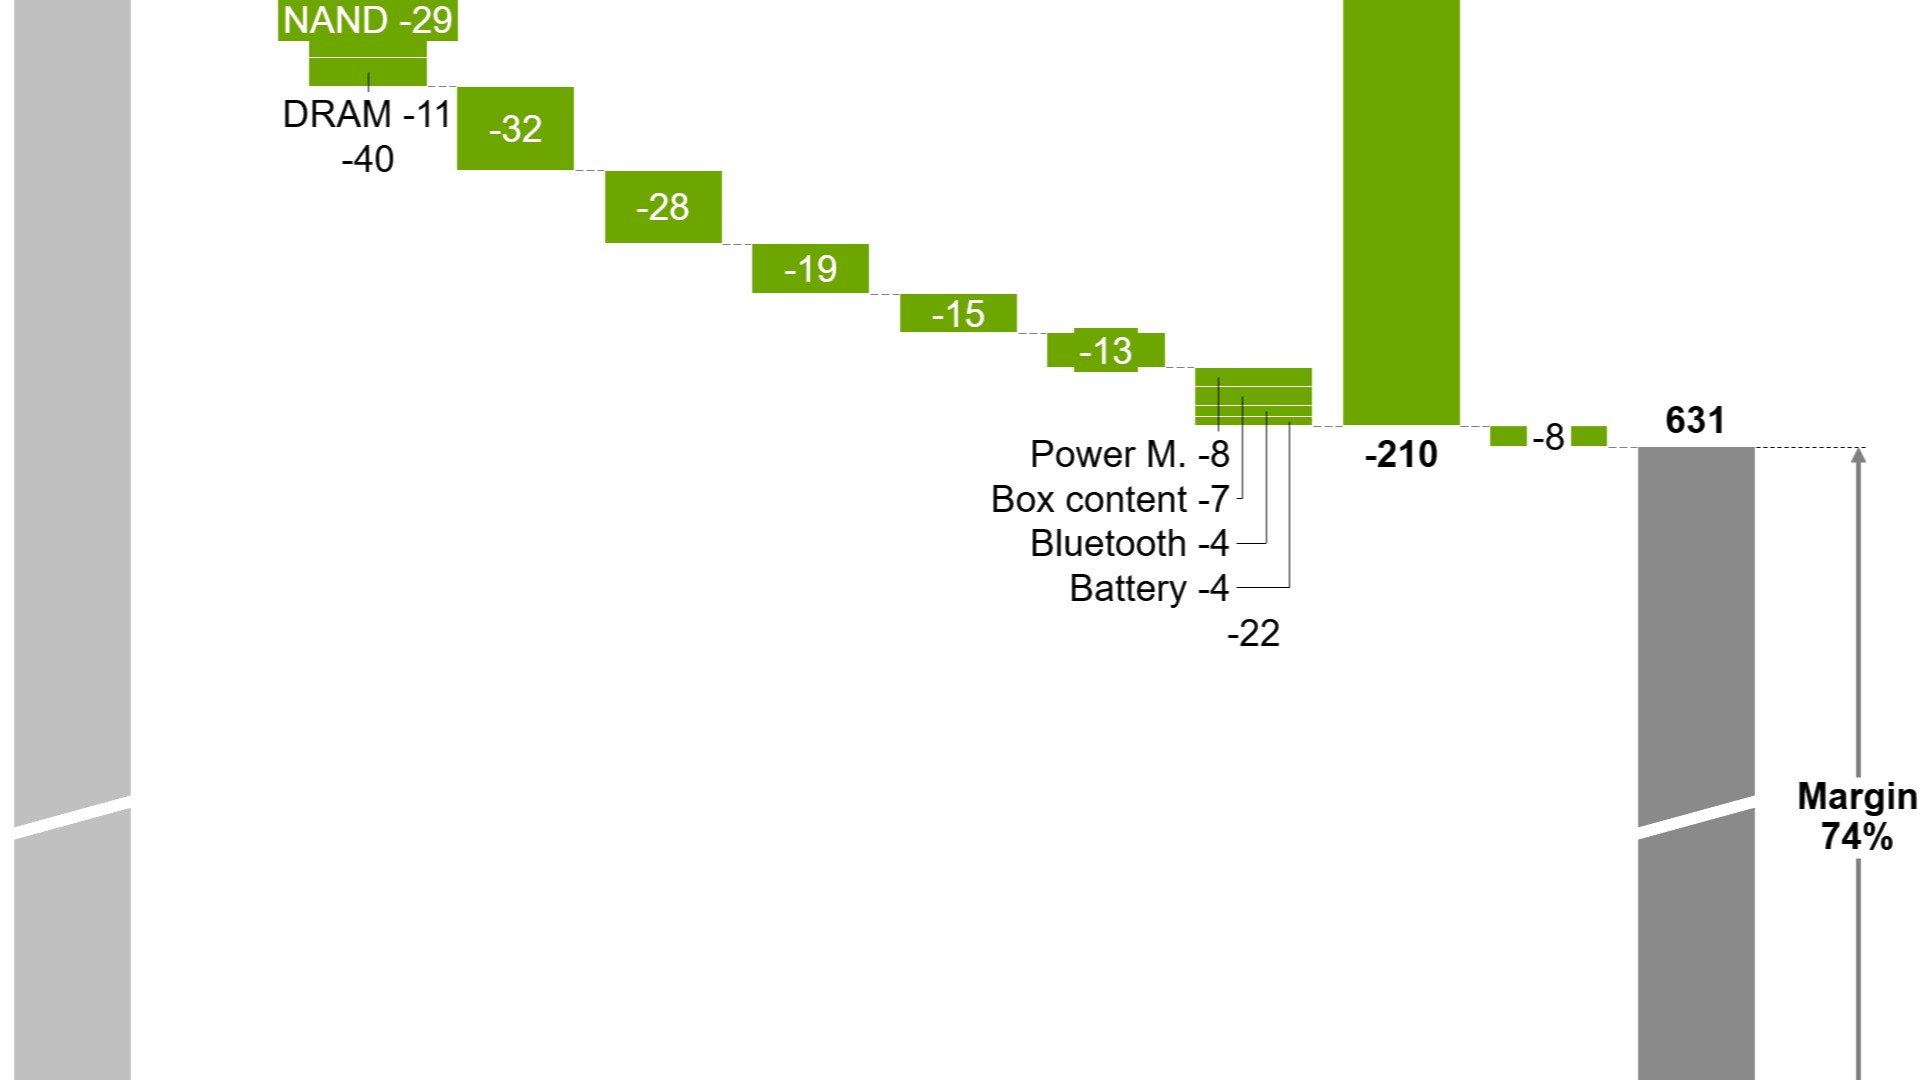
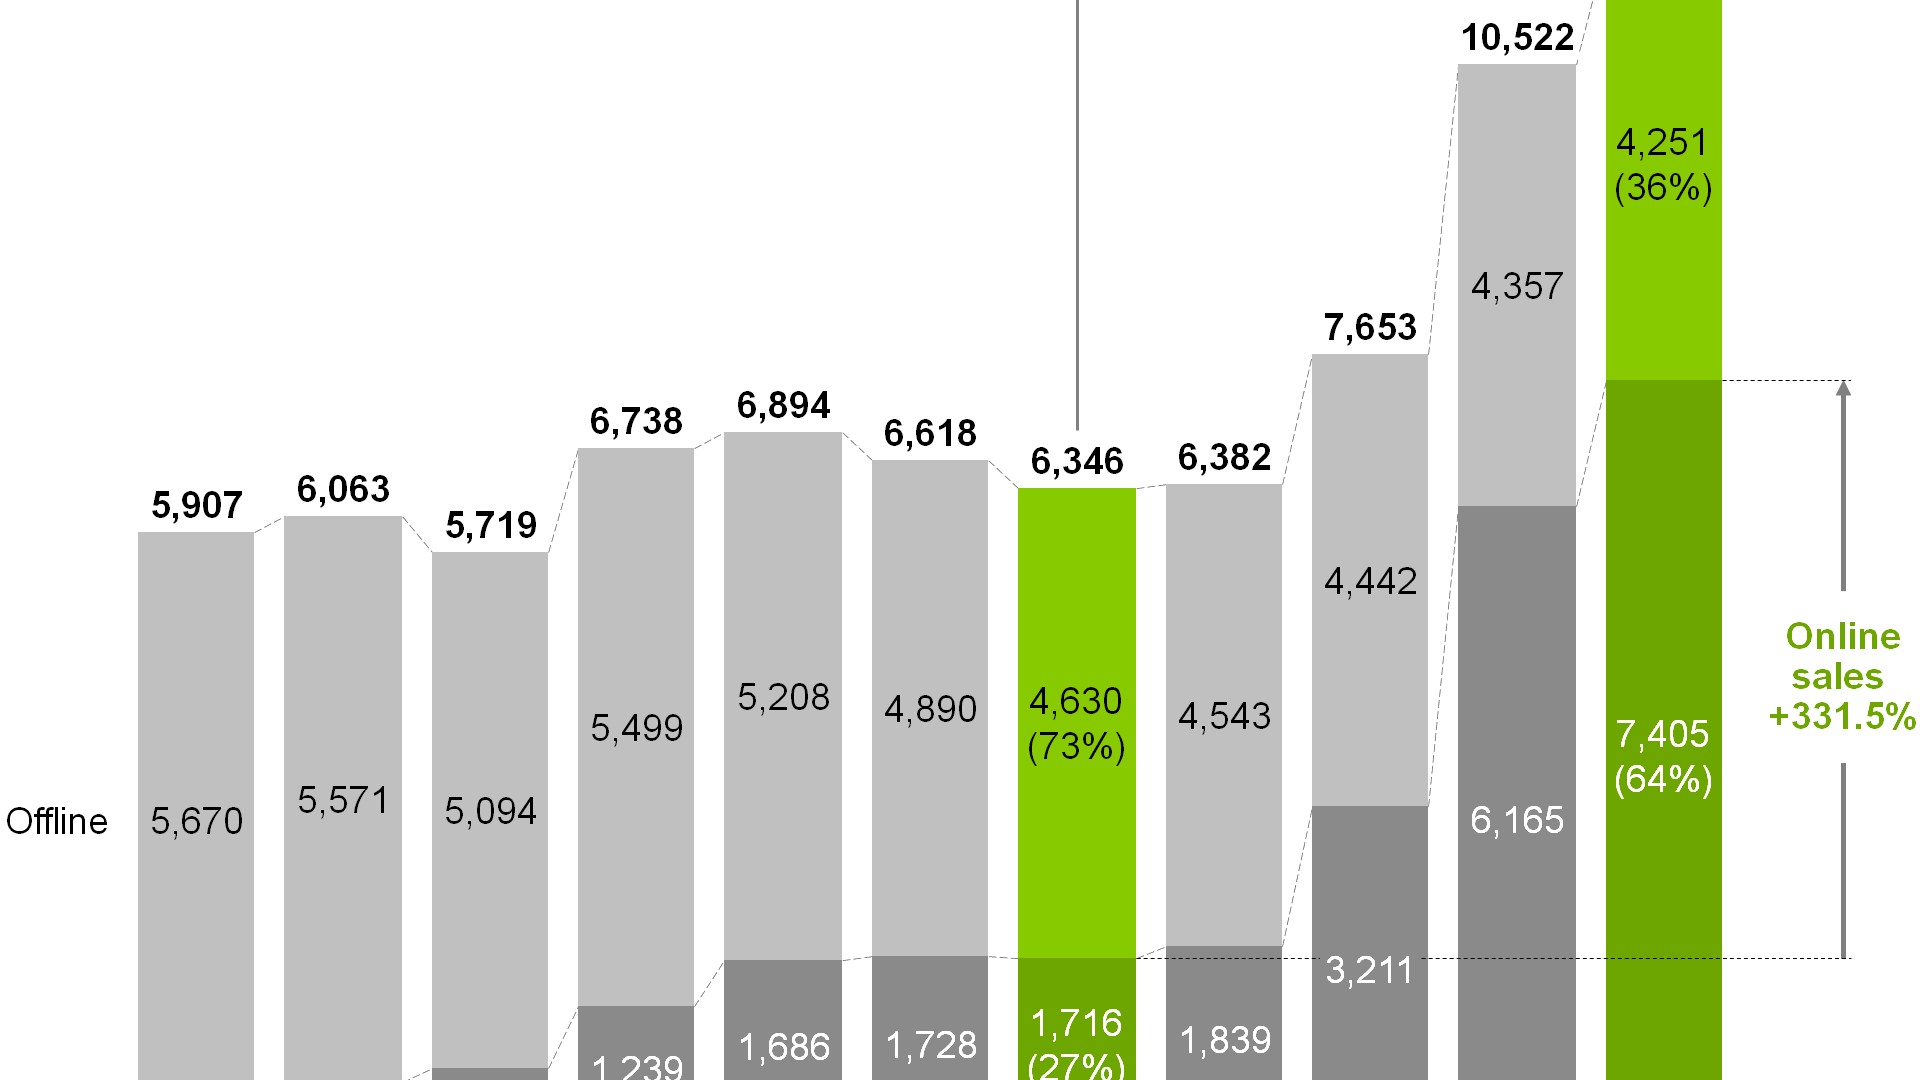
Chart annotations for data-driven stories
Highlight key insights with a range of auto-calculated enhancements that are positioned perfectly for best practice chart layouts.
- Use labels and legends for clearer data communication.
- Add CAGR arrows that automatically update when your chart changes.
- Show your audience what matters with value lines and difference arrows.
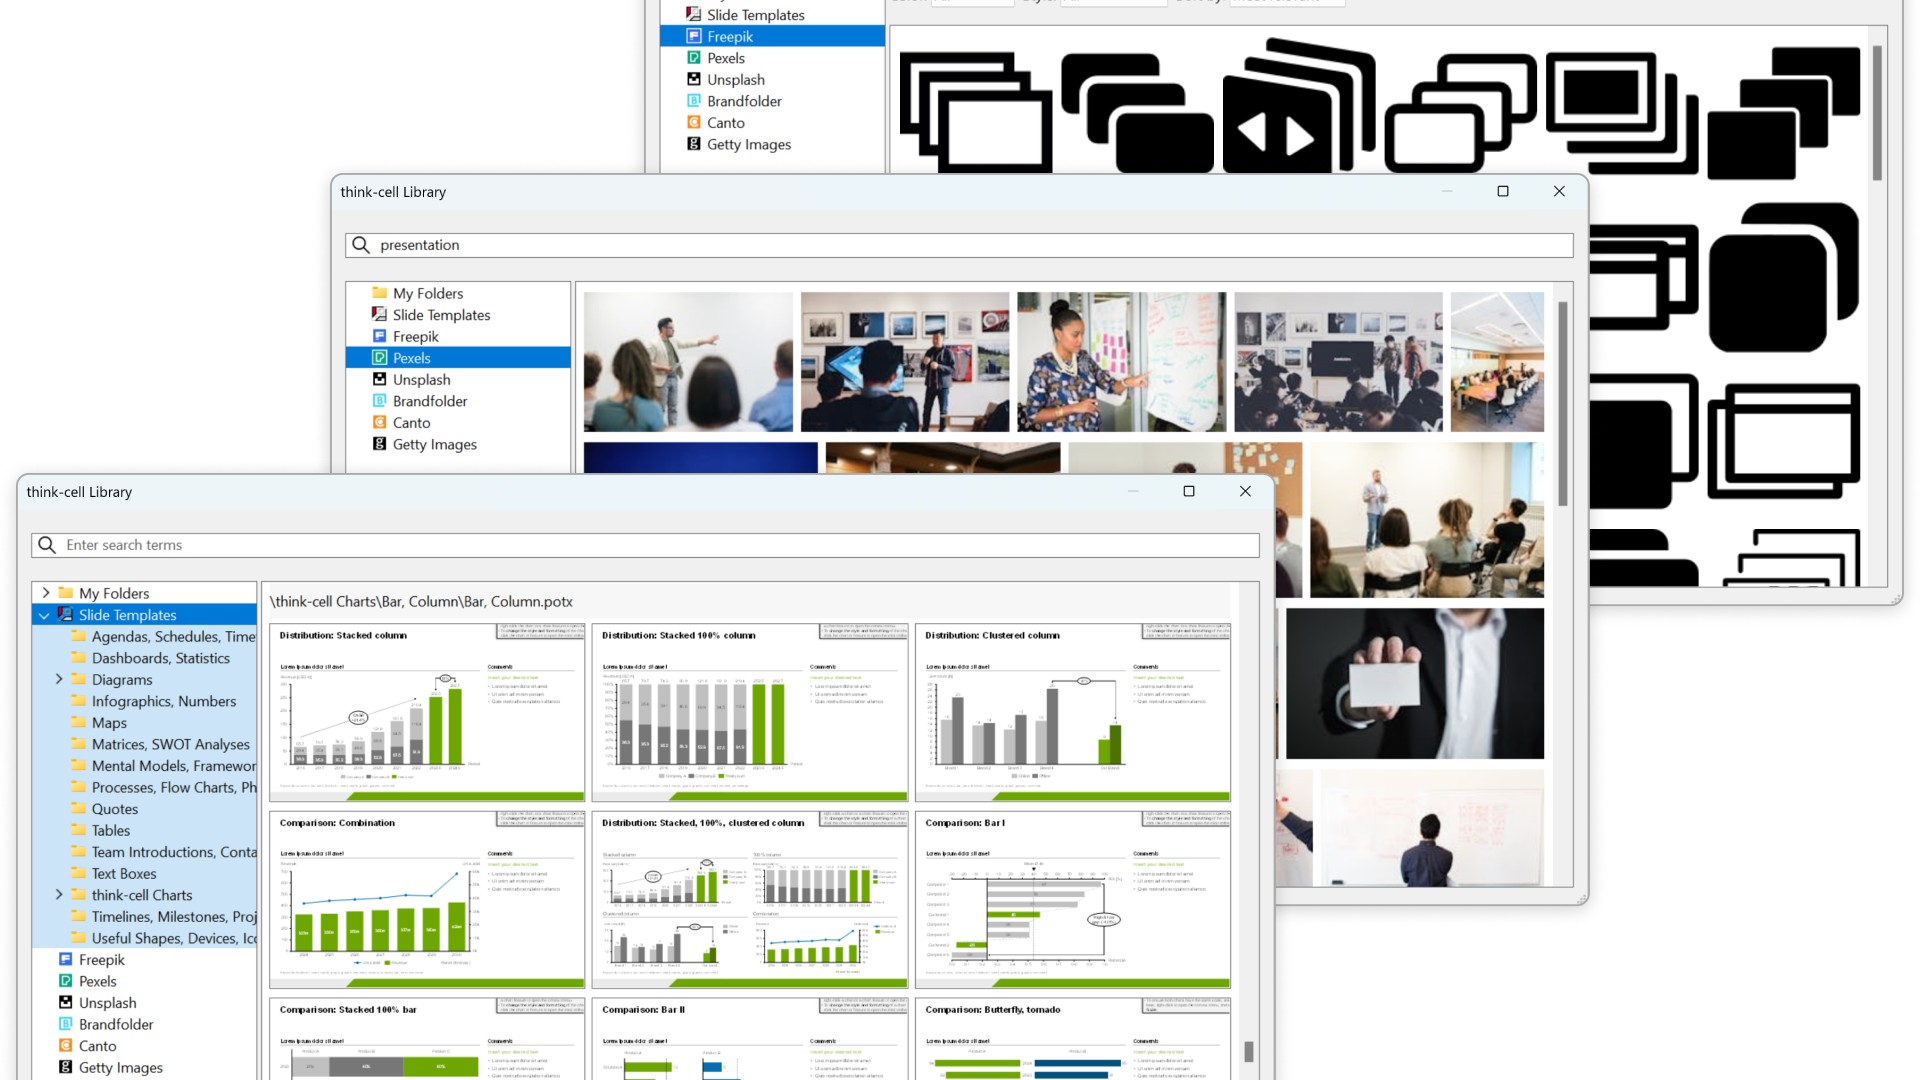
think-cell Library for the assets you need
Start building faster with the perfect foundation for your business presentations.
- Quickly access all your favorite slides, images and presentation resources.
- Draw on over 250 business templates so you never start from a blank slide.
- Find exactly what you need with slide-level search and powerful filters.
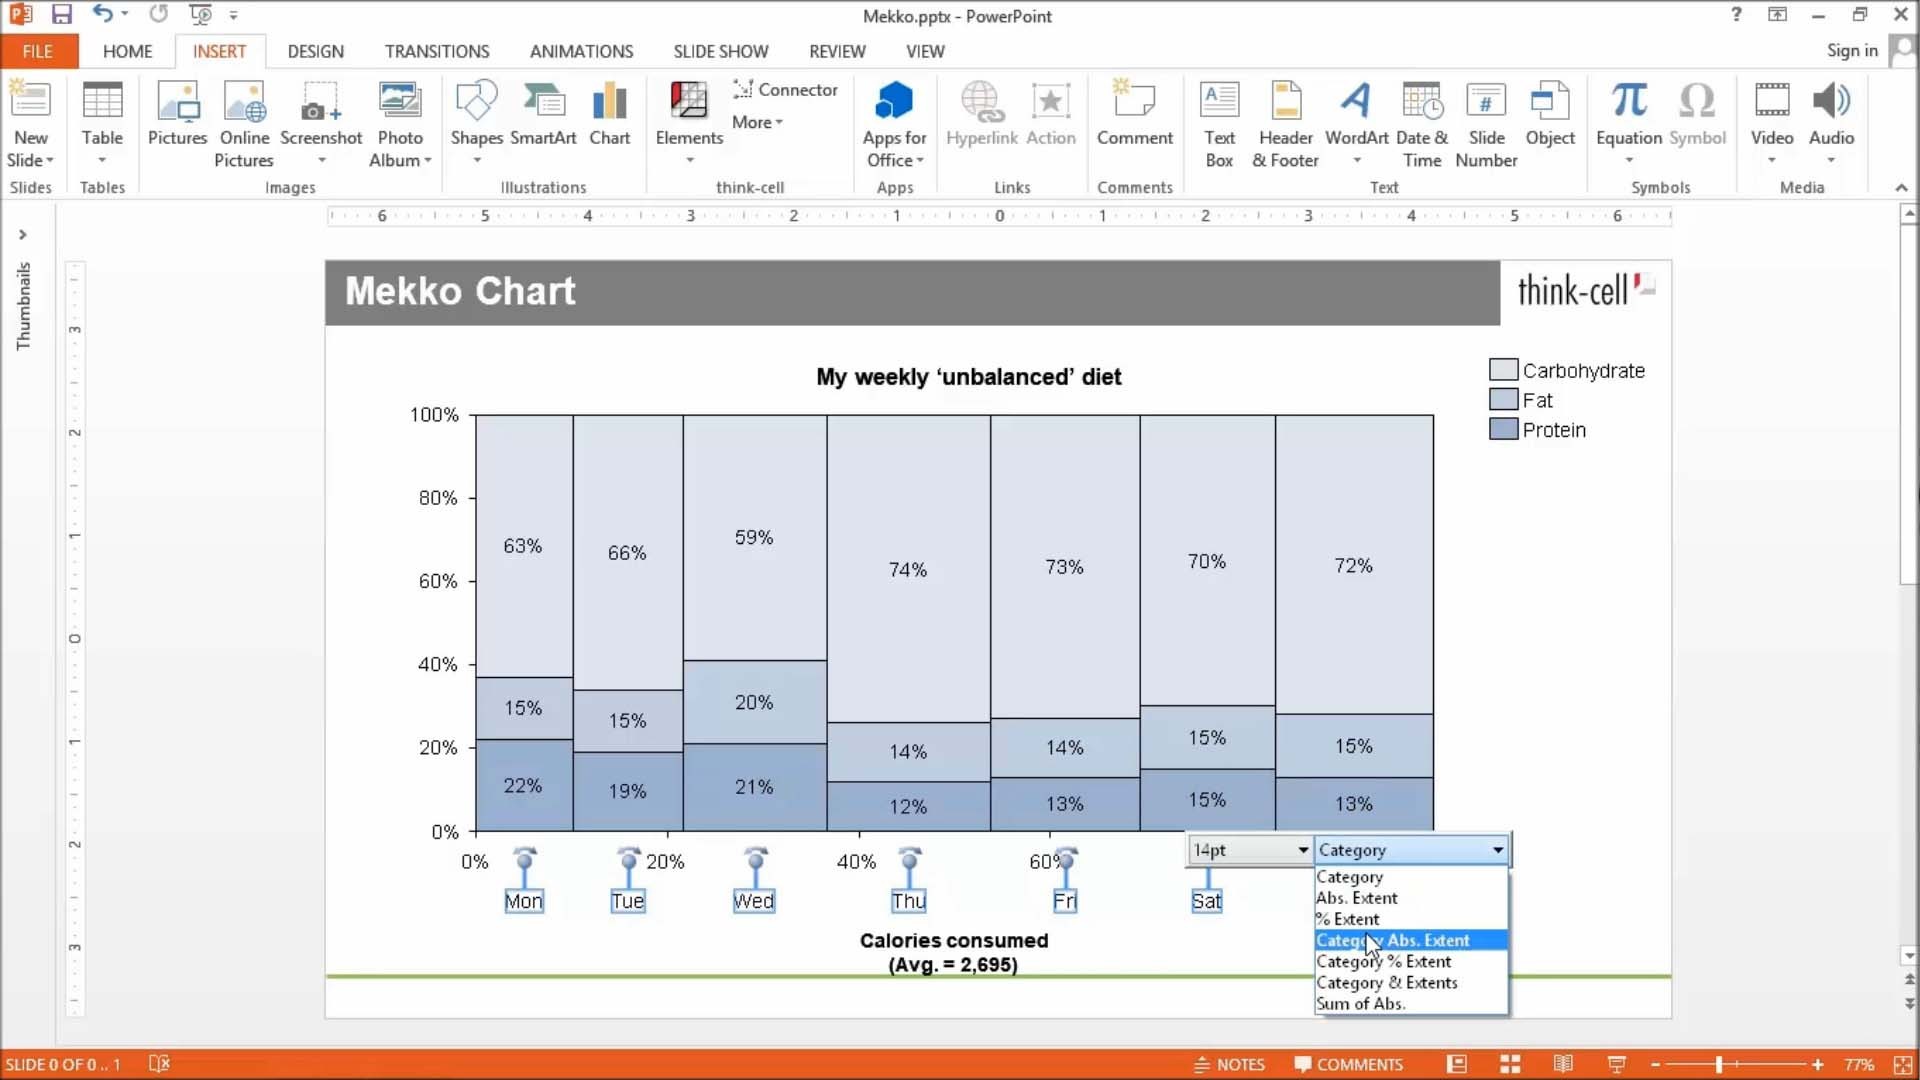
Automated Mekko charts
Build Mekko charts to show data in two dimensions, using column width for total category sizes and height for proportions.
- Choose from unit axis or percentage axis.
- Avoid manual workarounds as column widths are calculated automatically.
- Combine smaller segments to ‘Other’ to reduce noise.
Smart text boxes for professional layouts
Use smart text boxes that automatically form optimized layouts so you can stop worrying about the size and alignment of your slide elements.
- Focus on writing content rather than arranging objects.
- Combine smart text boxes to quickly create tabular structures.
- Make edits and add elements without breaking your slide.
Data automation that gives you full control
Link any content from a cell in Excel to charts or any other object in your PowerPoint presentation.
- Choose between automatic and on-demand updates to stay in control and maintain full data consistency.
- Move, rename or email your Excel files and the links to your presentation will stay intact.
- Integrate data from other sources like Tableau or populate templates with think-cell’s API.
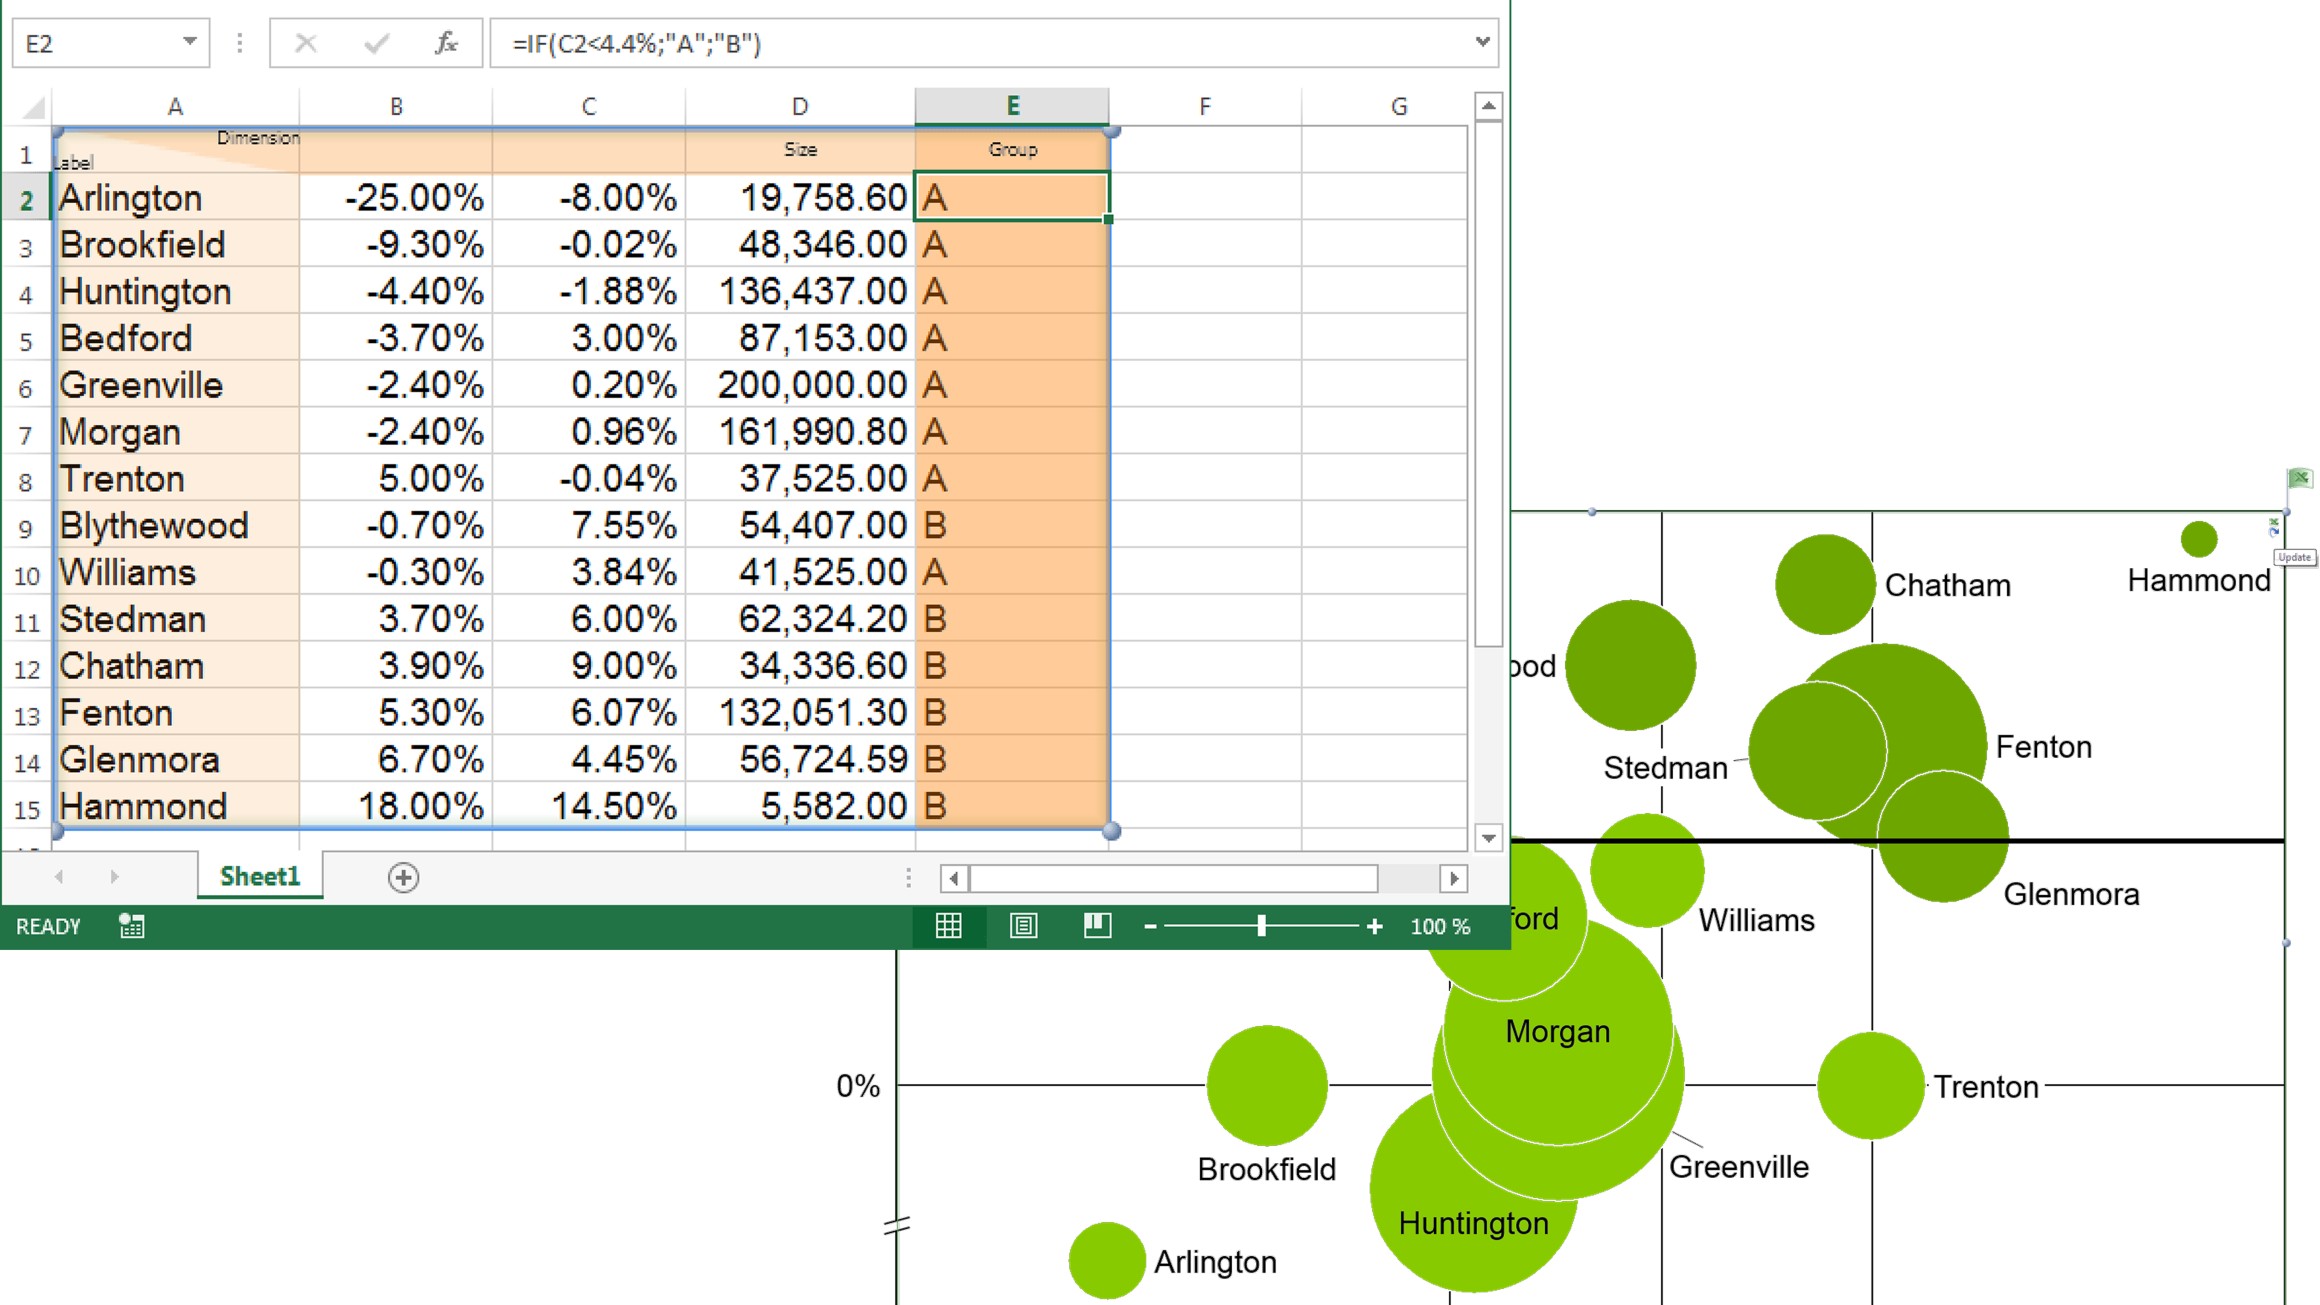
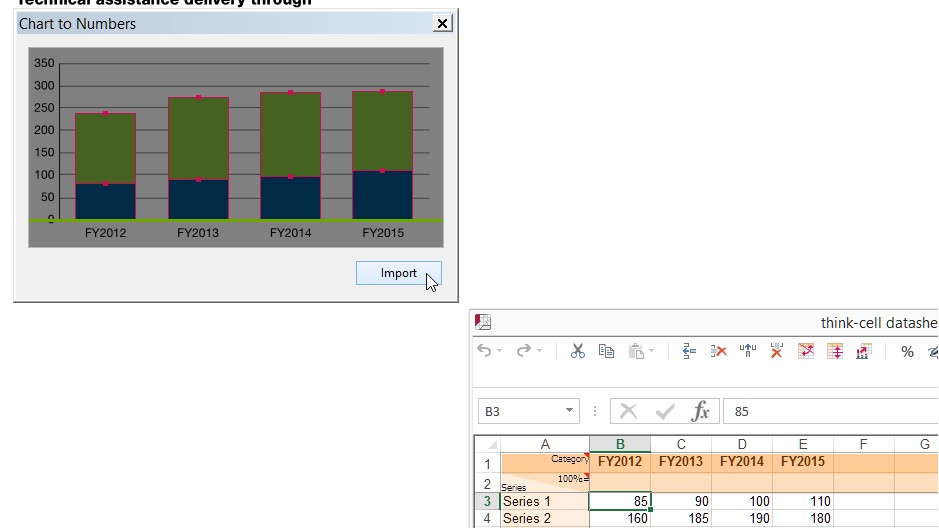
Chart scanner to pull data from images
Instantly convert flat images into fully-functional, data-driven think-cell charts.
- Take a column or bar chart from any source and replicate it in your presentation.
- Capture all chart values and category labels.
- Edit, annotate, and adjust styling as you can with any other think-cell chart.
What students say

Introduced to think-cell by a Cornell professor, it quickly became essential — sharpening mycoursework, preparing me for a top-tier consulting internship, and raising the bar for our entireconsulting club
Program: Undergraduate
Career track: Consulting
Antoine Marc, Bachelor Student Economics and Philosophy at Cornell University

Before a professor told us about think-cell, I often struggled with slides. think-cell removed thegrunt work, allowing me to focus on the content and the message—resulting in stronger impact inless time.
Program: MBA
Career track: Finance
Omkar Dhandhe, MBA Candidate at IIM Ahemdabad
A friend who discovered it in class recommended think-cell to me. It improved my slides, to thepoint where teams rely on me for slide creation and professors have commented on theimprovement. I’m now confident with a tool I know I’ll be using from day one in future roles”
Program: Undergraduate
Career track: Consulting
Kate Smith, Honors Finance & Business Analytics Student at Indiana University

Before think-cell, I struggled with charts and quantitative storytelling. After attending a think-cellworkshop, it played a direct role in strengthening my consulting skill set and winning casecompetition placements”
Program: Undergraduate
Career track: Consulting
Theo Chachati, Bachelor of Business Administration Student at American University of Beirut
The Ambassador Program introduced me to think-cell - and its core in my workflow now. It's mademy visualizations faster, my storytelling clearer, and helped my team reach a case competitionfinal with slides that earned real feedback
Program: Undergraduate
Career track: Consulting
Mehak Kapil, MBA candidate at University of Maryland

I discovered think-cell through a case competition, and it became essential. Tight deadlines goteasier —more time on analysis instead of PPT mechanics. The result: clearer visuals, moreconfident presentations, and stronger case interview and competition results
Program: Undergraduate
Career track: Consulting
Leo Benderski, Bachelor of Science in Business Administration Student at University of Mannheim

I was introduced to think-cell by a professor during my MBA, and it quickly became an essentialpart of my coursework and professional projects. It has significantly increased my efficiency andbecome the tool I rely on to get analysis presentation-ready.
Program: MBA
Career track: Industry
Opeyemi Kayode, MBA Candidate at UNC Kenan-Flager Business School

My marketing professor during my MBA showed us think-cell and it's followed me ever since.From case competitions to my current internship in Treasury-Financial Services, think-cell hasbeen invaluable.
Program: MBA
Career track: Finance
Shivanshu Sinha, MBA Candidate at HHL Leipzig Graduate School of Management
Before a professor told us about think-cell, I often struggled with slides. think-cell removed thegrunt work, allowing me to focus on the content and the message—resulting in stronger impact inless time.
Program: MBA
Career track: Finance
Omkar Dhandhe, MBA Candidate at IIM Ahemdabad

After a think-cell workshop, I started using it in case competitions and consulting projects —cutting chart time significantly and producing more better slides. It made me feel genuinely prepared for real consulting work!
Program: Undergraduate
Career track: Consulting
Joshua Burke, Bachelor in Economic Consulting at Kelley School of Business
Get started with think-cell for free!
* For getting the license no fee has to be paid. However, in return for granting the license we request your consent in receiving our newsletter.