Extensão acadêmica
Vai se formar neste semestre? Não perca o think-cell!
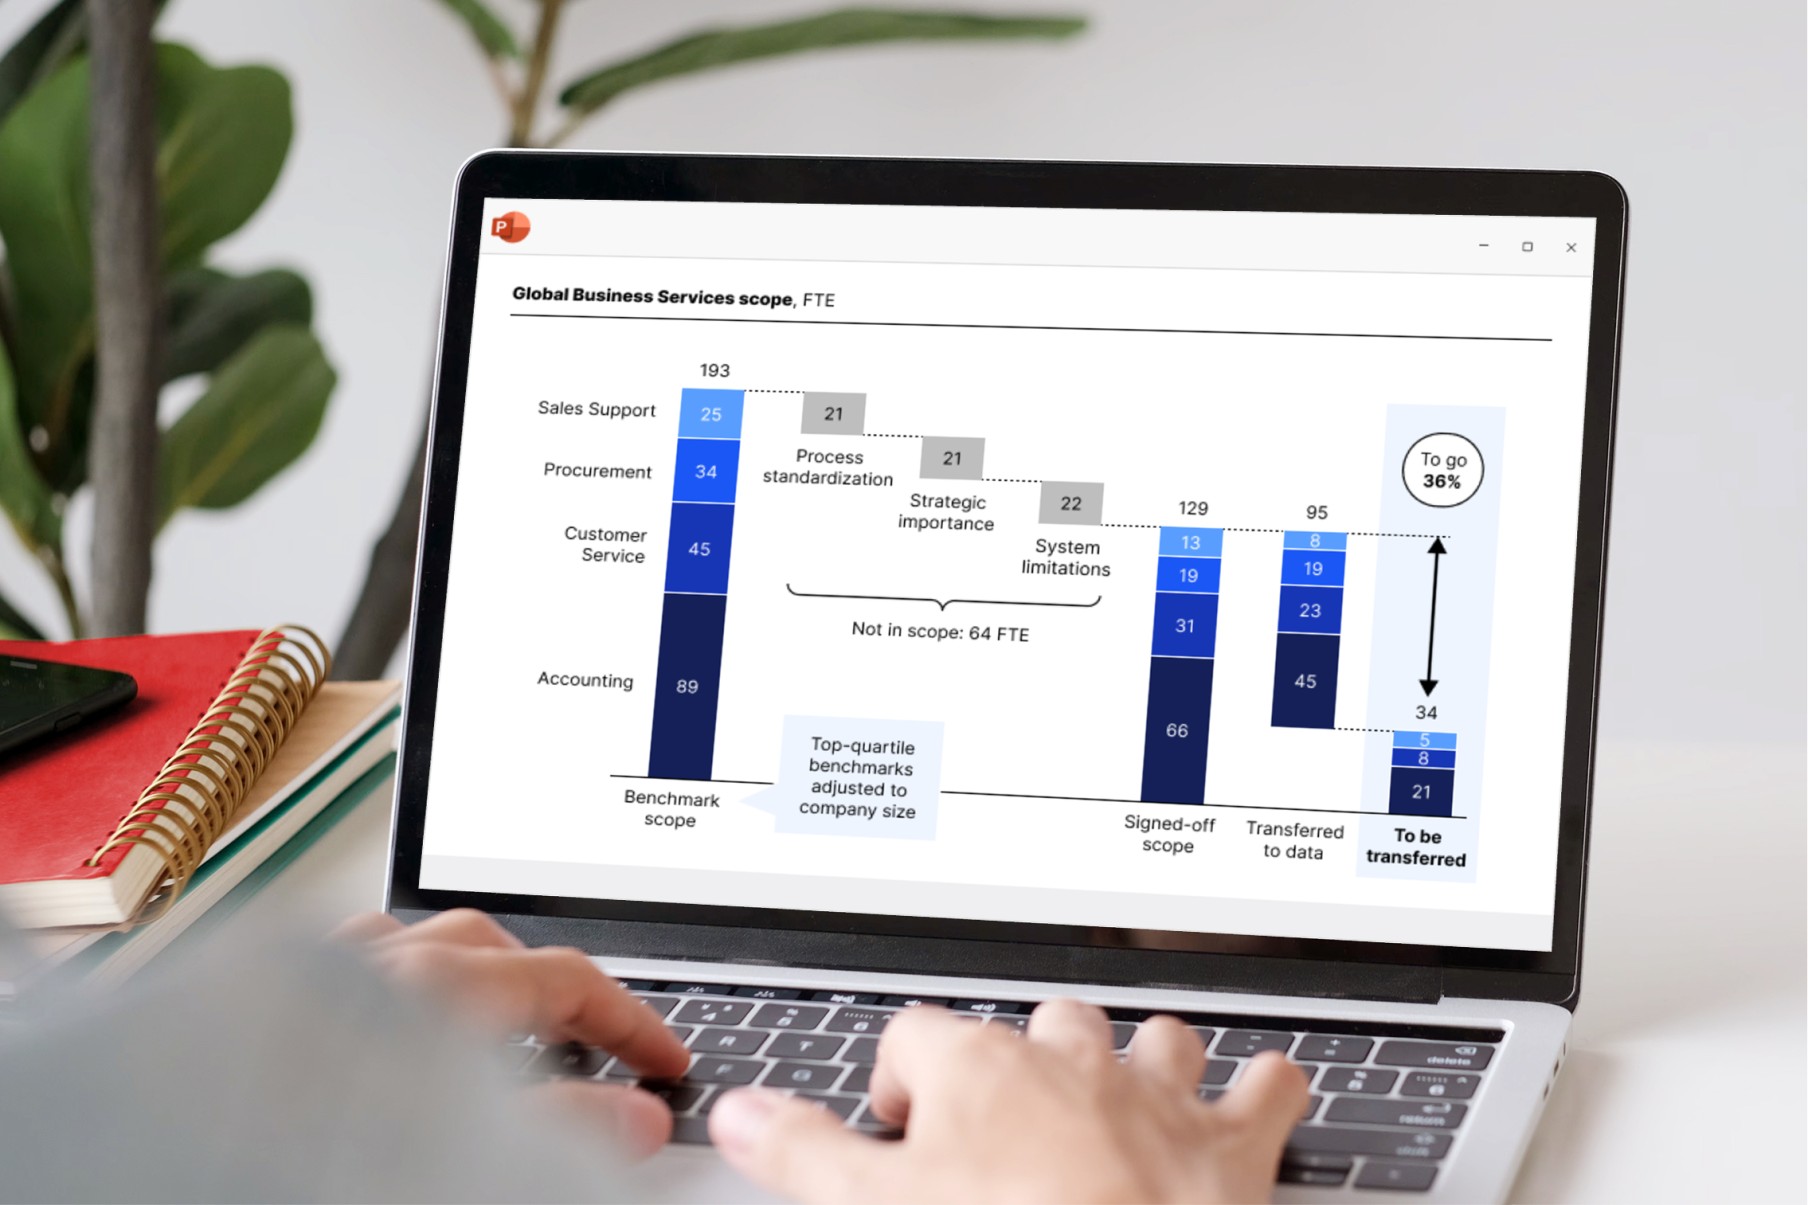
Impressione seu público com o think-cell — o add-in do PowerPoint que
- reduz em 70% o tempo de trabalho
- é usado por 89 das empresas da Fortune 100
- é uma norma padrão emitida em 10 das 10 empresas de consultoria
Formando líderes do futuro, um slide de cada vez
0
Estudantes e professores já usaram o think-cell para aprender, ensinar e fazer pesquisa
0
Instituições acadêmicas parceiras de mais de 80 países
0
As melhores escolas de negócios do mundo são parceiras do think-cell