Pie and doughnut charts
- Home
- Resources
- User manual
- think-cell Charts: Data visualization
- Quantitative charts
- Pie and doughnut charts

Introduction to pie and doughnut charts
|
Icon in Elements menu: |
|
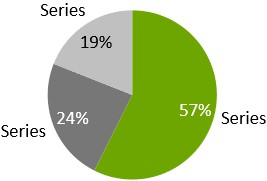
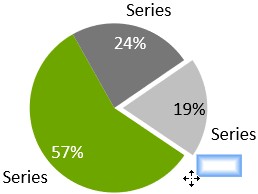
A pie chart or doughnut chart is a special case of a 100% stacked column chart with only one category (column) of data.
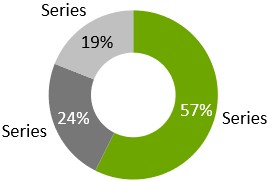
The doughnut chart shows a circular, unfilled area in the middle of the chart.
Each slice of a pie chart or doughnut chart shows four handles, when selected. Each of the handles can be dragged with the mouse to rotate the pie. When rotating, the handles snap at positions 0∘, 90∘, 180∘ and 270∘, making it easy to create an aesthetically pleasing layout.
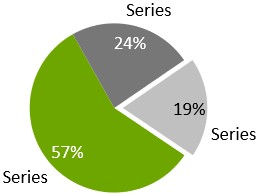
The pie chart or doughnut chart remembers which handle you were dragging when rotating the chart and preserves the correct orientation even when the data is changed. In addition, you can drag the handles away from the pie in order to emphasize the respective pie slice.
You can drag a handle to change the size of the hole in the doughnut chart.
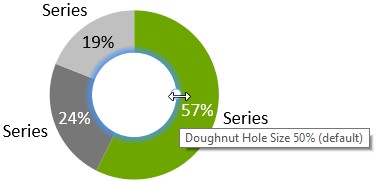
By changing the size to 0%, you change the doughnut chart into a pie chart. You can also use this handle to create a hole in a pie chart, turning it into a doughnut chart.
The labels of the pie chart or doughnut chart support the label content property, which lets you choose if you want to display absolute values, percentages, or both (Label content). Additionally you can move each outer label to place it anywhere on the outer edge of the respective slice.
To add a title label to a doughnut chart, use 
Universal connectors can be used to connect pie charts or doughnut charts with other chart types (see Universal connectors).
Change the slice order
You can change the order in which slices appear in pie and doughnut charts. To do so, follow these steps:
- Select the chart to open its mini toolbar.
- On the Slice Order menu, choose the slice order that you want.
- Sheet Order Clockwise: Slices appear clockwise in the same order as the linked data range.
- Sheet Order Counterclockwise: Slices appear counterclockwise in the same order as the linked data range.
- Ascending Order Clockwise: Slices appear clockwise from smallest to largest.
- Descending Order Clockwise: Slices appear clockwise from largest to smallest.
To learn when to use (or not to use) a pie chart, read this blog article.
Need to troubleshoot?
Check our knowledge base